- Market Value (2025): USD 4.86 Bn
- Estimated Value (2026): USD 5.79 Bn
- Forecast Value (2036): USD 33.6 Bn
- CAGR (2026-2036): 19.2%
What is the Agricultural UAV Market forecast to be worth by 2036?
USD 5.79 billion in 2026 to USD 33.6 billion by 2036, at a 19.2% CAGR.
- As per Fact.MR analysis, the agricultural UAV market reached USD 4.86 billion in 2025.
- Sales are projected to increase from USD 5.79 billion in 2026 to USD 33.6 billion by 2036.
- The market indicates a 19.2% CAGR during 2026 to 2036 as farmers and agricultural service operators expand aerial field inspection and spraying.
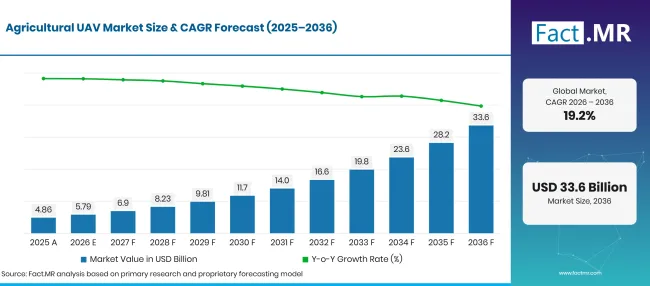
Agricultural Uav Market Forecast Global | Source: Fact.MR
| Year | Basis | Market Value (USD billion) |
|---|---|---|
| 2025 | Actual | 4.86 |
| 2026 | Estimate | 5.79 |
| 2036 | Forecast | 33.6 |
| CAGR 2026 to 2036 | Forecast period | 19.2% |
Source: Fact.MR analysis. Updated Oct 23, 2026
What are the defining numbers behind Agricultural UAV Market growth?
USD 27.8 billion additional market value between 2026 and 2036, with rotary-wing systems and crop monitoring among the main areas of spending.
- Demand Drivers in the Market
- Crop advisers use high-resolution UAV images to locate differences in plant health before choosing which fields need closer inspection. Repeat flights help compare conditions at different stages of the growing season.
- Farmers choosing spraying drones compare tank capacity, usable flight time and access to individual fields. Drones can also reach wet or uneven fields where ground equipment is difficult to operate.
- Agricultural contractors operate drones for several farms, allowing customers to share the cost of pilots and maintenance. Local service coverage is useful for growers without trained flight crews.
- Operators increasingly compare hardware quality with mapping software and after-sales support. DJI reported more than 600,000 agricultural drones operating globally by the end of 2025 [1], showing the scale of its deployed equipment base.
- Key Segments Analyzed
- By Product Type: Rotary-Wing holds 58.2% share in 2026 as hovering and low-speed operation fit inspection and spraying work.
- By Application: Crop Monitoring leads with 33.9% share in 2026 as growers use aerial imagery to identify field variation.
- By Component: Hardware accounts for 52.9% share in 2026 because airframes and sensor systems are important to each deployment.
- By End-User: Farmers capture 45.0% share in 2026 as individual growers select equipment for their own field operations.
- Analyst Opinion at Fact.MR
- Shambhu Nath Jha, Principal Consultant at Fact.MR, states, “Agricultural UAV purchases are shaped by the work a farm expects an aircraft to perform. Imaging missions require reliable cameras and practical mapping outputs, while spray missions require field-ready payload capacity and a trained operator.”
- Strategic Implications
- Aircraft manufacturers should match spraying payloads and sensor choices to the crops and field sizes served by each model. Local support arrangements are a practical part of equipment selection.
- Farm operators need to compare the full cost of ownership with the number of days an aircraft can actually work. Training expenses and aircraft downtime can change the benefit of ownership.
- Cooperatives can organize shared aircraft access when growers need seasonal mapping but lack enough work for a dedicated fleet. A qualified pilot remains necessary for safe operations.
- Software providers should simplify how aerial images become workable field maps. Clear exports and consistent field boundaries help agronomists use results in daily crop decisions.
The United Kingdom is projected to register 23.7% CAGR through 2036 as crop-service firms assess aerial mapping. Brazil follows at 23.0% as extensive crop areas support contractor operations. Japan is estimated to grow at 20.1% amid labour pressure on farms. The United States carries 16.6% growth as operators consider precision services, while Germany records 13.6% as field imaging fits established crop management.
How does the Agricultural UAV Market break down by segment?
Rotary-Wing 58.2%; Crop Monitoring 33.9%; Hardware 52.9%; Farmers 45.0% in 2026.
Which Product Type dominates?
Rotary-Wing holds 58.2% share in 2026.
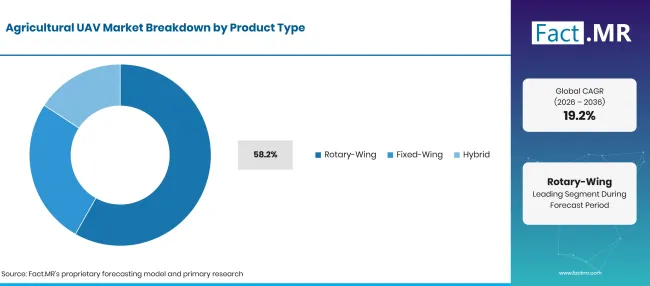
Agricultural Uav Market Breakdown Product Type | Source: Fact.MR
| Product Type | Share (2026) |
|---|---|
| Rotary-Wing (Leading segment) | 58.2% |
| Other segments combined | 41.8% |
| Total | 100.0% |
Source: Fact.MR analysis. Updated Oct 23, 2026
Rotary-wing aircraft can hover above a field and fly at low speed when an operator needs a closer view of a crop. The same flight behaviour is useful when placing agricultural inputs in a defined area. Fixed-wing models are more suitable for covering long routes where continuous forward flight helps survey broad farmland. Hybrid systems combine aspects of both designs, although service support and flight planning still matter for each configuration.
What leads the Application segment?
Crop Monitoring holds 33.9% share in 2026.
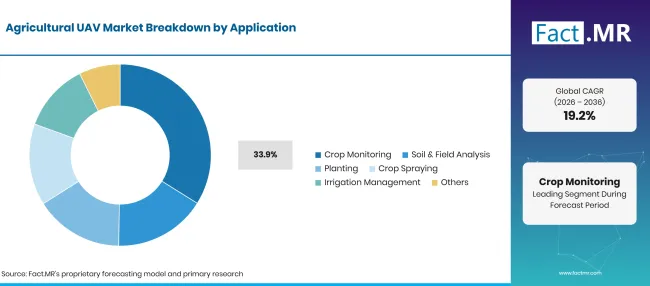
Agricultural Uav Market Breakdown Application | Source: Fact.MR
| Application | Share (2026) |
|---|---|
| Crop Monitoring (Leading segment) | 33.9% |
| Other segments combined | 66.1% |
| Total | 100.0% |
Source: Fact.MR analysis. Updated Oct 23, 2026
Crop monitoring starts with images taken across individual fields. Agronomists use the results to flag uneven plant cover and choose sites for direct inspection. Soil and field analysis depends on sensors and interpretation software, while planting uses payload arrangements suited to distributing material. Crop spraying requires attention to application rules and approved treatment methods. Irrigation management relies on repeated observations that help teams decide where ground checks are useful.
How do Component purchases shape the market?
Hardware holds 52.9% share in 2026.
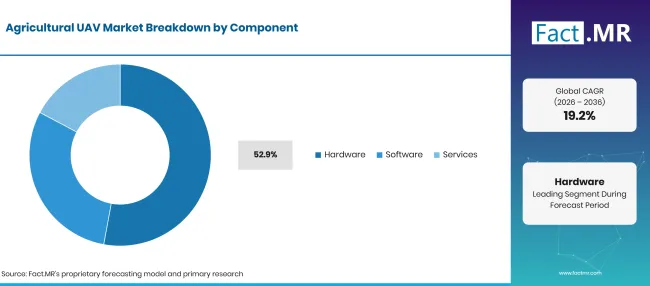
Agricultural Uav Market Breakdown Component | Source: Fact.MR
| Component | Share (2026) |
|---|---|
| Hardware (Leading segment) | 52.9% |
| Other segments combined | 47.1% |
| Total | 100.0% |
Source: Fact.MR analysis. Updated Oct 23, 2026
Hardware includes the aircraft body and the equipment carried during flight. Farmers consider camera quality for crop observation, while spray operators examine payload and service access. Software has a separate role in organising images and turning survey results into field maps. Service providers handle flights or data processing for farms without their own aircraft. The right combination depends on whether the farm needs its own equipment or a service provider.
Which End-User represents the larger share?
Farmers holds 45.0% share in 2026.
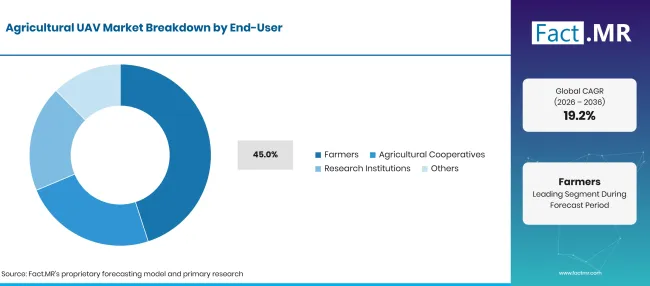
Agricultural Uav Market Breakdown End User | Source: Fact.MR
| End-User | Share (2026) |
|---|---|
| Farmers (Leading segment) | 45.0% |
| Other segments combined | 55.0% |
| Total | 100.0% |
Source: Fact.MR analysis. Updated Oct 23, 2026
Farmers purchase or use agricultural UAVs to examine field conditions and support routine crop decisions. Agricultural cooperatives may arrange shared equipment so several members can use mapping at different times. Research institutions apply aerial observations in field trials where repeated measurement is useful. Contractors also serve farms that prefer to pay for flights. Farms can therefore benefit from drone services even when they do not own an aircraft.
What is accelerating Agricultural UAV Market adoption, and what is holding it back?
Field imagery and targeted spraying support investment, while operating approval and service cost affect buying decisions.
Drivers Impact Analysis
| DRIVER | (~) % IMPACT ON CAGR | GEOGRAPHIC RELEVANCE | IMPACT TIMELINE |
|---|---|---|---|
| Crop inspection needs | +1.0% | Global | Medium term (2–4 years) |
| Targeted input application | +0.8% | Brazil, United States, Japan | Medium term (2–4 years) |
| Contractor fleet services | +0.7% | Global | Short term (<= 2 years) |
| Imaging and field maps | +0.5% | Europe, North America | Medium term (2–4 years) |
| Equipment improvements | +0.4% | Global | Long term (>= 4 years) |
Source: Fact.MR analysis. Updated Oct 23, 2026
Opportunity Impact Analysis
| OPPORTUNITY | (~) % IMPACT ON CAGR | GEOGRAPHIC RELEVANCE | IMPACT TIMELINE |
|---|---|---|---|
| Seasonal contract spraying | +0.8% | Brazil, Japan | Medium term (2–4 years) |
| Cooperative mapping services | +0.6% | Europe | Short term (<= 2 years) |
| Sensor interpretation services | +0.5% | Global | Medium term (2–4 years) |
| Service and maintenance networks | +0.4% | Global | Long term (>= 4 years) |
Source: Fact.MR analysis. Updated Oct 23, 2026
Restraints Impact Analysis
| RESTRAINT | (~) % IMPACT ON CAGR | GEOGRAPHIC RELEVANCE | IMPACT TIMELINE |
|---|---|---|---|
| Flight and spraying rules | -0.8% | Global | Short term (<= 2 years) |
| Pilot training expense | -0.6% | Global | Medium term (2–4 years) |
| Battery and payload limits | -0.5% | Global | Medium term (2–4 years) |
| Seasonal use patterns | -0.4% | Global | Long term (>= 4 years) |
Source: Fact.MR analysis. Updated Oct 23, 2026
Which countries are scaling the Agricultural UAV Market through 2036?
| Country | CAGR (2026–2036) |
|---|---|
| United Kingdom | 23.7% |
| Brazil | 23.0% |
| Japan | 20.1% |
| United States | 16.6% |
| Germany | 13.6% |
Source: Fact.MR analysis. Updated Oct 23, 2026
How is the United Kingdom expanding agricultural UAV use?
23.7% CAGR through 2036, reflecting farm-specific aerial monitoring and application needs.
The United Kingdom is forecast to record a 23.7% CAGR through 2036 as crop advisers develop aerial scouting services for growers who need regular field checks. The Department for Environment, Food & Rural Affairs recorded 16.8 million hectares of utilised agricultural area in December 2025 [4]. The same DEFRA release reports 6.1 million hectares of croppable area in 2025, providing a more specific measure of the land available for crop surveys and field-monitoring services. The Farming Equipment and Technology Fund 2025 offered grants of £1,000 to £25,000 within its eligible themes [5].
What supports agricultural UAV sales in Brazil?
23.0% CAGR through 2036, reflecting farm-specific aerial monitoring and application needs.
Brazil is anticipated to register a 23.0% CAGR through 2036 as soybean producers consider aerial inspection across extensive growing areas. The Brazilian Institute of Geography and Statistics (IBGE) recorded 47,621,662 hectares of soybeans harvested in 2025 [6]. UAV contractors can use repeated flights to identify uneven field conditions and direct an agronomist to the right location before ground inspection. In January 2026, IBGE reported an estimate of 346.1 million tonnes for Brazil's 2025 grain and oilseed harvest [7].
How does Japan use UAVs to address farm operations?
20.1% CAGR through 2036, reflecting farm-specific aerial monitoring and application needs.
Japan is projected to achieve a 20.1% CAGR through 2036 as agricultural operators seek practical ways to monitor fields and complete crop treatments with limited staffing. The Ministry of Agriculture, Forestry and Fisheries reported 836,000 agricultural management entities in its March 2026 release of the 2025 census [8]. Crop-service businesses can spread trained operator costs across farms that use an aircraft only during selected parts of the growing season. The same census reported an average managed cultivated area of 3.6 hectares per entity.
What influences agricultural UAV adoption in the United States?
16.6% CAGR through 2036, reflecting farm-specific aerial monitoring and application needs.
The United States is forecast to post a 16.6% CAGR through 2036 as large crop farms compare routine aerial scouting with paid UAV application services. The Federal Aviation Administration's 2025 aerospace forecast recorded 1,079 new exemptions for large agricultural unmanned aircraft during 2024 [9]. Those approvals document operator activity in the agricultural category and help explain why training and compliance remain part of service planning. In May 2026, the FAA issued updated guidance for agricultural UAS certification under Part 137 [3].
Why is Germany a distinct agricultural UAV market?
13.6% CAGR through 2036, reflecting farm-specific aerial monitoring and application needs.
Germany is estimated to record a 13.6% CAGR through 2036 as crop advisers use aerial imagery alongside established field-management tools. The Federal Statistical Office reported about 16.59 million hectares of utilised agricultural land in 2025 [10]. This land base provides space for crop monitoring, although farmers usually assess whether new survey images improve a decision already made through field walks or machinery records.
Who leads the Agricultural UAV Market?
DJI and Yamaha Motor supply agricultural spraying equipment, while Parrot and AgEagle Aerial Systems Inc. (dba EagleNXT) focus on aerial imaging applications.
DJI sells the Agras series for agricultural spraying and spreading, while Yamaha Motor has an established agricultural unmanned helicopter business. Product evaluation differs across these categories because spray crews need reliable payload operation while imaging users place more weight on sensors and mapping output. DJI described a global launch of its Agras T100, T70P and T25P in July 2025 [2].
Parrot supplies drones and camera technology suitable for field observation applications. AgEagle Aerial Systems Inc. (dba EagleNXT) has marketed fixed-wing mapping aircraft under the eBee family. Delair provides professional UAV systems, while Sentera (John Deere) focuses on agricultural imaging and related data services. Trimble participates in precision agriculture through positioning and farm workflows.
Which companies are the key providers?
Key companies include DJI; Parrot SA; AgEagle Aerial Systems Inc. (dba EagleNXT); Yamaha Motor Co. Ltd.; Trimble Inc.; Delair; Sentera (John Deere).
- DJI
- Parrot SA
- AgEagle Aerial Systems Inc. (dba EagleNXT)
- Yamaha Motor Co. Ltd.
- Trimble Inc.
- Delair
- Sentera (John Deere)
Bibliography
- [1] DJI. (2026, April 29). DJI Agriculture reveals global adoption of agricultural drones cuts 51Mt in carbon emissions and saves 410Mts of water for farmers globally.
- [2] DJI. (2025, July 15). DJI Agras T100, T70P and T25P launches globally.
- [3] Federal Aviation Administration. (2026, May 15). Notice 8900.773: Title 14 CFR Part 137 unmanned aircraft systems (UAS) certification.
- [4] Department for Environment, Food & Rural Affairs. (2025, December 17). Agricultural land use in United Kingdom at 1 June 2025.
- [5] Department for Environment, Food & Rural Affairs. (2025, May 7). Farming Equipment and Technology Fund 2025.
- [6] Instituto Brasileiro de Geografia e Estatística. (n.d.). Produção de soja no Brasil.
- [7] Instituto Brasileiro de Geografia e Estatística. (2026, January 15). Em dezembro, IBGE prevê safra de 346,1 milhões de toneladas para 2025 e de 339,8 milhões de toneladas para 2026.
- [8] Ministry of Agriculture, Forestry and Fisheries. (2026, March 31).[Publication of the final results summary of the 2025 Census of Agriculture and Forestry].
- [9] Federal Aviation Administration. (2025). Compendium to FAA Aerospace Forecast FY 2025–2045: Emerging aviation entrants—Unmanned aircraft systems and advanced air mobility.
- [10] Statistisches Bundesamt (Destatis). (2025, December 5). Agricultural holdings and utilised agricultural area by size of the utilised agricultural area. https://www.destatis.de/EN/Themes/Economic-Sectors-Enterprises/Agriculture-Forestry-Fisheries/Agricultural-Holdings/Tables/agricultural-holdings-and-utilised-agricultural-areaby-size-of-the-utilised-agricultural-area.html
This Report Answers
- The report examines how farms choose aerial monitoring and crop treatment aircraft for specific field operations.
- Product analysis compares rotary-wing designs with fixed-wing and hybrid models used for agricultural missions.
- Application analysis separates crop monitoring from aerial application and related field tasks.
- The country outlook examines local farming conditions across the United Kingdom, Brazil, Japan, the United States and Germany.
- Competitive coverage considers aircraft production and agricultural mapping capabilities without assigning company market shares.
What does the Agricultural UAV Market cover?
The market covers aircraft used for farm imaging and field application work, alongside the software and operating services associated with agricultural UAV activity. It includes rotary-wing and fixed-wing models as well as hybrid aircraft where the stated agricultural use is central. The market also considers how farm service companies and individual growers purchase or operate this equipment.
What is included in the scope?
Agricultural UAV sales include aircraft supplied for crop scouting and field mapping. Spraying equipment enters the scope when an unmanned aircraft performs the agricultural application. Sensors and software used to process farm flight data form part of the associated component comparison. Paid flight services are covered as a separate component category. Farm ownership and shared use are considered because both influence the equipment purchased and the work completed during crop seasons.
What is excluded from the scope?
Consumer camera drones used outside agriculture are excluded. Crewed crop-spraying aircraft and ground tractors are also outside the UAV equipment boundary. Standalone satellite data services do not qualify as agricultural UAV activity unless combined with an in-scope UAV product or service. The report separates aircraft revenue from the value of crops grown using aerial observations.
How Was the Analysis Built?
The analysis draws on 120+ sources, 35+ company portfolios, 25+ countries, and more than 20 industry interviews.
- Primary Research: Primary research includes discussions with manufacturers, service providers, technology developers, distributors, end users, and subject-matter experts. These conversations examine purchasing priorities, product adoption, operational challenges, approval requirements, competitive positioning, and the factors that influence wider market acceptance.
- Desk Research: Desk research covers government statistics, regulatory publications, company filings, trade data, technical studies, industry associations, standards, public policy, and other authoritative sources. Every source used in the analysis is documented in the bibliography.
- Market Sizing and Forecasting: Market estimates combine historical performance, demand indicators, pricing and volume trends, segment shares, company participation, country-level growth, adoption patterns, investment activity, and barriers to market expansion.
- Data Validation and Update Cycle: Findings are validated by comparing primary interviews with public data, company activity, regulatory changes, trade patterns, and industry developments. Regular updates review new product launches, capacity changes, partnerships, approvals, and shifts in commercial adoption.
Segmentation
What is the report’s scope and coverage?
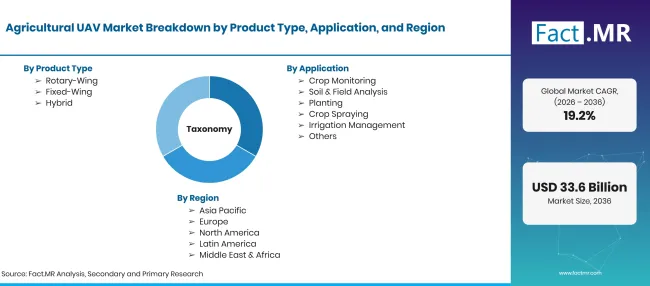
Agricultural Uav Market Taxonomy | Source: Fact.MR
| Attribute | Details |
|---|---|
| Quantitative Units | USD billion in 2026 to USD billion by 2036, at CAGR |
| Market Definition | Unmanned aerial vehicles and associated components and services used for crop observation or agricultural field work. |
| Product Type | Rotary-Wing; Fixed-Wing; Hybrid |
| Application | Crop Monitoring; Soil & Field Analysis; Planting; Crop Spraying; Irrigation Management; Others |
| Component | Hardware; Software; Services |
| End-User | Farmers; Agricultural Cooperatives; Research Institutions; Others |
| Regions Covered | North America; Latin America; Western Europe; Eastern Europe; East Asia; South Asia & Pacific; Middle East & Africa |
| Countries Covered | Germany; Brazil; United States; United Kingdom; Japan |
| Companies Profiled | DJI; Parrot SA; AgEagle Aerial Systems Inc. (dba EagleNXT); Yamaha Motor Co. Ltd.; Trimble Inc.; Delair; Sentera (John Deere) |
| Forecast Period | 2026 to 2036 |
| Approach | Market segmentation and forecast assumptions considered alongside official farm data, civil aviation rules and published company activity. |
Source: Fact.MR analysis. Updated Oct 23, 2026
How is the market segmented?
-
By Product Type
- Rotary-Wing
- Fixed-Wing
- Hybrid
-
By Application
- Crop Monitoring
- Soil & Field Analysis
- Planting
- Crop Spraying
- Irrigation Management
- Others
-
By Component
- Hardware
- Software
- Services
-
By End-User
- Farmers
- Agricultural Cooperatives
- Research Institutions
- Others
-
By Region
- North America
- Latin America
- Western Europe
- Eastern Europe
- East Asia
- South Asia & Pacific
- Middle East & Africa
Frequently Asked Questions
How big is the agricultural UAV market in 2026?
What is the CAGR from 2026 to 2036?
Which product type leads?
Which application leads?
Which companies are the main in the agricultural UAV market?
Who worked on this report


Preview the report firsthand - request a free sample
Free SampleGet the brochure for pricing and purchase details
Download PDF