- Market Value (2025): USD 1.3 Bn
- Estimated Value (2026): USD 1.5 Bn
- Forecast Value (2036): USD 8.8 Bn
- CAGR (2026-2036): 19.4%
What is the AI Drug Repurposing Market forecast to be worth by 2036?
USD 1.5 billion in 2026 to USD 8.8 billion by 2036 at 19.4% CAGR.
- The AI drug repurposing market crossed a valuation of USD 1.3 billion in 2025.
- Demand is projected to increase from USD 1.5 billion in 2026 to USD 8.8 billion by 2036.
- The market is forecast to record 19.4% CAGR from 2026 to 2036 as validation-ready AI workflows move into portfolio planning.
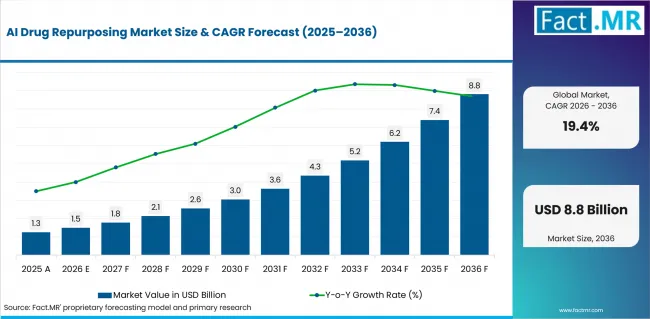
Ai Drug Repurposing Market Value Analysis | Source: Fact.MR
What are the defining numbers behind AI Drug Repurposing Market growth?
USD 7.3 billion absolute opportunity by 2036.
- Demand Drivers in the Market
- Approved and investigational compound libraries give sponsors a starting point before new laboratory work is approved.
- Disease networks help teams compare known drug behavior with unmet clinical needs before they spend on early experiments.
- Portfolio teams use ranked evidence to decide whether a candidate deserves assays, licensing review or regulatory discussion.
- Key Segments Analyzed
- By Drug Type: Small Molecule Drugs are expected to hold 39.0% share in 2026 due to clear structures and reusable dosing histories.
- By Application: Oncology is projected to account for 32.0% share in 2026. Biomarker-led care creates clear indication-matching use cases.
- By End User: Pharmaceutical Companies are anticipated to capture 41.0% share in 2026. They control compounds and development budgets.
- Analyst Opinion at Fact.MR
- Shambhu Nath Jha, Sr. Consultant at Fact.MR, opines: “AI drug repurposing platforms need to show why a known compound fits a new indication before a sponsor commits to assays or licensing. Buyers will focus on traceable evidence, data rights and the handoff from model output to validation.”
- Strategic Implications
- Pharmaceutical teams should connect AI ranking with wet-lab confirmation before licensing decisions accelerate.
- Platform vendors can explain data lineage in plain terms so biology teams understand candidate ranking.
- Investors should review whether licensing terms cover indication ownership and development handoff.
The USA leads with a 20.2% CAGR, supported by enterprise platform purchases. Japan follows at 19.6% through pharmaceutical partnerships, while Germany reaches 19.2% through governed clinical data. The UK, Canada, South Korea and Australia grow through research networks, federated programs and biotechnology validation activities.
How does the AI Drug Repurposing Market break down by segment?
Small Molecule Drugs are expected to lead Drug Type at 39.0% share in 2026. Oncology is projected to lead Application at 32.0% share in 2026.
Why does Small Molecule Drugs lead Drug Type?
Small Molecule Drugs are projected to account for 39.0% share in 2026.
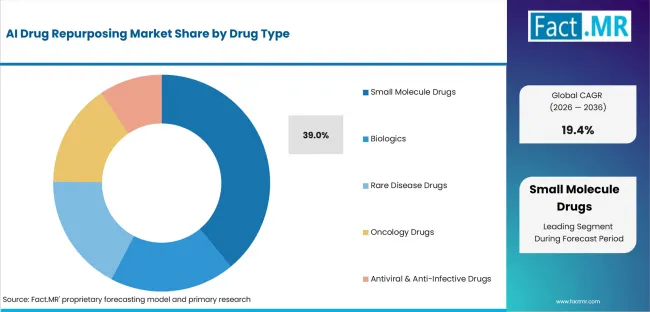
Ai Drug Repurposing Market Analysis By Drug Type | Source: Fact.MR
Small molecules offer the broadest inventory of approved and investigational compounds for repurposing. Their known chemical structures, dosing histories and safety records make them easier to compare across new disease targets.
Why does Oncology lead Application?
Oncology is expected to account for 32.0% share in 2026.
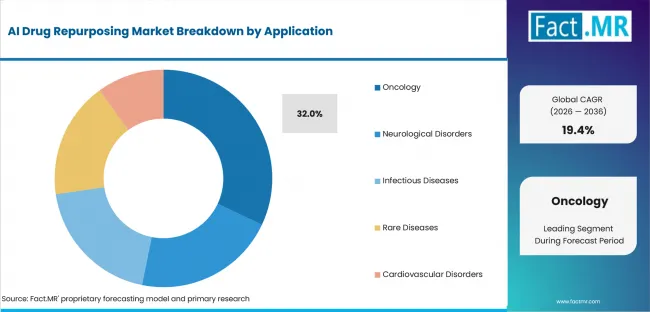
Ai Drug Repurposing Market Analysis By Application | Source: Fact.MR
Oncology provides strong demand because molecular profiling and biomarker-defined patient groups create clear indication-matching opportunities. Solid tumors and hematological malignancies generate large evidence sets that AI platforms can compare with known drug activity.
Why do Pharmaceutical Companies lead End User?
Pharmaceutical Companies are anticipated to account for 41.0% share in 2026.
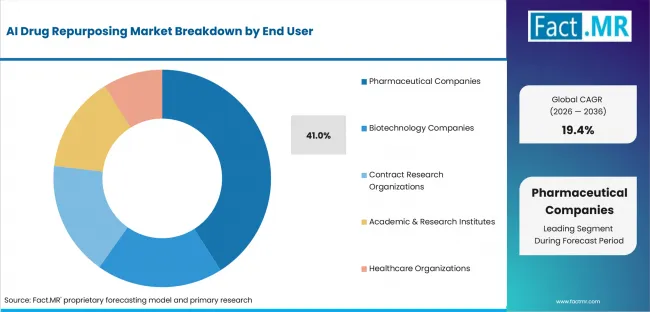
Ai Drug Repurposing Market Analysis By End User | Source: Fact.MR
Pharmaceutical companies control compound libraries, clinical records and development budgets, giving them the strongest ability to move repurposed candidates into assays or trials. Large pharmaceutical companies can connect AI platforms with internal research teams.
What is accelerating AI Drug Repurposing Market adoption, and what is holding it back?
Demand is expected to rise as companies reuse known drugs and improve candidate selection. Growth may be limited by validation needs, data restrictions and regulatory concerns.
Drivers Impact Analysis
| DRIVER | RELATIVE IMPACT | GEOGRAPHIC RELEVANCE | IMPACT TIMELINE |
|---|---|---|---|
| Known-compound reuse | High | USA, Japan, Germany | Short term (<= 2 years) |
| Evidence graph matching | High | USA, UK, Canada | Short term (<= 2 years) |
| Portfolio productivity pressure | Moderate | Large pharmaceutical markets | Medium term (2-4 years) |
| Rare-disease indication search | Moderate | USA, Japan, Australia | Medium term (2-4 years) |
| Assay prioritization | Moderate | Research hospitals and CRO hubs | Long term (>= 4 years) |
Source: Fact.MR analysis. Updated Aug 3, 2026
- Known-compound reuse: Sponsors are expected to value AI programs that make prior toxicology and exposure records easier to reuse.
- Evidence graph matching: Disease maps are expected to help teams compare drug behavior with disease biology before lab work begins.
- Portfolio productivity pressure: R&D leaders are likely to favor tools that filter weak candidates before new experiments are approved.
Opportunity Impact Analysis
| OPPORTUNITY | RELATIVE IMPACT | GEOGRAPHIC RELEVANCE | IMPACT TIMELINE |
|---|---|---|---|
| Privacy-preserving collaboration | Moderate | Germany, South Korea, Japan | Medium term (2-4 years) |
| Multimodal evidence scoring | Moderate | USA and UK | Medium term (2-4 years) |
| Rare-disease partnerships | Moderate | USA, Canada, Australia | Long term (>= 4 years) |
| Licensing workflow integration | Low | Global pharmaceutical buyers | Long term (>= 4 years) |
Source: Fact.MR analysis. Updated Aug 3, 2026
- Privacy-preserving collaboration: Federated data models are expected to help institutions learn from sensitive datasets without raw-data transfer.
- Multimodal evidence scoring: Platforms that combine biology with text and clinical signals are likely to gain more proof during buyer review.
- Rare-disease partnerships: Developers may find stronger openings where small populations make conventional discovery paths less efficient.
Restraints Impact Analysis
| RESTRAINT | RELATIVE IMPACT | GEOGRAPHIC RELEVANCE | IMPACT TIMELINE |
|---|---|---|---|
| Validation and regulatory credibility | High | USA and regulated markets | Short term (<= 2 years) |
| Data-rights restrictions | Moderate | Germany, UK, Japan | Short term (<= 2 years) |
| Prospective evidence cost | Moderate | Biotechnology and CRO buyers | Medium term (2-4 years) |
| Licensing control disputes | Low | Global pharmaceutical buyers | Long term (>= 4 years) |
Source: Fact.MR analysis. Updated Aug 3, 2026
- Validation and regulatory credibility: Predictions must be traceable enough for scientific review before buyers treat them as development evidence.
- Data-rights restrictions: Sensitive clinical records and proprietary compound files limit how quickly teams can pool data for model training.
- Prospective evidence cost: Sponsors still need assays or clinical work before a ranked candidate becomes a development program.
Which countries are scaling AI Drug Repurposing Market fastest?
The USA leads the country comparison, followed closely by Japan and Germany. The UK remains near this group, while Canada, South Korea and Australia follow. With a 2.4-point spread, providers need country-specific evidence aligned with data rules and partnership models.
- The USA leads since large pharmaceutical buyers can connect AI candidate ranking with internal assay teams and regulatory review. Japan remains close to the lead through domestic pharmaceutical partnerships and translational programs that support proof-of-concept work.
- Germany is shaped by governed clinical-data access, privacy review and reproducibility expectations in research consortia. The UK benefits from NHS research settings and university expertise. Specialist AI developers work near pharmaceutical buyers.
- Canada builds demand through university hospitals and AI institutes. Open-science networks support collaborative repurposing work. South Korea follows a partnership-led route where federated discovery programs and hospital collaboration support local model development.
- Australia records a measured position. Research hospitals and biotechnology groups create selective demand for repurposing workflows.
Comparable CAGRs can still produce different adoption paths. Commercial readiness depends on evidence standards, data access and validation handoff.
The full report provides country-level CAGR analysis across the profiled regions.
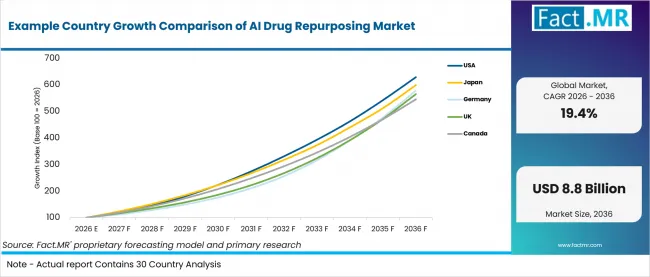
Example Country Growth Comparison Of Ai Drug Repurposing Market | Source: Fact.MR
| Country | CAGR (2026-2036) |
|---|---|
| USA | 20.2% |
| Japan | 19.6% |
| Germany | 19.2% |
| UK | 18.9% |
| Canada | 18.5% |
| South Korea | 18.1% |
| Australia | 17.8% |
Source: Fact.MR analysis. Updated Aug 3, 2026
What supports USA adoption?
20.2% CAGR, supported by enterprise platform purchasing and regulatory review discipline.
The USA reflects a market where pharmaceutical teams use enterprise platform agreements, sponsored research and asset-level licensing. Buyers connect computational work to assay groups before development spend expands.
How is Japan scaling demand?
19.6% CAGR, driven by pharmaceutical partnerships and translational research programs.
Japan’s growth is tied to domestic pharmaceutical partnerships, university collaboration and translational activity. Buyers test platform credibility through controlled research programs before larger development rights are negotiated.
What shapes Germany’s outlook through 2036?
19.2% CAGR, backed by governed clinical-data access and reproducibility review.
Germany’s growth reflects strong attention to privacy-protected data use. Suppliers must show reproducible workflows and controlled access before AI output supports repurposing decisions.
How does the UK develop adoption?
18.9% CAGR, supported by specialist AI developers and NHS research routes.
The UK benefits from pharmaceutical companies and NHS research settings. Universities and specialist AI developers support proof-of-concept work before wider platform use.
What supports Canada’s growth?
18.5% CAGR, led by university hospitals and AI institutes.
Canada often assembles repurposing programs through public research networks and hospital AI expertise. Demand develops where teams connect disease biology with validation partners.
How is South Korea building demand?
18.1% CAGR, shaped by federated discovery programs and hospital collaboration.
South Korea’s route depends on partnerships among pharmaceutical companies, hospitals and research institutes. Federated models appeal where participants need shared learning without centralizing sensitive data.
What supports Australia’s position?
17.8% CAGR, supported by research hospitals and biotechnology-led validation work.
Australia shows selective adoption through research hospitals and biotechnology groups. Buyers compare platform output with available clinical expertise before advancing candidates.
Who leads the AI Drug Repurposing Market?
BenevolentAI, Healx and BioXcel publish work on indication expansion or drug repurposing. Insilico Medicine, Recursion Pharmaceuticals, Schrödinger, Numerion Labs and Valo Health provide AI drug discovery or computational capabilities relevant to candidate evaluation.
The profiled companies differ in their proximity to drug repurposing. BenevolentAI, Healx and BioXcel have public evidence of repurposing or indication-expansion activity. The remaining providers support discovery, molecular design or candidate evaluation and should be assessed for their use in repurposing workflows. The comparison fits Fact.MR's Artificial Intelligence in Drug Discovery Market.
From 2026 to 2036, competition is expected to depend on whether a provider can support the path from indication hypothesis to validation. Buyers will assess the evidence behind candidate ranking and the rights needed to advance a selected asset.
Which companies are the key providers?
Key companies include BenevolentAI; Insilico Medicine; Recursion Pharmaceuticals; Schrödinger; Numerion Labs; Healx; BioXcel Therapeutics; Valo Health.
- BenevolentAI
- Insilico Medicine
- Recursion Pharmaceuticals
- Schrödinger
- Numerion Labs
- Healx
- BioXcel Therapeutics
- Valo Health
Bibliography
- National Center for Advancing Translational Sciences. (2024, February 29). Repurposed drug helps cells clear defective proteins, reveals route to new therapies.
- European Medicines Agency. (2024, September 30). Reflection paper on the use of artificial intelligence in the medicinal product lifecycle.
- U.S. Food and Drug Administration and European Medicines Agency. (2026, January 14). Guiding principles of good AI practice in drug development.
- BenevolentAI. AI-enabled drug repurposing collaboration with DNDi.
- Healx. AI-enabled drug discovery and repurposing research for rare diseases.
- BioXcel. Re-innovation services for indication expansion and drug repurposing.
- Insilico Medicine. Pharma.AI platform for drug discovery and development.
- Recursion. Recursion OS for AI drug discovery and development.
- Schrödinger. Computational platform for molecular discovery and design.
- Numerion Labs. AI chemistry platform for drug discovery.
- Valo Health. AI and real-world-data approach to drug discovery and development.
This Report Answers
- The report provides intelligence on Drug Type and Application choices that shape AI drug repurposing workflows.
- Segment analysis covers Small Molecule Drugs and Oncology as the leading 2026 share positions.
- Country outlook evaluates the USA and Japan alongside Germany and the UK. Canada, South Korea and Australia complete the comparison.
- Competitive analysis profiles the eight listed providers without assigning company share.
- Technology assessment covers Machine Learning and its role in evidence ranking and validation workflows.
What does the AI Drug Repurposing Market cover?
AI-enabled platforms identify and rank new therapeutic indications for known drugs before validation work begins.
The market covers platform access and subscriptions. It includes research services, licensing support and custom analytical work tied to new indication discovery. Downstream finished-drug sales and off-label clinical revenue are excluded. Revenue is counted only when a service helps identify or transfer a new use for a known drug.
What is included in the scope?
The scope includes Drug Type and Application alongside End User, Distribution Channel and Technology.
Coverage spans Small Molecule Drugs and Oncology. Pharmaceutical Companies, Direct Licensing and Machine Learning are included. Strategic licensing and technology transfer revenue are counted when they support repurposing programs.
What is excluded from the scope?
Finished-drug sales and unrelated discovery services remain outside the scope of this market.
The scope excludes standard contract research that is not tied to AI-enabled repurposing. General AI consulting is excluded unless it identifies or validates a new indication for a known drug.
How Was the Analysis Built?
The analysis combines primary interviews with public company materials, regulatory publications, peer-reviewed literature and clinical research records.
- Primary Research: Primary research includes discussions with AI platform developers and pharmaceutical R&D teams. Biotechnology companies, licensing professionals and CROs add buying context. Research hospitals and regulatory specialists clarify validation expectations.
- Desk Research: Desk research covers regulator guidance, public-funding records, peer-reviewed literature, company filings and official releases.
- Market Sizing and Forecasting: Estimates combine platform access and direct licensing activity. Strategic collaborations, contract research and cloud AI services are included when they support repurposing revenue.
- Market Monitoring: The analysis is updated as regulatory guidance, clinical evidence, company activity and partnership developments emerge.
Segmentation
What is the report’s scope and coverage?
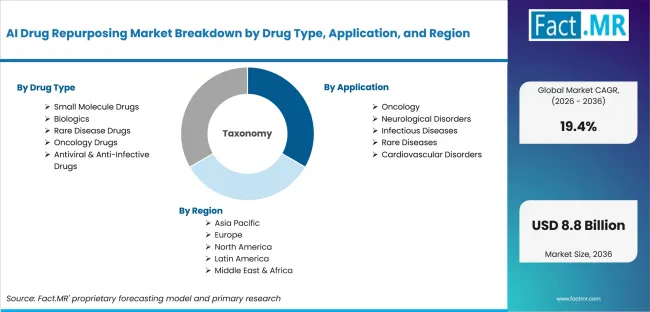
Ai Drug Repurposing Market Breakdown By Drug Type, Application, And Region | Source: Fact.MR
| Attribute | Details |
|---|---|
| Quantitative Units | USD 1.5 billion in 2026 to USD 8.8 billion by 2036 at 19.4% CAGR |
| Market Definition | AI-enabled platforms, research services, subscriptions, licensing workflows and custom analytics used to identify or transfer new therapeutic indications for known drugs. |
| Drug Type | Small Molecule Drugs; Generic Small Molecules; Branded Small Molecules; Biologics; Monoclonal Antibodies; Recombinant Proteins; Rare Disease Drugs; Orphan Drugs; Precision Medicines; Oncology Drugs; Targeted Cancer Therapies; Immuno-Oncology Drugs; Antiviral & Anti-Infective Drugs; Antiviral Drugs; Antibacterial Drugs |
| Application | Oncology; Solid Tumors; Hematological Malignancies; Neurological Disorders; Alzheimer's Disease; Parkinson's Disease; Infectious Diseases; Viral Diseases; Bacterial Diseases; Rare Diseases; Genetic Disorders; Metabolic Disorders; Cardiovascular Disorders; Heart Failure; Coronary Artery Disease |
| End User | Pharmaceutical Companies; Large Pharmaceutical Companies; Specialty Pharmaceutical Companies; Biotechnology Companies; Emerging Biotech Firms; Established Biotech Firms; Contract Research Organizations; Preclinical CROs; Clinical CROs; Academic & Research Institutes; Universities; Public Research Institutes; Healthcare Organizations; Hospitals; Research Hospitals |
| Distribution Channel | Direct Licensing; Strategic Licensing Agreements; Technology Transfer Agreements; Strategic Collaborations; AI Research Partnerships; Drug Discovery Alliances; Contract Research Services; Preclinical Research Services; Clinical Development Services; Cloud-Based AI Platforms; SaaS Platforms; AI-as-a-Service; Direct Sales; Enterprise Sales; Custom AI Solutions |
| Technology | Machine Learning; Supervised Learning; Unsupervised Learning; Deep Learning; Neural Networks; Generative AI Models; Natural Language Processing; Text Mining; Literature Mining; Knowledge Graphs; Biomedical Knowledge Graphs; Graph Analytics; Computer Vision; Cell Imaging Analysis; High-Content Screening |
| Regions Covered | North America; Latin America; Western Europe; Eastern Europe; East Asia; South Asia and Pacific; Middle East & Africa |
| Key Countries Highlighted | USA; Japan; Germany; UK; Canada; South Korea; Australia |
| Key Companies Profiled | BenevolentAI; Insilico Medicine; Recursion Pharmaceuticals; Schrödinger; Numerion Labs; Healx; BioXcel Therapeutics; Valo Health |
| Forecast Period | 2026 to 2036 |
| Approach | Hybrid top-down and bottom-up approach using scoped platform revenue, licensing activity, subscription demand, buyer adoption, segment mix, country evidence and company portfolio review while excluding downstream finished-drug sales. |
Source: Fact.MR analysis. Updated Aug 3, 2026
How is the market segmented?
-
By Drug Type:
- Small Molecule Drugs
- Generic Small Molecules
- Branded Small Molecules
- Biologics
- Monoclonal Antibodies
- Recombinant Proteins
- Rare Disease Drugs
- Orphan Drugs
- Precision Medicines
- Oncology Drugs
- Targeted Cancer Therapies
- Immuno-Oncology Drugs
- Antiviral & Anti-Infective Drugs
- Antiviral Drugs
- Antibacterial Drugs
- Small Molecule Drugs
-
By Application:
- Oncology
- Solid Tumors
- Hematological Malignancies
- Neurological Disorders
- Alzheimer's Disease
- Parkinson's Disease
- Infectious Diseases
- Viral Diseases
- Bacterial Diseases
- Rare Diseases
- Genetic Disorders
- Metabolic Disorders
- Cardiovascular Disorders
- Heart Failure
- Coronary Artery Disease
- Oncology
-
By End User:
- Pharmaceutical Companies
- Large Pharmaceutical Companies
- Specialty Pharmaceutical Companies
- Biotechnology Companies
- Emerging Biotech Firms
- Established Biotech Firms
- Contract Research Organizations
- Preclinical CROs
- Clinical CROs
- Academic & Research Institutes
- Universities
- Public Research Institutes
- Healthcare Organizations
- Hospitals
- Research Hospitals
- Pharmaceutical Companies
-
By Distribution Channel:
- Direct Licensing
- Strategic Licensing Agreements
- Technology Transfer Agreements
- Strategic Collaborations
- AI Research Partnerships
- Drug Discovery Alliances
- Contract Research Services
- Preclinical Research Services
- Clinical Development Services
- Cloud-Based AI Platforms
- SaaS Platforms
- AI-as-a-Service
- Direct Sales
- Enterprise Sales
- Custom AI Solutions
- Direct Licensing
-
By Technology:
- Machine Learning
- Supervised Learning
- Unsupervised Learning
- Deep Learning
- Neural Networks
- Generative AI Models
- Natural Language Processing
- Text Mining
- Literature Mining
- Knowledge Graphs
- Biomedical Knowledge Graphs
- Graph Analytics
- Computer Vision
- Cell Imaging Analysis
- High-Content Screening
- Machine Learning
-
By Region:
- North America
- Latin America
- Western Europe
- Eastern Europe
- East Asia
- South Asia and Pacific
- Middle East & Africa
Frequently Asked Questions
Which Drug Type leads the market?
Which Application leads the market?
Which End User leads the market?
Which country records the highest listed CAGR?
What is the primary driver in this market?
Who worked on this report


Preview the report firsthand - request a free sample
Free SampleGet the brochure for pricing and purchase details
Download PDF