- Market Value (2025): USD 1.19 Bn
- Estimated Value (2026): USD 1.24 Bn
- Forecast Value (2036): USD 1.86 Bn
- CAGR (2026-2036): 4.1%
What is the Benzenecarboxylic Acid Market forecast to be worth by 2036?
USD 1.24 billion in 2026 to USD 1.86 billion by 2036 at a 4.1% CAGR.
- As per Fact.MR analysis, the benzenecarboxylic acid market reached USD 1.19 billion in 2025.
- Demand will increase from USD 1.24 billion in 2026 to USD 1.86 billion by 2036.
- The benzenecarboxylic acid market will record 4.1% CAGR from 2026 to 2036.
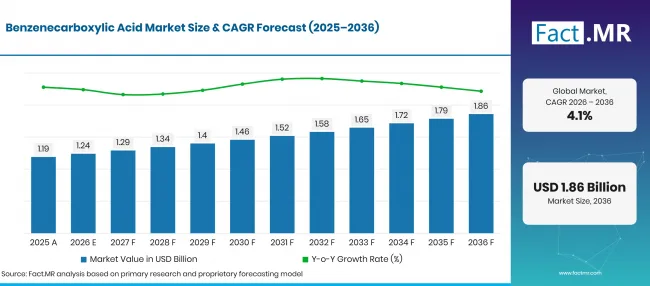
Factmr Benzenecarboxylic Acid Market Forecast Global | Source: Fact.MR
| Year | Basis | Market value (USD billion) |
|---|---|---|
| 2025 | Actual | 1.19 |
| 2026 | Estimate | 1.24 |
| 2036 | Forecast | 1.86 |
| CAGR, 2026 to 2036 | 4.1% | |
What are the defining numbers behind Benzenecarboxylic Acid Market growth?
An absolute opportunity of USD 0.7 billion will be created between 2026 and 2036.
- Demand Drivers in the Market
- Personal care brands keep adding products that need a preservative in their water phase. The U.S. Food and Drug Administration counted 1,298,361 active cosmetic products listed under the Modernization of Cosmetics Regulation Act as of June 30, 2026 [1]. Each new shampoo, lotion or cleanser adds a small, recurring call on benzoates.
- Acidic foods and drinks need low-cost protection against yeast and mold during storage. Sauce makers, pickle packers and bottlers will keep sodium benzoate in their formulas because it works well below pH 4.5 at low dose rates.
- Pharmaceutical output is expanding, which lifts demand for excipient-grade benzoic acid and sodium benzoate in oral liquids and topical products. Eurostat reported that EU exports of medicinal and pharmaceutical products rose 16%, or EUR 50 billion, in 2025 from 2024, lifting the trade surplus to a record EUR 221 billion [2].
- Chemical makers use benzoyl chloride to produce peroxide initiators, dyes and agrochemical intermediates. This keeps a share of benzoic acid output tied to industrial cycles outside consumer goods.
- Key Segments Analyzed
- By Derivative Type: Sodium Benzoate will hold 42.3% share in 2026 since its high water solubility suits drinks, syrups and rinse-off personal care products.
- By Application: Cosmetics will account for 27.3% share in 2026, supported by creams, lotions and hair products that need protection against microbial growth.
- By End-User Industry: Personal Care will capture 75.7% share in 2026 owing to the steady flow of new skin care, hair care and toiletry launches.
- Analyst Opinion at Fact.MR
- Shambhu Nath Jha, Principal Consultant at Fact.MR, states, “Benzoates have a long safety record in foods, cosmetics and medicines. That record will keep them on approved preservative lists while newer molecules face fresh scrutiny. Personal care formulators will remain the main buyers, and the quickest gains will come from export-led cosmetics hubs in South Korea and processed food lines in Brazil. Producers that cut the carbon footprint of toluene-based output will gain an edge with brand owners that report Scope 3 emissions.”
- Strategic Implications
- Producers should publish impurity profiles and batch data for food, cosmetic and pharmacopoeia grades, given that buyers now qualify suppliers on documentation as much as on price.
- Personal care formulators should pair sodium benzoate with pH control and co-preservatives so that clean-label claims do not weaken shelf-life performance.
- Beverage and sauce makers should secure dual sourcing of sodium benzoate and potassium benzoate to limit exposure to toluene price swings and plant outages.
- Benzoyl chloride suppliers should match capacity to peroxide initiator and agrochemical demand, since these buyers order in large lots on short notice.
South Korea will lead at 5.2% CAGR, helped by export-led cosmetics manufacturing and a large food processing base. Brazil will follow at 4.9% as food processing output keeps rising. U.S. demand will reach 4.5% on the back of packaged food spending and a fast-growing list of registered cosmetic products. France will post 4.0% through its beauty export industry. Japan will record 3.6% with steady pharmaceutical production, while the United Kingdom will close at 3.1% as household soft drink purchases decline.
How does the Benzenecarboxylic Acid Market break down by segment?
Sodium Benzoate will lead Derivative Type at 42.3%; Cosmetics will lead Application at 27.3%; Personal Care will lead End-User Industry at 75.7%.
Which Derivative Type dominates?
Sodium Benzoate will hold 42.3% share in 2026.
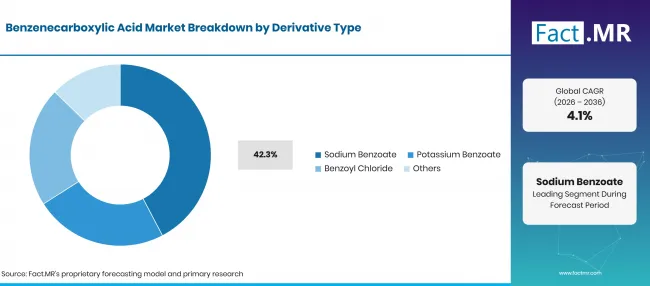
Factmr Benzenecarboxylic Acid Market Breakdown Derivative Type | Source: Fact.MR
Benzenecarboxylic Acid Market Breakdown by Derivative Type
| Derivative Type | Share (2026) |
|---|---|
| Sodium Benzoate (Leading Segment) | 42.3% |
| Other Segments Combined | 57.7% |
| Total | 100.0% |
Sodium benzoate will lead because it dissolves far more readily in water than benzoic acid itself. Formulators can dose it as a powder or solution into drinks, syrups and rinse-off products. Wide approval under food additive code E 211 and in cosmetic preservative lists also lowers the cost of entering new markets.
Low-calorie drinks are a steady outlet for sodium benzoate, since sweeteners replace the sugar that once limited microbial growth. In the United Kingdom, household purchases of low-calorie soft drinks rose to 406 ml per person per week in FYE 2024, from 103 ml in 1993 [3]. Potassium benzoate serves low-sodium recipes, while benzoyl chloride goes into chemical synthesis.
What leads the Application segment?
Cosmetics will account for 27.3% share in 2026.
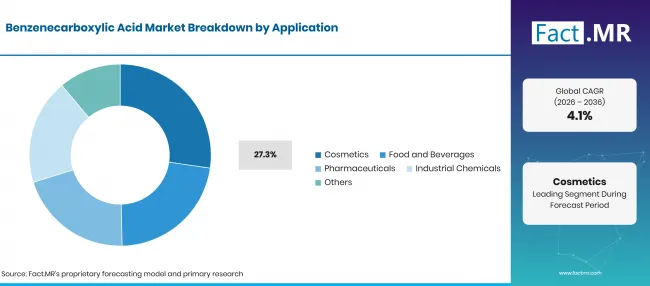
Factmr Benzenecarboxylic Acid Market Breakdown Application | Source: Fact.MR
Benzenecarboxylic Acid Market Breakdown by Application
| Application | Share (2026) |
|---|---|
| Cosmetics (Leading Segment) | 27.3% |
| Other Segments Combined | 72.7% |
| Total | 100.0% |
Cosmetics will lead since creams, lotions and cleansers contain water phases that support bacteria and mold. Benzoic acid and sodium benzoate fit the acidic pH of many rinse-off and leave-on products. Brand owners also use them to replace parabens and formaldehyde releasers within the wider cosmetic chemicals mix.
Regulators keep pruning the list of allowed cosmetic ingredients, which favors preservatives with long safety records. The European Commission adopted Regulation (EU) 2025/877 in May 2025 to ban further carcinogenic, mutagenic or reprotoxic substances from cosmetics [4]. The ban has applied since September 1, 2025 [4]. Food and beverages, pharmaceuticals and industrial chemicals make up the rest of the application mix.
What supports Personal Care within End-User Industry?
Personal Care will capture 75.7% share in 2026.
Personal care will lead as skin care, hair care and toiletry makers buy benzoates in steady volumes for every production run. Contract manufacturers in East Asia and Western Europe place regular orders tied to brand launch calendars. Many brands use benzoates alongside potassium sorbate to widen protection against yeast and mold.
The chemical industry takes benzoic acid as a feedstock for benzoyl chloride, plasticizers and resin modifiers. Eurostat reported that EU chemical production reached 224 million tonnes in 2024 [5]. Chemical demand moves with construction, coatings and plastics cycles.
What is accelerating Benzenecarboxylic Acid Market adoption, and what is holding it back?
Demand will rise through personal care launches, steady packaged food output and pharmaceutical excipient needs. Growth is constrained by clean-label pressure on synthetic preservatives and by toluene price swings.
Drivers Impact Analysis
| DRIVER | (~) % IMPACT ON CAGR | GEOGRAPHIC RELEVANCE | IMPACT TIMELINE |
|---|---|---|---|
| Steady preservative demand from personal care launches | +1.2% | Global | Short term (<= 2 years) |
| Packaged food and beverage output in acidic product lines | +1.0% | North America, Latin America, East Asia | Short term (<= 2 years) |
| Excipient-grade demand from pharmaceutical production | +0.8% | Western Europe, East Asia | Medium term (2-4 years) |
| Benzoyl chloride demand for initiators and agrochemicals | +0.6% | East Asia, South Asia & Pacific | Medium term (2-4 years) |
Opportunity Impact Analysis
| OPPORTUNITY | (~) % IMPACT ON CAGR | GEOGRAPHIC RELEVANCE | IMPACT TIMELINE |
|---|---|---|---|
| Low-carbon and mass balance certified benzoates | +0.6% | Western Europe, North America | Medium term (2-4 years) |
| Paraben-free preservative systems for cosmetics | +0.5% | Global | Medium term (2-4 years) |
| Potassium benzoate in low-sodium foods and drinks | +0.4% | North America, Western Europe | Long term (>= 4 years) |
Restraints Impact Analysis
| RESTRAINT | (~) % IMPACT ON CAGR | GEOGRAPHIC RELEVANCE | IMPACT TIMELINE |
|---|---|---|---|
| Clean-label pressure on synthetic preservatives | -0.7% | Western Europe, North America | Medium term (2-4 years) |
| Volatility in toluene feedstock costs | -0.5% | Global | Short term (<= 2 years) |
| Substitution by sorbates and natural extracts | -0.4% | Global | Long term (>= 4 years) |
Which countries are scaling the Benzenecarboxylic Acid Market through 2036?
- The country comparison spans 2.1 percentage points between South Korea at 5.2% and the United Kingdom at 3.1%.
- Only 0.3 percentage point separates South Korea from Brazil, with cosmetics contract manufacturing for export giving Korea the edge.
- Brazil will keep a 0.4-point lead over the United States, helped by rising output of processed foods and beverages.
- Large packaged food spending will give the United States a 0.5-point edge over France, as registered cosmetic product counts keep growing.
- In France, a deep beauty export base leaves the country 0.4 points clear of Japan.
- Steady pharmaceutical production will hold Japan 0.5 points ahead of the United Kingdom.
- The United Kingdom will close the range, where household soft drink purchases are falling.
Comparable CAGRs create different entry conditions, since cosmetics export strength, food processing scale and drink consumption habits vary by country. Full report coverage includes North America, Latin America, Western Europe, Eastern Europe, East Asia, South Asia & Pacific, Middle East & Africa.
As per Fact.MR, global benzenecarboxylic acid consumption is estimated at USD 0.149 per capita in 2026, compared with USD 0.145 per capita in 2025. It will grow to USD 0.209 per capita by 2036 as personal care brands, food processors and drug makers keep benzoates in their preservative systems. Demand will rise across cosmetics contract manufacturers, beverage bottlers, sauce makers and pharmaceutical plants in both mature and emerging economies. As per Fact.MR, the growth of benzenecarboxylic acid will come less from new food uses in mature markets and more from personal care launches, export-led cosmetics production and higher-purity grades for medicines.
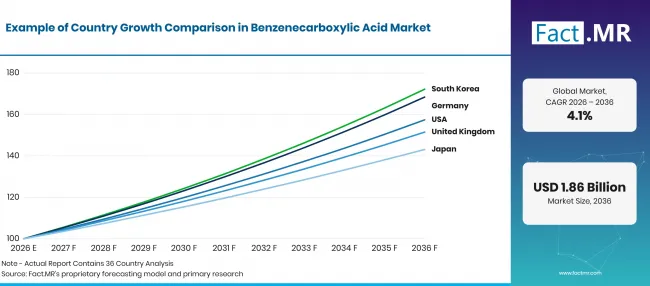
Factmr Benzenecarboxylic Acid Market Growth Index | Source: Fact.MR
| Country | CAGR (2026-2036) |
|---|---|
| South Korea | 5.2% |
| Brazil | 4.9% |
| United States | 4.5% |
| France | 4.0% |
| Japan | 3.6% |
| United Kingdom | 3.1% |
What supports South Korea adoption?
5.2% CAGR, supported by export-led cosmetics manufacturing and food processing.
Korean contract manufacturers produce skin care and hair care lines for brands across Asia, North America and Europe. Each new export order adds preservative demand at the formulation stage. The U.S. Department of Agriculture reported that Korea’s food processing industry generated over KRW 85 trillion in sales in 2023 [6]. Sauces, kimchi products and ready-to-drink beverages in this base also rely on benzoates.
How is Brazil scaling demand?
4.9% CAGR, driven by rising food processing output.
Brazil’s food and beverage plants supply a large domestic market and export processed goods across Latin America. IBGE reported that industrial production grew 0.6% in 2025, with food products up 1.5% [7]. Juice concentrates, sauces and soft drinks use sodium benzoate, while the country’s beauty industry adds personal care demand.
What supports United States growth?
4.5% CAGR, supported by packaged food spending and cosmetic product registrations.
U.S. consumers spend heavily on packaged and prepared foods that use benzoates in acidic lines. The Economic Research Service reported that food-at-home spending reached USD 1.10 trillion in 2025 [8]. The FDA also recorded 16,398 active cosmetic product facilities registered as of June 30, 2026 [1].
How is France developing demand?
4.0% CAGR, driven by its beauty export industry.
French perfume and cosmetics makers formulate for export markets worldwide. The Direction générale du Trésor reported that the beauty sector generated a EUR 17.3 billion trade surplus in 2024, second only to aerospace [9]. Most French perfumes and cosmetics shipped to the United States have faced 15% customs duties since August 1, 2025 [9].
What is supporting Japan’s adoption?
3.6% CAGR, supported by steady pharmaceutical production.
Japanese drug makers use pharmacopoeia-grade benzoic acid and sodium benzoate in syrups, oral liquids and topical products. The Ministry of Health, Labour and Welfare reported that domestic production of finished pharmaceuticals reached JPY 10.25 trillion in 2024, up 2.1% from 2023 [10]. Strict specification control favors suppliers with long quality records.
How does the United Kingdom perform?
3.1% CAGR, shaped by falling household soft drink purchases.
British households are buying fewer soft drinks, which limits preservative volumes in the beverage channel. Total soft drink purchases fell 6.9% to 1,448 ml per person per week in FYE 2025 [3]. HM Revenue & Customs reported provisional Soft Drinks Industry Levy receipts of GBP 327 million for 2024 to 2025 [11]. The levy keeps bottlers focused on low-sugar recipes, which still need preservatives.
Who leads the Benzenecarboxylic Acid Market?
Competition runs across three groups. Large producers such as LANXESS and toluene oxidation specialist Wuhan Youji Holdings compete on purity and scale, along with the cost of toluene feedstock. LANXESS said in September 2025 that benzoic acid and sodium benzoate from its Botlek site in the Netherlands are now made entirely with low-emission electricity [12].
Wuhan Youji also turns toluene into benzyl alcohol and benzonitrile, which spreads plant costs across several products. Regional producers such as Ganesh Benzoplast supply sodium benzoate and benzoic acid as food preservatives in India. A third group adds value downstream. Eastman uses sodium benzoate in its Protural feed additive. It raised North and Latin American prices for plasticizers including Eastman 354 from April 1, 2025 [13]. Merck KGaA supplies Emprove pharmacopoeia-grade benzoic acid for drug production. Competition will be decided by documented purity, lower carbon footprints and reliable supply to personal care brands.
Which companies are the key providers?
Key companies include LANXESS AG (including Emerald Kalama Chemical); Wuhan Youji Holdings Ltd.; Ganesh Benzoplast Ltd.; Eastman Chemical Company; and Merck KGaA.
- LANXESS AG (including Emerald Kalama Chemical)
- Wuhan Youji Holdings Ltd.
- Ganesh Benzoplast Ltd.
- Eastman Chemical Company
- Merck KGaA
Bibliography
- [1] [1] U.S. Food and Drug Administration. (2026, September 9). Registration & Listing of Cosmetic Product Facilities and Products.
- [2] Eurostat. (2026, March). International trade in medicinal and pharmaceutical products.
- [3] Department for Environment, Food & Rural Affairs. (2026, September 18). Family Food FYE 2025.
- [4] European Commission. (2025, May 12). Commission Regulation (EU) 2025/877 amending Regulation (EC) No 1223/2009 regarding the use in cosmetic products of certain substances classified as carcinogenic, mutagenic or toxic for reproduction.
- [5] Eurostat. (2025, December). Chemicals production and consumption statistics.
- [6] U.S. Department of Agriculture, Foreign Agricultural Service. (2025). South Korea: Food Processing Ingredients Annual.
- [7] Instituto Brasileiro de Geografia e Estatística. (2026, May 22). Indicadores Econômicos do Brasil 2025, 2ª Edição [Economic Indicators of Brazil 2025, 2nd Edition].
- [8] U.S. Department of Agriculture, Economic Research Service. (2026, June 1). Ag and Food Statistics: Charting the Essentials, Food Prices and Spending.
- [9] Direction générale du Trésor. (2025, October 17). Flash conjoncture France: Les exportations cosmétiques françaises face aux droits de douanes américains [French cosmetics exports facing U.S. customs duties].
- [10] Ministry of Health, Labour and Welfare. (2025, December 24). [Overview of the 2024 Annual Report on Pharmaceutical Industry Production Statistics].
- [11] HM Revenue & Customs. (2026, January 30). Soft Drinks Industry Levy statistics commentary 2026.
- [12] LANXESS. (2025, September 17). LANXESS reduces CO₂ footprint for products at Botlek site.
- [13] Eastman Chemical Company. (2025, March 11). Eastman increases Plasticizers prices on April 1st, 2025
This Report Answers
- The report explains how benzoic acid and its derivatives are sold by derivative type, application and end-user industry.
- Segment analysis identifies the subsegment that leads each segment and the formulation factors behind its 2026 share.
- Country analysis compares the six listed countries through cosmetics exports, food processing and pharmaceutical production.
- Competitive analysis reviews toluene oxidation producers, regional suppliers and downstream users of benzoates.
- Regulatory analysis assesses how food additive and cosmetic ingredient rules shape preservative choice.
What does the Benzenecarboxylic Acid Market cover?
The Benzenecarboxylic Acid Market covers benzoic acid and the derivatives made from it, namely sodium benzoate, potassium benzoate and benzoyl chloride. Food, cosmetic, pharmacopoeia and technical grades are included.
The assessment tracks use in cosmetics, food and beverages, pharmaceuticals and industrial chemicals. Demand is measured across personal care and chemical end users.
What is included in the scope?
The scope includes merchant sales of benzoic acid flakes and the salts made from it, sold as powder, granules or solution.
It covers sodium benzoate dosed into drinks and sauces, which also appears within the wider food additives range.
Benzoyl chloride sold to makers of peroxide initiators, dyes and agrochemical intermediates is counted. Excipient-grade benzoic acid and sodium benzoate sold to drug manufacturers are also included.
What is excluded from the scope?
The scope excludes finished foods, drinks, cosmetics and medicines sold as end products. Toluene and other upstream feedstocks traded as standalone commodities fall outside the revenue boundary.
Benzoate esters such as benzyl benzoate and dibenzoate plasticizers are excluded. Sorbates, parabens and natural extracts sold as competing preservatives are also excluded.
How Was the Analysis Built?
The analysis draws on 120+ sources, 35+ company portfolios, 25+ countries, and more than 20 industry interviews.
- Primary Research: Primary research includes discussions with manufacturers, service providers, technology developers, distributors, end users, and subject-matter experts. These conversations examine purchasing priorities, product adoption, operational challenges, approval requirements, competitive positioning, and the factors that influence wider market acceptance.
- Desk Research: Desk research covers government statistics, regulatory publications, company filings, trade data, technical studies, industry associations, standards, public policy, and other authoritative sources. Every source used in the analysis is documented in the bibliography.
- Market Sizing and Forecasting: Market estimates combine historical performance, demand indicators, pricing and volume trends, segment shares, company participation, country-level growth, adoption patterns, investment activity, and barriers to market expansion.
- Data Validation and Update Cycle: Findings are validated by comparing primary interviews with public data, company activity, regulatory changes, trade patterns, and industry developments. Regular updates review new product launches, capacity changes, partnerships, approvals, and shifts in commercial adoption.
What is the report’s scope and coverage?
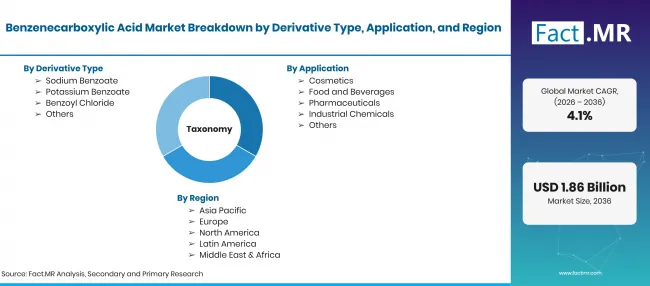
Factmr Benzenecarboxylic Acid Market Taxonomy | Source: Fact.MR
| Attribute | Details |
|---|---|
| Quantitative Units | USD billion in 2026 to USD billion by 2036 at a CAGR |
| Market Definition | Benzoic acid (benzenecarboxylic acid) and its derivatives sodium benzoate, potassium benzoate and benzoyl chloride, sold as preservatives, excipients and chemical intermediates. The scope covers material used in cosmetics, food and beverages, pharmaceuticals and industrial chemicals. |
| Derivative Type | Sodium Benzoate; Potassium Benzoate; Benzoyl Chloride |
| Application | Cosmetics; Food and Beverages; Pharmaceuticals; Industrial Chemicals |
| End-User Industry | Personal Care; Chemical |
| Regions Covered | North America; Latin America; Western Europe; Eastern Europe; East Asia; South Asia & Pacific; Middle East & Africa |
| Countries Covered | South Korea; Brazil; United States; France; Japan; United Kingdom |
| Key Companies Profiled | LANXESS AG (including Emerald Kalama Chemical); Wuhan Youji Holdings Ltd.; Ganesh Benzoplast Ltd.; Eastman Chemical Company; Merck KGaA |
| Forecast Period | 2026 to 2036 |
| Approach | Hybrid top-down and bottom-up approach using toluene oxidation capacity; derivative mix; preservative dose rates in cosmetics, foods and medicines; country growth; and producer portfolio review. |
How is the market segmented?
-
By Derivative Type
- Sodium Benzoate
- Potassium Benzoate
- Benzoyl Chloride
-
By Application
- Cosmetics
- Food and Beverages
- Pharmaceuticals
- Industrial Chemicals
-
By End-User Industry
- Personal Care
- Chemical
-
By Region
- North America
- Latin America
- Western Europe
- Eastern Europe
- East Asia
- South Asia & Pacific
- Middle East & Africa

