Benzoic Acid Market Size, Share, Growth and Forecast (2026 - 2036)

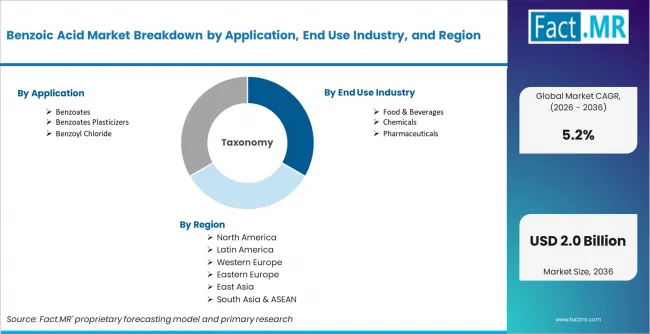
The Benzoic Acid Market is segmented by Application (Benzoates, Benzoates Plasticizers, Benzoyl Chloride, Alkyd Resins, Animal Feed Additives), End Use Industry (Food & Beverages, Chemicals, Pharmaceuticals, Cosmetics and Personal Care, Other End Use Industry), Grade (Food Grade, Technical Grade, Pharma Grade), Form (Powder & Crystals, Granules, Flakes, Liquid Solution), Sales Channel (Direct Sales, Distributors, Online Chemical Platforms), and Region. Forecast for 2026 to 2036.

Fact.MR states that benzoic acid demand is supported by food preservation and chemical intermediate use. Food processors and resin producers need grades that meet purity rules and supply consistency requirements.

Benzoic Acid Market Size, Market Forecast and Outlook by Fact.MR

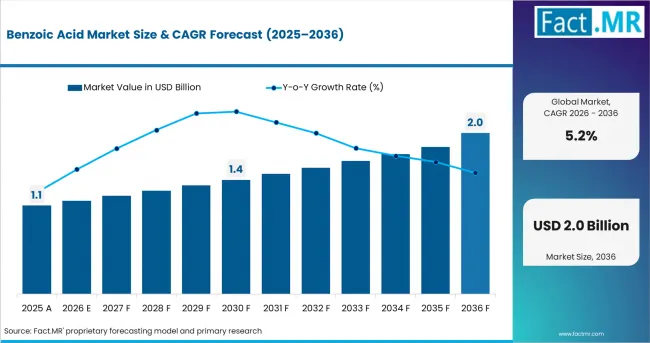
  • The benzoic acid market was valued at USD 1.1 billion in 2025.
  • Demand is estimated to reach USD 1.2 billion in 2026.
  • The market is projected to record 5.2% CAGR from 2026 to 2036.
  • Preservative use and resin intermediate demand are forecast to lift the market to USD 2.0 billion by 2036.
  • Recognized preservative status and conversion into benzoate salts support benzoic acid use.
  • FDA lists benzoic acid as a food substance used under good manufacturing practice controls.
  • Sodium benzoate is produced by neutralizing benzoic acid with sodium bicarbonate or sodium hydroxide.
  • Benzoates stay linked to acidic food and beverage systems.
Benzoic Acid Market Value Analysis

Summary of benzoic acid market

  • Demand Drivers in the Market
    •  Food Preservation: Food processors need approved antimicrobial inputs that help protect acidic packaged products. Benzoic acid and benzoate routes support beverages and sauces because they work well at lower pH levels. Suppliers with consistent quality and regulatory documentation can help manufacturers protect shelf life during storage across packaged drink lines and acidified food formats.
    •  Chemical Intermediate Use: Resin producers use benzoic acid in alkyd systems and related specialty chemistry. Coating manufacturers need stable input quality because formulation changes affect viscosity and final product performance. Producers that offer steady purity and reliable supply can support resin plants seeking predictable reaction behavior and reduced adjustment needs.
    •  High Purity Formulation: Pharmaceutical and personal care formulators need benzoic acid with clear purity documentation. Material consistency is important because excipient and preservative use depends on traceable quality records. Suppliers with suitable certificates and application support can serve regulated formulators that need dependable inputs for topical products and selected pharmaceutical preparations.
  • Key Segments Analyzed
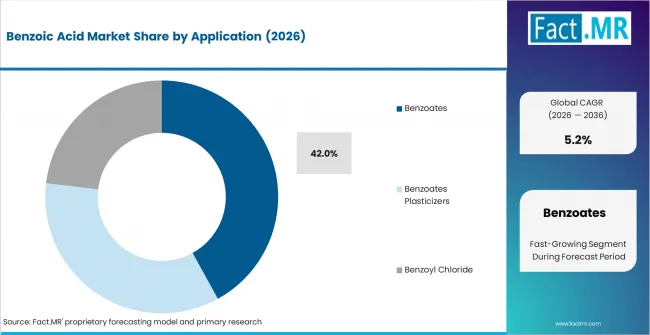
    • By Application: Benzoates are projected to account for 42.0% share in 2026 because food and beverage processors need reliable preservative systems for acidic products.
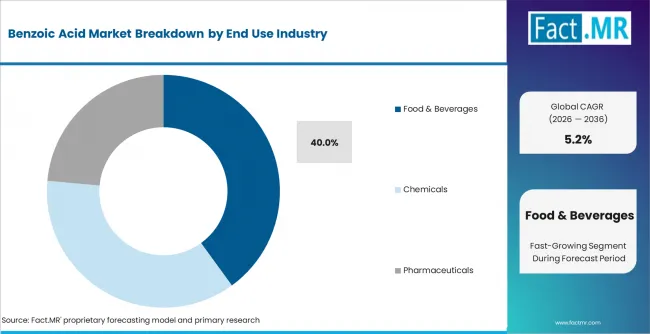
    • By End Use Industry: Food & Beverages lead because packaged product manufacturers use benzoic acid routes for shelf-life protection.
    • By Grade: Food Grade is forecast to represent 45.0% share in 2026 as food processors need documented additive purity.
    • By Form: Powder & Crystals lead because dry handling suits batch dosing and bulk storage in food and chemical plants.
    • By Sales Channel: Direct Sales are expected to account for 60.0% share in 2026 because large processors need supply contracts and specification control.
    • By Geography: India is projected to grow at 7.2% CAGR from 2026 to 2036 as packaged food output and domestic chemical supply support demand.
  • Analyst Opinion at Fact.MR
    • Shambhu Nath Jha, Senior Analyst at Fact.MR, notes, “Benzoic acid demand should be read through grade control and application reliability. Food processors need preservative performance with clear compliance records. Chemical producers need steady intermediate supply. Suppliers that combine purity proof with dependable delivery can protect repeat orders.”
  • Strategic Implications
    •  Grade Documentation: Benzoic acid suppliers must provide clear certificates and impurity records because food and pharmaceutical users need proof before approval. Clear documentation helps manufacturers verify grade fit and compliance before production trials.
    •  Supply Reliability: Chemical processors should secure repeat supply for technical grade benzoic acid because feedstock movement can affect cost planning. Stable availability helps resin and coating producers avoid production changes caused by material gaps.
    •  Form Selection: Formulators should match powder and flake formats to plant handling needs. Liquid options should be reviewed separately. Poor form choice can raise transfer loss and mixing issues during production.
Metric Details
Industry Size (2026) USD 1.2 billion
Industry Value (2036) USD 2.0 billion
CAGR (2026 to 2036) 5.2%

India benzoic acid demand is forecast to reach 7.2% CAGR from 2026 to 2036 as packaged food processing and domestic chemical output expand. China may register 6.8% CAGR because local production supports preservative and intermediate use. United States demand is anticipated to record 5.4% CAGR as FDA-recognized preservative use supports packaged food applications. Brazil follows at 5.1% CAGR through processed food and beverage demand. Germany is projected to grow at 4.6% CAGR by 2036 because coating and resin applications sustain use. United Kingdom demand is likely to rise at 4.5% CAGR as approved additive frameworks guide food formulation. Japan records 4.3% CAGR through 2036 as high-purity grades support regulated food and personal care use.

Segmental Analysis

Benzoic Acid Market Analysis by Application
Benzoic Acid Market Analysis By Application

Benzoates form the main application base because acidic packaged foods need antimicrobial protection. The segment is projected to account for 42.0% share in 2026 as sodium benzoate and other benzoate salts rely on benzoic acid conversion. FDA states that sodium benzoate is produced by neutralizing benzoic acid. [2] Benzoyl chloride supports specialty synthesis. Alkyd resins use benzoic acid in coating chemistry. Benzoate plasticizers support industrial applications tied to polymer and resin demand. Animal feed additive use is selective because approval and dose control affect adoption. Benzoates lead because food processors can connect preservative performance with known additive rules.

  • Benzoate Conversion: Benzoates support acidic food preservation. Food processors value this route because compliance and performance are well understood.
  • Resin Pull: Alkyd resin use supports industrial demand. Coating producers need repeat intermediate quality for stable formulations.
  • Specialty Synthesis: Benzoyl chloride applications support chemical conversion needs. Specialty manufacturers focus on impurity control and supplier documentation.

Benzoic Acid Market Analysis by End Use Industry
Benzoic Acid Market Analysis By End Use Industry

Food and beverages lead end use demand because preservative use supports shelf life control in packaged acidic products. Beverage and processed food manufacturers need approved antimicrobial ingredients for repeat formulation use. The segment accounts for 40.0% share over the assessment period because acidic food systems need reliable preservation. Codex states that additive use levels are set to keep intake within accepted limits. [3] Chemicals follow through resin and intermediate applications. Pharmaceuticals use high purity material for selected formulation and synthesis needs. Mass beauty and personal care use is tied to preservative performance and odor control.

  • Food Stability: Food processors use benzoic acid routes to control spoilage risk. Packaged product shelf-life supports repeat purchases.
  • Chemical Input: Chemical manufacturers use benzoic acid in resin and derivative production. Supply reliability affects production planning.
  • Personal Care: Personal care formulators need low-odor material. Purity documentation can decide supplier approval.

Benzoic Acid Market Analysis by Grade
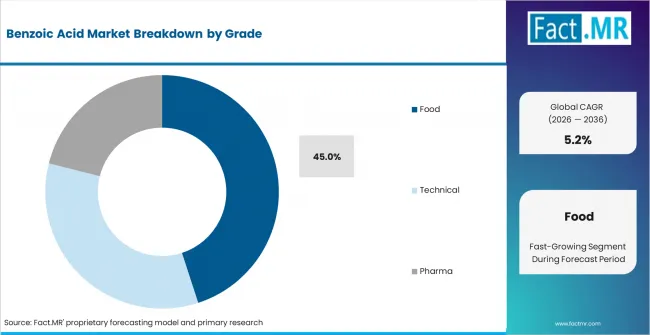
Benzoic Acid Market Analysis By Grade

Regulated applications push demand toward grades with clear purity support. Food processors need additive grade material with documented specifications before use in packaged products. FSSAI lists benzoic acid under food additive specifications and sets purity requirements for regulated use. [4] Food Grade represents 45.0% share in 2026 because preservative use requires material that can pass internal quality checks. Technical Grade serves coatings and industrial intermediates. Pharmaceutical Grade supports formulation and synthesis routes that need strict quality records.

  • Food Compliance: Food Grade supports additive use in approved products. Food processors need reliable certificates for formulation approval.
  • Technical Volume: Technical Grade supports coatings and chemical intermediates. Resin producers need predictable input quality.
  • Pharma Control: Pharma Grade serves stricter applications. Quality teams review impurity records before supplier selection.

Benzoic Acid Market Analysis by Form
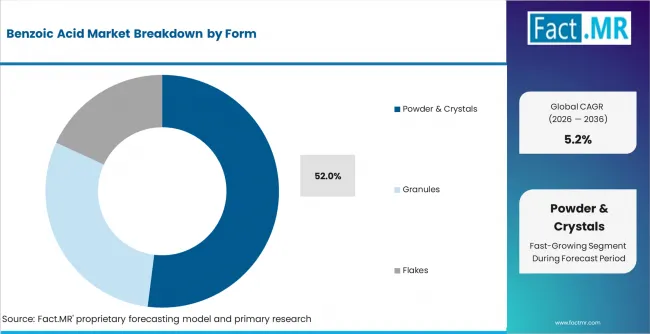
Benzoic Acid Market Analysis By Form

Powder and crystals hold 52.0% share over the study period because dry storage and batch dosing suit food ingredient and chemical plants. Plant handling needs decide form preference. Granules reduce dusting concerns in selected facilities. Flakes support clean handling for high purity applications. Liquid solutions suit rapid mixing in personal care and specialty industrial formulations. Powder and crystals lead because they support bulk handling with limited need for specialized liquid storage systems.

  • Dry Dosing: Powder and crystals suit batch production. Plant teams can handle them with standard storage systems.
  • Cleaner Transfer: Granules and flakes reduce handling difficulty. This supports plants with dust-control needs.
  • Liquid Mixing: Liquid solutions help faster blending. Formulators use them when transfer speed affects line efficiency.

Benzoic Acid Market Analysis by Sales Channel
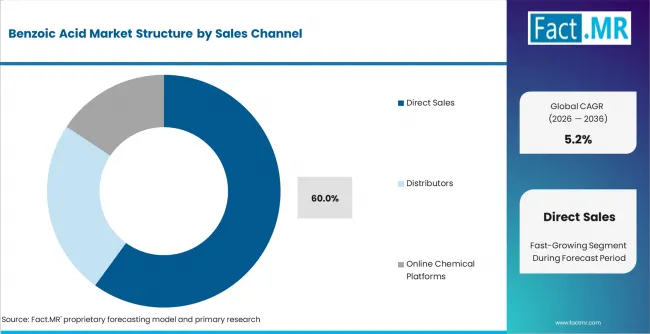
Benzoic Acid Market Analysis By Sales Channel

Volume users rely on direct supply because quality records and delivery schedules affect plant continuity. Food processors and chemical manufacturers need contracts tied to specifications. Supplier approval often requires batch records and reliable delivery history. Direct Sales account for 60.0% share in 2026 because regulated and continuous production users need supplier assurance. Distributors serve regional processors that need flexible order sizes and local inventory. Online chemical platforms support samples and limited volume orders.

  • Contract Supply: Direct Sales support larger plants. Supply agreements help processors manage quality and delivery risk.
  • Distributor Reach: Distributors serve regional users. Local inventory can reduce delay for smaller order sizes.
  • Digital Access: Online chemical platforms support samples and trial batches. Technical teams use them before full supplier approval.

Benzoic Acid Market Drivers, Restraints, and Opportunities
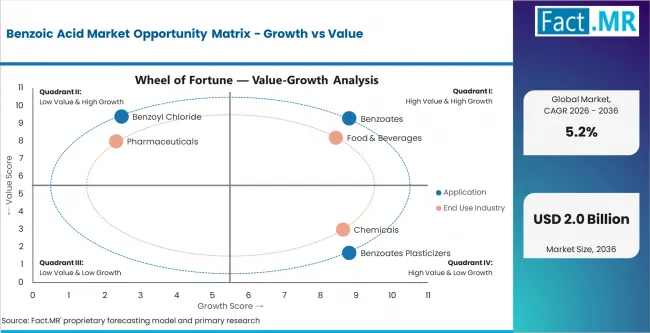
Benzoic Acid Market Opportunity Matrix Growth Vs Value

Preservative demand is the main driver for benzoic acid. Food processors need antimicrobial ingredients that work in acidic systems and meet additive rules. FDA permits benzoic acid under good manufacturing practice conditions. FSSAI’s food additive specifications support regulated use in India.

Feedstock exposure is the main restraint. Benzoic acid production can be linked to petrochemical routes and coproduct recovery. IG Petrochemicals says benzoic acid forms during phthalic anhydride production and is extracted through a dedicated BA recovery system at its Taloja campus. Supply and cost control are important for technical grade users.

Opportunities in the Benzoic Acid Market

  • High Purity Grades: Food and pharmaceutical users need strict documentation before approving benzoic acid suppliers. Clear test records help verify purity and impurity limits with batch consistency. Suppliers that provide complete certificates can improve approval outcomes because regulated formulators need proof that material quality matches preservative use. High purity formulation requirements add another demand base across sensitive product lines.
  • Regional Supply: Local supply can reduce delivery delays for benzoic acid users that need steady inputs. Indian and Chinese producers can serve food and chemical manufacturers with reduced lead times. Closer sourcing helps plants manage inventory gaps and respond quickly when seasonal demand or feedstock movement affects import schedules.
  • Liquid Formulations: Liquid benzoic acid formats can support rapid mixing for formulators that need stronger process control. Personal care and specialty product manufacturers may use liquid routes to improve dosing accuracy and reduce handling issues. Suppliers with stable concentration records can support plants that need repeatable performance during small batch or continuous production.

Regional Analysis

Top Country Growth Comparison Benzoic Acid Market Cagr (2026 2036)

Based on regional analysis, the benzoic acid market is segmented into North America, Latin America, Western Europe, Eastern Europe, East Asia, South Asia and Pacific, and Middle East and Africa.

Country CAGR (2026 to 2036)
India 7.2%
China 6.8%
United States 5.4%
Brazil 5.1%
Germany 4.6%
United Kingdom 4.5%
Japan 4.3%

Source: Fact.MR adjusted forecast model based on revised 2026 to 2036 assumptions.
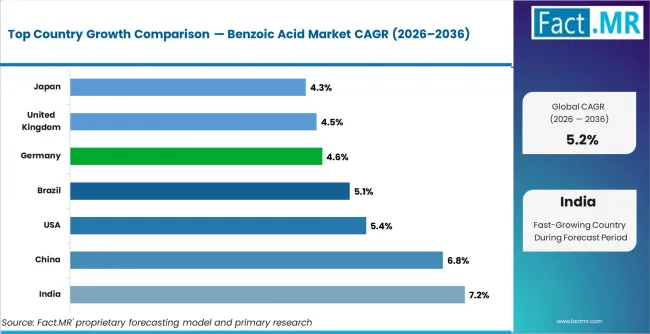
Benzoic Acid Market Cagr Analysis By Country

South Asia and Pacific Benzoic Acid Market Analysis

South Asia and Pacific demand reflects packaged food growth and local chemical output. India leads the region because food additive rules and domestic chemical production support preservative demand. Local suppliers can compete through food grade and technical grade availability.

  • India: Packaged food processing and domestic chemical production support 7.2% CAGR from 2026 to 2036 for benzoic acid demand in India. Food processors need additive grade material for acidic formulations and shelf life control. Chemical producers use technical grade material for resin and derivative applications. Local supply can reduce lead time for regional processors. India’s growth is tied to regulated food use and steady industrial consumption..

East Asia Benzoic Acid Market Analysis
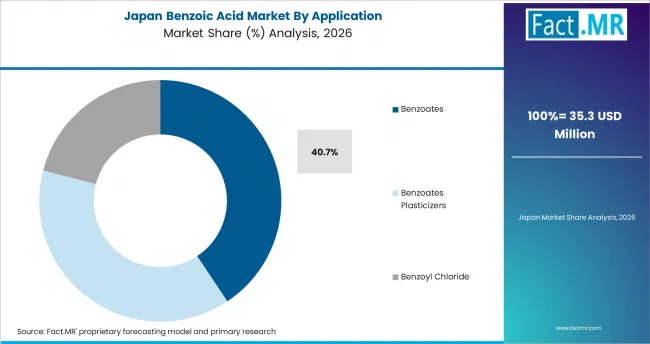
Benzoic Acid Market Japan Market Share Analysis By Application

East Asia demand reflects chemical manufacturing depth and food processing scale. China supports volume through domestic production and intermediate use. Japan supports high purity demand through regulated food and personal care formulations.

  • China: China’s benzoic acid demand benefits from local chemical production and preservative consumption. Domestic suppliers serve food processors and resin manufacturers through established chemical distribution channels. Local supply supporting preservative and intermediate use drives 6.8% CAGR by 2036. Industrial users need steady feedstock access for benzoyl chloride and resin chemistry. Food manufacturers need preservative inputs that can match product safety requirements. China leads in volume supply and downstream chemical integration.
  • Japan: Japan’s benzoic acid demand reflects high purity food and personal care use. Formulators need documentation that supports internal quality review and regulated product development. Premium applications often require cleaner grades and improved odor control. Personal care and food producers prioritizing documented quality support 4.3% CAGR through 2036. Supplier approval can take longer because material consistency affects product claims and safety records. Japan grows through controlled demand from quality focused applications with bulk chemical consumption playing a limited role.

North America Benzoic Acid Market Analysis
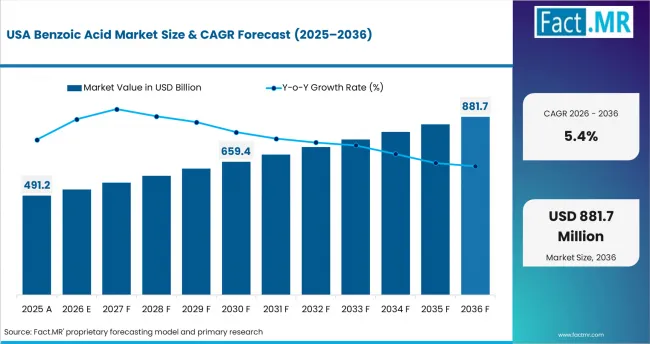
Benzoic Acid Market Country Value Analysis

North America demand is supported by food additive acceptance and pharmaceutical formulation use. The United States leads regional value because packaged food manufacturers and chemical formulators need consistent preservative inputs. FDA rules provide a clear reference point for benzoic acid and sodium benzoate use.

• United States: United States demand reflects packaged food use and chemical formulation needs. Approved preservative routes for acidic packaged food applications support 5.4% CAGR from 2026 to 2036. Sodium benzoate production keeps benzoic acid linked to preservative supply. Chemical manufacturers use technical grades for intermediate production. Supplier success depends on documentation quality and stable delivery for regulated production environments.

Latin America Benzoic Acid Market Analysis

Latin America demand is linked to packaged food production and import supply. Brazil leads regional use because beverage and processed food manufacturers need preservatives that protect shelf stability across warm distribution conditions.

• Brazil: Brazil records 5.1% CAGR over the forecast period as beverage and processed food producers use preservative systems to support shelf life needs. Warm distribution conditions make microbial control important for acidic packaged products. Food manufacturers need reliable benzoic acid and benzoate supply for sauces and drinks. Preserved foods add another use area. Chemical distributors support regional processors through flexible local inventory. Technical grade demand is tied to resin and industrial formulation use. Growth in Brazil depends on steady import access and supplier ability to support food grade documentation.

Western Europe Benzoic Acid Market Analysis
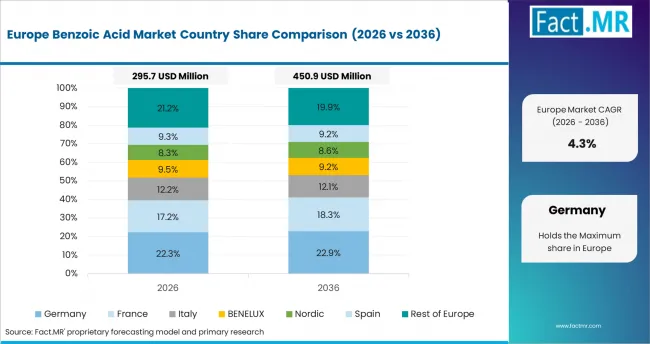
Benzoic Acid Market Europe Country Market Share Analysis, 2026 & 2036

Western Europe demand is established and compliance guided. Germany supports demand through coatings and specialty chemical use. The United Kingdom gains preservative demand through approved additive frameworks and packaged food production.

  • Germany: Resin and coating applications support 4.6% CAGR by 2036 for benzoic acid demand in Germany. Regulated chemical use adds another demand base. Chemical manufacturers need dependable technical grade supply for alkyd resin and derivative routes. Food processors use preservative ingredients within European additive controls. High purity demand is supported by specialty formulation needs. Germany has an established use base. Growth depends on consistency, documentation and industrial formulation demand with rapid volume expansion playing a limited role.
  • United Kingdom: Food Standards Agency guidance lists approved additives and E numbers for food businesses. Regulatory clarity supports 4.5% CAGR over the forecast period for the United Kingdom through approved preservative use. Food processors need clear additive references before formulation decisions. Benzoic acid demand is tied to acidic packaged foods and beverage preservation. Chemical users support small technical grade demand through resin and specialty applications. Importers and distributors are important because local demand often needs reliable stock with scaled production playing a limited role. United Kingdom growth is compliance guided and tied to steady packaged food output.

Competitive Aligners for Market Players
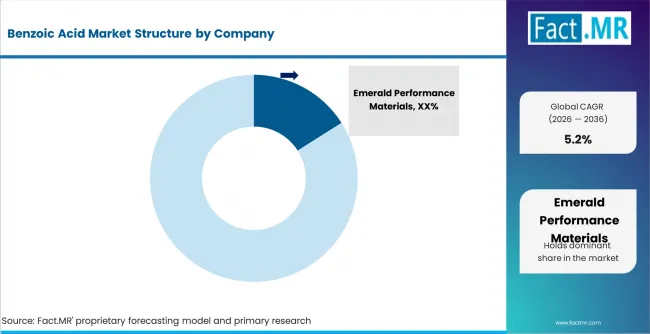
Benzoic Acid Market Analysis By Company

The benzoic acid market includes integrated producers and specialty ingredient suppliers, with distributors supporting regional access. Technical benzoic acid supports alkyd synthesis and thermoplastic elastomer use. Supplier competition depends on application suitability and grade consistency, with commodity volume playing a secondary role.

Competitive advantage comes from purity control and repeat supply. High purity benzoic acid supports food and pharmaceutical applications because qualification records affect repeat approval. Liquid formats serve personal care and specialty industrial use when formulators need simpler handling. Regional producers compete through cost control and delivery access. Integrated recovery from adjacent chemical manufacturing can improve supply availability for chemical users that need repeat volumes.

Key Players in Benzoic Acid Market

  • Emerald Performance Materials
  • Wuhan Youji Industries Co.
  • Tianjin Dongda Chemical Group
  • IG Petrochemicals Ltd.
  • Aarsha Chemicals Private Limited
  • Reliance Industries Limited
  • Navyug Pharmachem
  • LANXESS AG
  • Merck KGaA

Bibliography

  • [1]. U.S. Food and Drug Administration. (2026). 21 CFR 184.1021, Benzoic acid. Electronic Code of Federal Regulations.
  • [2]. U.S. Food and Drug Administration. (2026). 21 CFR 184.1733, Sodium benzoate. Electronic Code of Federal Regulations.
  • [3]. Codex Alimentarius Commission. (2025). General Standard for Food Additives CXS 192-1995. Food and Agriculture Organization of the United Nations.
  • [4]. Food Safety and Standards Authority of India. (2024, November 4). Chapter 3, Substances added to food. Food Safety and Standards Authority of India.

This Report Addresses

  • Strategic intelligence on benzoic acid demand across food preservation and chemical intermediate use.
  • Adjusted 2026 to 2036 forecast based on the Fact.MR public baseline.
  • Segment analysis by application, end use industry, grade, form, and sales channel.
  • Regional outlook across India, China, United States, Brazil, Germany, United Kingdom, and Japan.
  • Competitive analysis of LANXESS AG, IG Petrochemicals Ltd., Wuhan Youji Industries Co., and Tianjin Dongda Chemical Group.
  • Product assessment covering food-grade, technical-grade, pharma-grade, powder, crystals, flakes, and liquid solutions.
  • Source-backed review of food additive rules and high-purity supplier positioning.
  • Primary interviews, supplier checks, and downstream application review support validation.

Benzoic Acid Market Definition

The benzoic acid market covers commercial benzoic acid used as a preservative, resin intermediate and specialty chemical input. The market differs from sodium benzoate because it covers the acid molecule before conversion into salts or downstream derivatives.

Benzoic Acid Market Inclusions

The scope includes benzoic acid used in benzoates, benzyl chloride, animal feed mixer, personal care, and industrial formulations. Food-grade, and pharma-grade forms are included. Powder, and liquid solutions are counted.

Benzoic Acid Market Exclusions

The scope excludes sodium benzoate sold as a separate finished preservative salt. Finished foods, beverages and medicines are outside scope because they represent downstream products. Benzaldehyde and fragrance derivatives are excluded unless benzoic acid is sold as the direct input.

Benzoic Acid Market Research Methodology

  • Primary Research
    • Primary research includes interviews with food additive formulators and chemical distributors. Resin plant managers and personal care formulation heads are covered separately. Supplier feedback supports grade-level and application-level demand checks.
  • Desk Research
    • Desk research reviews food additive rules, chemical registration records, supplier product sheets, and safety documentation. Application data is compared with preservative use and intermediate demand.
  • Market-Sizing and Forecasting
    • Forecasting uses application demand, grade mix,and sales channel checks. Benzoates and food-grade demand are linked to preservative use and regulatory approval.
  • Data Validation and Update Cycle
    • Forecasts are validated through supplier checks and downstream manufacturer interviews. Regional assumptions are reviewed with food additive rules and chemical supply indicators.

Scope of the Report

Benzoic Acid Market Breakdown By Application, End Use Industry, And Region

Market Definition Benzoic acid used as a preservative, antimicrobial ingredient, chemical intermediate, and formulation input.
Application Benzoates, Benzoates Plasticizers, Benzoyl Chloride, Alkyd Resins, Animal Feed Additives
End Use Industry Food & Beverages, Chemicals, Pharmaceuticals, Cosmetics and Personal Care, Other End Use Industry
Grade Food Grade, Technical Grade, Pharma Grade
Form Powder & Crystals, Granules, Flakes, Liquid Solution
Sales Channel Direct Sales, Distributors, Online Chemical Platforms
Regions Covered North America, Latin America, Western Europe, Eastern Europe, East Asia, South Asia and Pacific, Middle East and Africa
Countries Covered India, China, United States, Brazil, Germany, United Kingdom, Japan
Key Companies Profiled Emerald Performance Materials, Wuhan Youji Industries Co., Tianjin Dongda Chemical Group, IG Petrochemicals Ltd., LANXESS AG, Merck KGaA
Forecast Period 2026 to 2036
Approach Adjusted top-down and bottom-up model using application demand, end-use checks, grade mix, form preference, channel structure, and regional validation.

Benzoic Acid Market Analysis by Segments

By Application:

  • Benzoates
  • Benzoates Plasticizers
  • Benzoyl Chloride
  • Alkyd Resins
  • Animal Feed Additives

By End Use Industry:

  • Food & Beverages
  • Chemicals
  • Pharmaceuticals
  • Cosmetics and Personal Care
  • Other End Use Industry

By Grade:

  • Food Grade
  • Technical Grade
  • Pharma Grade

By Form:

  • Powder & Crystals
  • Granules
  • Flakes
  • Liquid Solution

By Sales Channel:

  • Direct Sales
  • Distributors
  • Online Chemical Platforms

Region:

  • North America
    • United States
    • Canada
  • Europe
    • Germany
    • United Kingdom
    • France
    • Italy
    • Spain
  • Asia Pacific
    • China
    • Japan
    • South Korea
    • Taiwan
    • Singapore
  • Latin America
    • Brazil
    • Mexico
    • Argentina
  • Middle East & Africa
    • GCC Countries
    • South Africa
    • Israel

- Frequently Asked Questions -

How large is the benzoic acid market in 2025?

The benzoic acid market was valued at USD 1.1 billion in 2025 based on Fact.MR’s public baseline and adjusted assumptions.

What is the expected value of the benzoic acid market in 2026?

The benzoic acid market is estimated to reach USD 1.2 billion in 2026 through preservative and chemical intermediate demand.

What is the forecast value of the benzoic acid market by 2036?

The benzoic acid market is forecast to reach USD 2.0 billion by 2036 as food and chemical uses expand.

What CAGR is projected for the benzoic acid market from 2026 to 2036?

Fact.MR’s adjusted forecast projects 5.2% CAGR for the benzoic acid market from 2026 to 2036.

Which application leads the benzoic acid market?

Benzoates lead the benzoic acid market with 42.0% share in 2026 due to preservative use in acidic foods.

Why do benzoates lead benzoic acid demand?

Benzoates lead because food and beverage processors need approved antimicrobial systems that support shelf-life control.

Which end use industry leads the benzoic acid market?

Food & Beverages lead the benzoic acid market with 40.0% share in 2026 due to packaged product preservation needs.

Which grade leads the benzoic acid market?

Food Grade leads with 45.0% share in 2026 because food processors need additive-grade purity and documentation.

Which form leads the benzoic acid market?

Powder & Crystals lead with 52.0% share in 2026 because dry handling suits batch dosing and bulk storage.

Which sales channel leads the benzoic acid market?

Direct Sales lead with 60.0% share in 2026 because large processors need contract supply and specification control.

Which country is growing fastest in the benzoic acid market?

India is forecast to grow fastest at 7.2% CAGR from 2026 to 2036.

Why is India growing fastest in the benzoic acid market?

India grows fastest because packaged food processing and domestic chemical production support preservative and technical-grade demand.

Why is China important in the benzoic acid market?

China is important because domestic chemical manufacturing supports benzoic acid supply for preservative and resin applications.

Why is the United States important in the benzoic acid market?

The United States is important because FDA-recognized preservative use supports steady demand from packaged food manufacturers.

Which companies compete in the benzoic acid market?

LANXESS AG, IG Petrochemicals Ltd., Wuhan Youji Industries Co., Tianjin Dongda Chemical Group, and Merck KGaA compete in this market.

What drives benzoic acid market growth?

Food preservative use drives growth because processors need approved antimicrobial ingredients for acidic packaged products.

What restrains benzoic acid market growth?

Feedstock exposure restrains growth because petrochemical routes and coproduct recovery can affect cost and supply planning.

How does benzoic acid support food preservation?

Benzoic acid supports food preservation by helping control microbial growth in acidic products through approved preservative systems.

How does benzoic acid support chemical production?

Benzoic acid supports chemical production through use in alkyd resins, benzoyl chloride, plasticizers, and specialty intermediates.

What is included in the benzoic acid market scope?

The scope includes food-grade, technical-grade, and pharma-grade benzoic acid across preservative and industrial applications.

What is excluded from the benzoic acid market scope?

The scope excludes finished foods, beverages, cosmetics, medicines, sodium benzoate sold separately, and downstream derivatives.

How does Fact.MR forecast benzoic acid demand?

Fact.MR forecasts demand using application demand, end-use checks, grade mix, form preference, sales route checks, and regional validation.

Table of Content

  1. Executive Summary
    • Global Market Outlook
    • Demand to side Trends
    • Supply to side Trends
    • Technology Roadmap Analysis
    • Analysis and Recommendations
  2. Market Overview
    • Market Coverage / Taxonomy
    • Market Definition / Scope / Limitations
  3. Research Methodology
    • Chapter Orientation
    • Analytical Lens and Working Hypotheses
      • Market Structure, Signals, and Trend Drivers
      • Benchmarking and Cross-market Comparability
      • Market Sizing, Forecasting, and Opportunity Mapping
    • Research Design and Evidence Framework
      • Desk Research Programme (Secondary Evidence)
        • Company Annual and Sustainability Reports
        • Peer-reviewed Journals and Academic Literature
        • Corporate Websites, Product Literature, and Technical Notes
        • Earnings Decks and Investor Briefings
        • Statutory Filings and Regulatory Disclosures
        • Technical White Papers and Standards Notes
        • Trade Journals, Industry Magazines, and Analyst Briefs
        • Conference Proceedings, Webinars, and Seminar Materials
        • Government Statistics Portals and Public Data Releases
        • Press Releases and Reputable Media Coverage
        • Specialist Newsletters and Curated Briefings
        • Sector Databases and Reference Repositories
        • Fact.MR Internal Proprietary Databases and Historical Market Datasets
        • Subscription Datasets and Paid Sources
        • Social Channels, Communities, and Digital Listening Inputs
        • Additional Desk Sources
      • Expert Input and Fieldwork (Primary Evidence)
        • Primary Modes
          • Qualitative Interviews and Expert Elicitation
          • Quantitative Surveys and Structured Data Capture
          • Blended Approach
        • Why Primary Evidence is Used
        • Field Techniques
          • Interviews
          • Surveys
          • Focus Groups
          • Observational and In-context Research
          • Social and Community Interactions
        • Stakeholder Universe Engaged
          • C-suite Leaders
          • Board Members
          • Presidents and Vice Presidents
          • R&D and Innovation Heads
          • Technical Specialists
          • Domain Subject-matter Experts
          • Scientists
          • Physicians and Other Healthcare Professionals
        • Governance, Ethics, and Data Stewardship
          • Research Ethics
          • Data Integrity and Handling
      • Tooling, Models, and Reference Databases
    • Data Engineering and Model Build
      • Data Acquisition and Ingestion
      • Cleaning, Normalisation, and Verification
      • Synthesis, Triangulation, and Analysis
    • Quality Assurance and Audit Trail
  4. Market Background
    • Market Dynamics
      • Drivers
      • Restraints
      • Opportunity
      • Trends
    • Scenario Forecast
      • Demand in Optimistic Scenario
      • Demand in Likely Scenario
      • Demand in Conservative Scenario
    • Opportunity Map Analysis
    • Product Life Cycle Analysis
    • Supply Chain Analysis
    • Investment Feasibility Matrix
    • Value Chain Analysis
    • PESTLE and Porter’s Analysis
    • Regulatory Landscape
    • Regional Parent Market Outlook
    • Production and Consumption Statistics
    • Import and Export Statistics
  5. Global Market Analysis 2021 to 2025 and Forecast, 2026 to 2036
    • Historical Market Size Value (USD Million) Analysis, 2021 to 2025
    • Current and Future Market Size Value (USD Million) Projections, 2026 to 2036
      • Y to o to Y Growth Trend Analysis
      • Absolute $ Opportunity Analysis
  6. Global Market Pricing Analysis 2021 to 2025 and Forecast 2026 to 2036
  7. Global Market Analysis 2021 to 2025 and Forecast 2026 to 2036, By Application
    • Introduction / Key Findings
    • Historical Market Size Value (USD Million) Analysis By Application , 2021 to 2025
    • Current and Future Market Size Value (USD Million) Analysis and Forecast By Application , 2026 to 2036
      • Benzoates
      • Benzoates Plasticizers
      • Benzoyl Chloride
    • Y to o to Y Growth Trend Analysis By Application , 2021 to 2025
    • Absolute $ Opportunity Analysis By Application , 2026 to 2036
  8. Global Market Analysis 2021 to 2025 and Forecast 2026 to 2036, By End Use Industry
    • Introduction / Key Findings
    • Historical Market Size Value (USD Million) Analysis By End Use Industry, 2021 to 2025
    • Current and Future Market Size Value (USD Million) Analysis and Forecast By End Use Industry, 2026 to 2036
      • Food & Beverages
      • Chemicals
      • Pharmaceuticals
    • Y to o to Y Growth Trend Analysis By End Use Industry, 2021 to 2025
    • Absolute $ Opportunity Analysis By End Use Industry, 2026 to 2036
  9. Global Market Analysis 2021 to 2025 and Forecast 2026 to 2036, By Grade
    • Introduction / Key Findings
    • Historical Market Size Value (USD Million) Analysis By Grade, 2021 to 2025
    • Current and Future Market Size Value (USD Million) Analysis and Forecast By Grade, 2026 to 2036
      • Food
      • Technical
      • Pharma
    • Y to o to Y Growth Trend Analysis By Grade, 2021 to 2025
    • Absolute $ Opportunity Analysis By Grade, 2026 to 2036
  10. Global Market Analysis 2021 to 2025 and Forecast 2026 to 2036, By Form
    • Introduction / Key Findings
    • Historical Market Size Value (USD Million) Analysis By Form, 2021 to 2025
    • Current and Future Market Size Value (USD Million) Analysis and Forecast By Form, 2026 to 2036
      • Powder & Crystals
      • Granules
      • Flakes
    • Y to o to Y Growth Trend Analysis By Form, 2021 to 2025
    • Absolute $ Opportunity Analysis By Form, 2026 to 2036
  11. Global Market Analysis 2021 to 2025 and Forecast 2026 to 2036, By Sales Channel
    • Introduction / Key Findings
    • Historical Market Size Value (USD Million) Analysis By Sales Channel, 2021 to 2025
    • Current and Future Market Size Value (USD Million) Analysis and Forecast By Sales Channel, 2026 to 2036
      • Direct Sales
      • Distributors
      • Online Chemical Platforms
    • Y to o to Y Growth Trend Analysis By Sales Channel, 2021 to 2025
    • Absolute $ Opportunity Analysis By Sales Channel, 2026 to 2036
  12. Global Market Analysis 2021 to 2025 and Forecast 2026 to 2036, By Region
    • Introduction
    • Historical Market Size Value (USD Million) Analysis By Region, 2021 to 2025
    • Current Market Size Value (USD Million) Analysis and Forecast By Region, 2026 to 2036
      • North America
      • Latin America
      • Western Europe
      • Eastern Europe
      • East Asia
      • South Asia and Pacific
      • Middle East & Africa
    • Market Attractiveness Analysis By Region
  13. North America Market Analysis 2021 to 2025 and Forecast 2026 to 2036, By Country
    • Historical Market Size Value (USD Million) Trend Analysis By Market Taxonomy, 2021 to 2025
    • Market Size Value (USD Million) Forecast By Market Taxonomy, 2026 to 2036
      • By Country
        • USA
        • Canada
        • Mexico
      • By Application
      • By End Use Industry
      • By Grade
      • By Form
      • By Sales Channel
    • Market Attractiveness Analysis
      • By Country
      • By Application
      • By End Use Industry
      • By Grade
      • By Form
      • By Sales Channel
    • Key Takeaways
  14. Latin America Market Analysis 2021 to 2025 and Forecast 2026 to 2036, By Country
    • Historical Market Size Value (USD Million) Trend Analysis By Market Taxonomy, 2021 to 2025
    • Market Size Value (USD Million) Forecast By Market Taxonomy, 2026 to 2036
      • By Country
        • Brazil
        • Chile
        • Rest of Latin America
      • By Application
      • By End Use Industry
      • By Grade
      • By Form
      • By Sales Channel
    • Market Attractiveness Analysis
      • By Country
      • By Application
      • By End Use Industry
      • By Grade
      • By Form
      • By Sales Channel
    • Key Takeaways
  15. Western Europe Market Analysis 2021 to 2025 and Forecast 2026 to 2036, By Country
    • Historical Market Size Value (USD Million) Trend Analysis By Market Taxonomy, 2021 to 2025
    • Market Size Value (USD Million) Forecast By Market Taxonomy, 2026 to 2036
      • By Country
        • Germany
        • UK
        • Italy
        • Spain
        • France
        • Nordic
        • BENELUX
        • Rest of Western Europe
      • By Application
      • By End Use Industry
      • By Grade
      • By Form
      • By Sales Channel
    • Market Attractiveness Analysis
      • By Country
      • By Application
      • By End Use Industry
      • By Grade
      • By Form
      • By Sales Channel
    • Key Takeaways
  16. Eastern Europe Market Analysis 2021 to 2025 and Forecast 2026 to 2036, By Country
    • Historical Market Size Value (USD Million) Trend Analysis By Market Taxonomy, 2021 to 2025
    • Market Size Value (USD Million) Forecast By Market Taxonomy, 2026 to 2036
      • By Country
        • Russia
        • Poland
        • Hungary
        • Balkan & Baltic
        • Rest of Eastern Europe
      • By Application
      • By End Use Industry
      • By Grade
      • By Form
      • By Sales Channel
    • Market Attractiveness Analysis
      • By Country
      • By Application
      • By End Use Industry
      • By Grade
      • By Form
      • By Sales Channel
    • Key Takeaways
  17. East Asia Market Analysis 2021 to 2025 and Forecast 2026 to 2036, By Country
    • Historical Market Size Value (USD Million) Trend Analysis By Market Taxonomy, 2021 to 2025
    • Market Size Value (USD Million) Forecast By Market Taxonomy, 2026 to 2036
      • By Country
        • China
        • Japan
        • South Korea
      • By Application
      • By End Use Industry
      • By Grade
      • By Form
      • By Sales Channel
    • Market Attractiveness Analysis
      • By Country
      • By Application
      • By End Use Industry
      • By Grade
      • By Form
      • By Sales Channel
    • Key Takeaways
  18. South Asia and Pacific Market Analysis 2021 to 2025 and Forecast 2026 to 2036, By Country
    • Historical Market Size Value (USD Million) Trend Analysis By Market Taxonomy, 2021 to 2025
    • Market Size Value (USD Million) Forecast By Market Taxonomy, 2026 to 2036
      • By Country
        • India
        • ASEAN
        • Australia & New Zealand
        • Rest of South Asia and Pacific
      • By Application
      • By End Use Industry
      • By Grade
      • By Form
      • By Sales Channel
    • Market Attractiveness Analysis
      • By Country
      • By Application
      • By End Use Industry
      • By Grade
      • By Form
      • By Sales Channel
    • Key Takeaways
  19. Middle East & Africa Market Analysis 2021 to 2025 and Forecast 2026 to 2036, By Country
    • Historical Market Size Value (USD Million) Trend Analysis By Market Taxonomy, 2021 to 2025
    • Market Size Value (USD Million) Forecast By Market Taxonomy, 2026 to 2036
      • By Country
        • Kingdom of Saudi Arabia
        • Other GCC Countries
        • Turkiye
        • South Africa
        • Other African Union
        • Rest of Middle East & Africa
      • By Application
      • By End Use Industry
      • By Grade
      • By Form
      • By Sales Channel
    • Market Attractiveness Analysis
      • By Country
      • By Application
      • By End Use Industry
      • By Grade
      • By Form
      • By Sales Channel
    • Key Takeaways
  20. Key Countries Market Analysis
    • USA
      • Pricing Analysis
      • Market Share Analysis, 2025
        • By Application
        • By End Use Industry
        • By Grade
        • By Form
        • By Sales Channel
    • Canada
      • Pricing Analysis
      • Market Share Analysis, 2025
        • By Application
        • By End Use Industry
        • By Grade
        • By Form
        • By Sales Channel
    • Mexico
      • Pricing Analysis
      • Market Share Analysis, 2025
        • By Application
        • By End Use Industry
        • By Grade
        • By Form
        • By Sales Channel
    • Brazil
      • Pricing Analysis
      • Market Share Analysis, 2025
        • By Application
        • By End Use Industry
        • By Grade
        • By Form
        • By Sales Channel
    • Chile
      • Pricing Analysis
      • Market Share Analysis, 2025
        • By Application
        • By End Use Industry
        • By Grade
        • By Form
        • By Sales Channel
    • Germany
      • Pricing Analysis
      • Market Share Analysis, 2025
        • By Application
        • By End Use Industry
        • By Grade
        • By Form
        • By Sales Channel
    • UK
      • Pricing Analysis
      • Market Share Analysis, 2025
        • By Application
        • By End Use Industry
        • By Grade
        • By Form
        • By Sales Channel
    • Italy
      • Pricing Analysis
      • Market Share Analysis, 2025
        • By Application
        • By End Use Industry
        • By Grade
        • By Form
        • By Sales Channel
    • Spain
      • Pricing Analysis
      • Market Share Analysis, 2025
        • By Application
        • By End Use Industry
        • By Grade
        • By Form
        • By Sales Channel
    • France
      • Pricing Analysis
      • Market Share Analysis, 2025
        • By Application
        • By End Use Industry
        • By Grade
        • By Form
        • By Sales Channel
    • India
      • Pricing Analysis
      • Market Share Analysis, 2025
        • By Application
        • By End Use Industry
        • By Grade
        • By Form
        • By Sales Channel
    • ASEAN
      • Pricing Analysis
      • Market Share Analysis, 2025
        • By Application
        • By End Use Industry
        • By Grade
        • By Form
        • By Sales Channel
    • Australia & New Zealand
      • Pricing Analysis
      • Market Share Analysis, 2025
        • By Application
        • By End Use Industry
        • By Grade
        • By Form
        • By Sales Channel
    • China
      • Pricing Analysis
      • Market Share Analysis, 2025
        • By Application
        • By End Use Industry
        • By Grade
        • By Form
        • By Sales Channel
    • Japan
      • Pricing Analysis
      • Market Share Analysis, 2025
        • By Application
        • By End Use Industry
        • By Grade
        • By Form
        • By Sales Channel
    • South Korea
      • Pricing Analysis
      • Market Share Analysis, 2025
        • By Application
        • By End Use Industry
        • By Grade
        • By Form
        • By Sales Channel
    • Russia
      • Pricing Analysis
      • Market Share Analysis, 2025
        • By Application
        • By End Use Industry
        • By Grade
        • By Form
        • By Sales Channel
    • Poland
      • Pricing Analysis
      • Market Share Analysis, 2025
        • By Application
        • By End Use Industry
        • By Grade
        • By Form
        • By Sales Channel
    • Hungary
      • Pricing Analysis
      • Market Share Analysis, 2025
        • By Application
        • By End Use Industry
        • By Grade
        • By Form
        • By Sales Channel
    • Kingdom of Saudi Arabia
      • Pricing Analysis
      • Market Share Analysis, 2025
        • By Application
        • By End Use Industry
        • By Grade
        • By Form
        • By Sales Channel
    • Turkiye
      • Pricing Analysis
      • Market Share Analysis, 2025
        • By Application
        • By End Use Industry
        • By Grade
        • By Form
        • By Sales Channel
    • South Africa
      • Pricing Analysis
      • Market Share Analysis, 2025
        • By Application
        • By End Use Industry
        • By Grade
        • By Form
        • By Sales Channel
  21. Market Structure Analysis
    • Competition Dashboard
    • Competition Benchmarking
    • Market Share Analysis of Top Players
      • By Regional
      • By Application
      • By End Use Industry
      • By Grade
      • By Form
      • By Sales Channel
  22. Competition Analysis
    • Competition Deep Dive
      • Emerald Performance Materials
        • Overview
        • Product Portfolio
        • Profitability by Market Segments (Product/Age /Sales Channel/Region)
        • Sales Footprint
        • Strategy Overview
          • Marketing Strategy
          • Product Strategy
          • Channel Strategy
      • Wuhan Youji Industries Co.
      • Tianjin Dongda Chemical Group
      • IG Petrochemicals Ltd.
      • Aarsha Chemicals Private Limited
      • Reliance Industries Limited
  23. Assumptions & Acronyms Used

List Of Table

  • Table 1: Global Market Value (USD Million) Forecast by Region, 2021 to 2036
  • Table 2: Global Market Value (USD Million) Forecast by Application , 2021 to 2036
  • Table 3: Global Market Value (USD Million) Forecast by End Use Industry, 2021 to 2036
  • Table 4: Global Market Value (USD Million) Forecast by Grade, 2021 to 2036
  • Table 5: Global Market Value (USD Million) Forecast by Form, 2021 to 2036
  • Table 6: Global Market Value (USD Million) Forecast by Sales Channel, 2021 to 2036
  • Table 7: North America Market Value (USD Million) Forecast by Country, 2021 to 2036
  • Table 8: North America Market Value (USD Million) Forecast by Application , 2021 to 2036
  • Table 9: North America Market Value (USD Million) Forecast by End Use Industry, 2021 to 2036
  • Table 10: North America Market Value (USD Million) Forecast by Grade, 2021 to 2036
  • Table 11: North America Market Value (USD Million) Forecast by Form, 2021 to 2036
  • Table 12: North America Market Value (USD Million) Forecast by Sales Channel, 2021 to 2036
  • Table 13: Latin America Market Value (USD Million) Forecast by Country, 2021 to 2036
  • Table 14: Latin America Market Value (USD Million) Forecast by Application , 2021 to 2036
  • Table 15: Latin America Market Value (USD Million) Forecast by End Use Industry, 2021 to 2036
  • Table 16: Latin America Market Value (USD Million) Forecast by Grade, 2021 to 2036
  • Table 17: Latin America Market Value (USD Million) Forecast by Form, 2021 to 2036
  • Table 18: Latin America Market Value (USD Million) Forecast by Sales Channel, 2021 to 2036
  • Table 19: Western Europe Market Value (USD Million) Forecast by Country, 2021 to 2036
  • Table 20: Western Europe Market Value (USD Million) Forecast by Application , 2021 to 2036
  • Table 21: Western Europe Market Value (USD Million) Forecast by End Use Industry, 2021 to 2036
  • Table 22: Western Europe Market Value (USD Million) Forecast by Grade, 2021 to 2036
  • Table 23: Western Europe Market Value (USD Million) Forecast by Form, 2021 to 2036
  • Table 24: Western Europe Market Value (USD Million) Forecast by Sales Channel, 2021 to 2036
  • Table 25: Eastern Europe Market Value (USD Million) Forecast by Country, 2021 to 2036
  • Table 26: Eastern Europe Market Value (USD Million) Forecast by Application , 2021 to 2036
  • Table 27: Eastern Europe Market Value (USD Million) Forecast by End Use Industry, 2021 to 2036
  • Table 28: Eastern Europe Market Value (USD Million) Forecast by Grade, 2021 to 2036
  • Table 29: Eastern Europe Market Value (USD Million) Forecast by Form, 2021 to 2036
  • Table 30: Eastern Europe Market Value (USD Million) Forecast by Sales Channel, 2021 to 2036
  • Table 31: East Asia Market Value (USD Million) Forecast by Country, 2021 to 2036
  • Table 32: East Asia Market Value (USD Million) Forecast by Application , 2021 to 2036
  • Table 33: East Asia Market Value (USD Million) Forecast by End Use Industry, 2021 to 2036
  • Table 34: East Asia Market Value (USD Million) Forecast by Grade, 2021 to 2036
  • Table 35: East Asia Market Value (USD Million) Forecast by Form, 2021 to 2036
  • Table 36: East Asia Market Value (USD Million) Forecast by Sales Channel, 2021 to 2036
  • Table 37: South Asia and Pacific Market Value (USD Million) Forecast by Country, 2021 to 2036
  • Table 38: South Asia and Pacific Market Value (USD Million) Forecast by Application , 2021 to 2036
  • Table 39: South Asia and Pacific Market Value (USD Million) Forecast by End Use Industry, 2021 to 2036
  • Table 40: South Asia and Pacific Market Value (USD Million) Forecast by Grade, 2021 to 2036
  • Table 41: South Asia and Pacific Market Value (USD Million) Forecast by Form, 2021 to 2036
  • Table 42: South Asia and Pacific Market Value (USD Million) Forecast by Sales Channel, 2021 to 2036
  • Table 43: Middle East & Africa Market Value (USD Million) Forecast by Country, 2021 to 2036
  • Table 44: Middle East & Africa Market Value (USD Million) Forecast by Application , 2021 to 2036
  • Table 45: Middle East & Africa Market Value (USD Million) Forecast by End Use Industry, 2021 to 2036
  • Table 46: Middle East & Africa Market Value (USD Million) Forecast by Grade, 2021 to 2036
  • Table 47: Middle East & Africa Market Value (USD Million) Forecast by Form, 2021 to 2036
  • Table 48: Middle East & Africa Market Value (USD Million) Forecast by Sales Channel, 2021 to 2036

List Of Figures

  • Figure 1: Global Market Pricing Analysis
  • Figure 2: Global Market Value (USD Million) Forecast 2021-2036
  • Figure 3: Global Market Value Share and BPS Analysis by Application , 2026 and 2036
  • Figure 4: Global Market Y-o-Y Growth Comparison by Application , 2026-2036
  • Figure 5: Global Market Attractiveness Analysis by Application
  • Figure 6: Global Market Value Share and BPS Analysis by End Use Industry, 2026 and 2036
  • Figure 7: Global Market Y-o-Y Growth Comparison by End Use Industry, 2026-2036
  • Figure 8: Global Market Attractiveness Analysis by End Use Industry
  • Figure 9: Global Market Value Share and BPS Analysis by Grade, 2026 and 2036
  • Figure 10: Global Market Y-o-Y Growth Comparison by Grade, 2026-2036
  • Figure 11: Global Market Attractiveness Analysis by Grade
  • Figure 12: Global Market Value Share and BPS Analysis by Form, 2026 and 2036
  • Figure 13: Global Market Y-o-Y Growth Comparison by Form, 2026-2036
  • Figure 14: Global Market Attractiveness Analysis by Form
  • Figure 15: Global Market Value Share and BPS Analysis by Sales Channel, 2026 and 2036
  • Figure 16: Global Market Y-o-Y Growth Comparison by Sales Channel, 2026-2036
  • Figure 17: Global Market Attractiveness Analysis by Sales Channel
  • Figure 18: Global Market Value (USD Million) Share and BPS Analysis by Region, 2026 and 2036
  • Figure 19: Global Market Y-o-Y Growth Comparison by Region, 2026-2036
  • Figure 20: Global Market Attractiveness Analysis by Region
  • Figure 21: North America Market Incremental Dollar Opportunity, 2026-2036
  • Figure 22: Latin America Market Incremental Dollar Opportunity, 2026-2036
  • Figure 23: Western Europe Market Incremental Dollar Opportunity, 2026-2036
  • Figure 24: Eastern Europe Market Incremental Dollar Opportunity, 2026-2036
  • Figure 25: East Asia Market Incremental Dollar Opportunity, 2026-2036
  • Figure 26: South Asia and Pacific Market Incremental Dollar Opportunity, 2026-2036
  • Figure 27: Middle East & Africa Market Incremental Dollar Opportunity, 2026-2036
  • Figure 28: North America Market Value Share and BPS Analysis by Country, 2026 and 2036
  • Figure 29: North America Market Value Share and BPS Analysis by Application , 2026 and 2036
  • Figure 30: North America Market Y-o-Y Growth Comparison by Application , 2026-2036
  • Figure 31: North America Market Attractiveness Analysis by Application
  • Figure 32: North America Market Value Share and BPS Analysis by End Use Industry, 2026 and 2036
  • Figure 33: North America Market Y-o-Y Growth Comparison by End Use Industry, 2026-2036
  • Figure 34: North America Market Attractiveness Analysis by End Use Industry
  • Figure 35: North America Market Value Share and BPS Analysis by Grade, 2026 and 2036
  • Figure 36: North America Market Y-o-Y Growth Comparison by Grade, 2026-2036
  • Figure 37: North America Market Attractiveness Analysis by Grade
  • Figure 38: North America Market Value Share and BPS Analysis by Form, 2026 and 2036
  • Figure 39: North America Market Y-o-Y Growth Comparison by Form, 2026-2036
  • Figure 40: North America Market Attractiveness Analysis by Form
  • Figure 41: North America Market Value Share and BPS Analysis by Sales Channel, 2026 and 2036
  • Figure 42: North America Market Y-o-Y Growth Comparison by Sales Channel, 2026-2036
  • Figure 43: North America Market Attractiveness Analysis by Sales Channel
  • Figure 44: Latin America Market Value Share and BPS Analysis by Country, 2026 and 2036
  • Figure 45: Latin America Market Value Share and BPS Analysis by Application , 2026 and 2036
  • Figure 46: Latin America Market Y-o-Y Growth Comparison by Application , 2026-2036
  • Figure 47: Latin America Market Attractiveness Analysis by Application
  • Figure 48: Latin America Market Value Share and BPS Analysis by End Use Industry, 2026 and 2036
  • Figure 49: Latin America Market Y-o-Y Growth Comparison by End Use Industry, 2026-2036
  • Figure 50: Latin America Market Attractiveness Analysis by End Use Industry
  • Figure 51: Latin America Market Value Share and BPS Analysis by Grade, 2026 and 2036
  • Figure 52: Latin America Market Y-o-Y Growth Comparison by Grade, 2026-2036
  • Figure 53: Latin America Market Attractiveness Analysis by Grade
  • Figure 54: Latin America Market Value Share and BPS Analysis by Form, 2026 and 2036
  • Figure 55: Latin America Market Y-o-Y Growth Comparison by Form, 2026-2036
  • Figure 56: Latin America Market Attractiveness Analysis by Form
  • Figure 57: Latin America Market Value Share and BPS Analysis by Sales Channel, 2026 and 2036
  • Figure 58: Latin America Market Y-o-Y Growth Comparison by Sales Channel, 2026-2036
  • Figure 59: Latin America Market Attractiveness Analysis by Sales Channel
  • Figure 60: Western Europe Market Value Share and BPS Analysis by Country, 2026 and 2036
  • Figure 61: Western Europe Market Value Share and BPS Analysis by Application , 2026 and 2036
  • Figure 62: Western Europe Market Y-o-Y Growth Comparison by Application , 2026-2036
  • Figure 63: Western Europe Market Attractiveness Analysis by Application
  • Figure 64: Western Europe Market Value Share and BPS Analysis by End Use Industry, 2026 and 2036
  • Figure 65: Western Europe Market Y-o-Y Growth Comparison by End Use Industry, 2026-2036
  • Figure 66: Western Europe Market Attractiveness Analysis by End Use Industry
  • Figure 67: Western Europe Market Value Share and BPS Analysis by Grade, 2026 and 2036
  • Figure 68: Western Europe Market Y-o-Y Growth Comparison by Grade, 2026-2036
  • Figure 69: Western Europe Market Attractiveness Analysis by Grade
  • Figure 70: Western Europe Market Value Share and BPS Analysis by Form, 2026 and 2036
  • Figure 71: Western Europe Market Y-o-Y Growth Comparison by Form, 2026-2036
  • Figure 72: Western Europe Market Attractiveness Analysis by Form
  • Figure 73: Western Europe Market Value Share and BPS Analysis by Sales Channel, 2026 and 2036
  • Figure 74: Western Europe Market Y-o-Y Growth Comparison by Sales Channel, 2026-2036
  • Figure 75: Western Europe Market Attractiveness Analysis by Sales Channel
  • Figure 76: Eastern Europe Market Value Share and BPS Analysis by Country, 2026 and 2036
  • Figure 77: Eastern Europe Market Value Share and BPS Analysis by Application , 2026 and 2036
  • Figure 78: Eastern Europe Market Y-o-Y Growth Comparison by Application , 2026-2036
  • Figure 79: Eastern Europe Market Attractiveness Analysis by Application
  • Figure 80: Eastern Europe Market Value Share and BPS Analysis by End Use Industry, 2026 and 2036
  • Figure 81: Eastern Europe Market Y-o-Y Growth Comparison by End Use Industry, 2026-2036
  • Figure 82: Eastern Europe Market Attractiveness Analysis by End Use Industry
  • Figure 83: Eastern Europe Market Value Share and BPS Analysis by Grade, 2026 and 2036
  • Figure 84: Eastern Europe Market Y-o-Y Growth Comparison by Grade, 2026-2036
  • Figure 85: Eastern Europe Market Attractiveness Analysis by Grade
  • Figure 86: Eastern Europe Market Value Share and BPS Analysis by Form, 2026 and 2036
  • Figure 87: Eastern Europe Market Y-o-Y Growth Comparison by Form, 2026-2036
  • Figure 88: Eastern Europe Market Attractiveness Analysis by Form
  • Figure 89: Eastern Europe Market Value Share and BPS Analysis by Sales Channel, 2026 and 2036
  • Figure 90: Eastern Europe Market Y-o-Y Growth Comparison by Sales Channel, 2026-2036
  • Figure 91: Eastern Europe Market Attractiveness Analysis by Sales Channel
  • Figure 92: East Asia Market Value Share and BPS Analysis by Country, 2026 and 2036
  • Figure 93: East Asia Market Value Share and BPS Analysis by Application , 2026 and 2036
  • Figure 94: East Asia Market Y-o-Y Growth Comparison by Application , 2026-2036
  • Figure 95: East Asia Market Attractiveness Analysis by Application
  • Figure 96: East Asia Market Value Share and BPS Analysis by End Use Industry, 2026 and 2036
  • Figure 97: East Asia Market Y-o-Y Growth Comparison by End Use Industry, 2026-2036
  • Figure 98: East Asia Market Attractiveness Analysis by End Use Industry
  • Figure 99: East Asia Market Value Share and BPS Analysis by Grade, 2026 and 2036
  • Figure 100: East Asia Market Y-o-Y Growth Comparison by Grade, 2026-2036
  • Figure 101: East Asia Market Attractiveness Analysis by Grade
  • Figure 102: East Asia Market Value Share and BPS Analysis by Form, 2026 and 2036
  • Figure 103: East Asia Market Y-o-Y Growth Comparison by Form, 2026-2036
  • Figure 104: East Asia Market Attractiveness Analysis by Form
  • Figure 105: East Asia Market Value Share and BPS Analysis by Sales Channel, 2026 and 2036
  • Figure 106: East Asia Market Y-o-Y Growth Comparison by Sales Channel, 2026-2036
  • Figure 107: East Asia Market Attractiveness Analysis by Sales Channel
  • Figure 108: South Asia and Pacific Market Value Share and BPS Analysis by Country, 2026 and 2036
  • Figure 109: South Asia and Pacific Market Value Share and BPS Analysis by Application , 2026 and 2036
  • Figure 110: South Asia and Pacific Market Y-o-Y Growth Comparison by Application , 2026-2036
  • Figure 111: South Asia and Pacific Market Attractiveness Analysis by Application
  • Figure 112: South Asia and Pacific Market Value Share and BPS Analysis by End Use Industry, 2026 and 2036
  • Figure 113: South Asia and Pacific Market Y-o-Y Growth Comparison by End Use Industry, 2026-2036
  • Figure 114: South Asia and Pacific Market Attractiveness Analysis by End Use Industry
  • Figure 115: South Asia and Pacific Market Value Share and BPS Analysis by Grade, 2026 and 2036
  • Figure 116: South Asia and Pacific Market Y-o-Y Growth Comparison by Grade, 2026-2036
  • Figure 117: South Asia and Pacific Market Attractiveness Analysis by Grade
  • Figure 118: South Asia and Pacific Market Value Share and BPS Analysis by Form, 2026 and 2036
  • Figure 119: South Asia and Pacific Market Y-o-Y Growth Comparison by Form, 2026-2036
  • Figure 120: South Asia and Pacific Market Attractiveness Analysis by Form
  • Figure 121: South Asia and Pacific Market Value Share and BPS Analysis by Sales Channel, 2026 and 2036
  • Figure 122: South Asia and Pacific Market Y-o-Y Growth Comparison by Sales Channel, 2026-2036
  • Figure 123: South Asia and Pacific Market Attractiveness Analysis by Sales Channel
  • Figure 124: Middle East & Africa Market Value Share and BPS Analysis by Country, 2026 and 2036
  • Figure 125: Middle East & Africa Market Value Share and BPS Analysis by Application , 2026 and 2036
  • Figure 126: Middle East & Africa Market Y-o-Y Growth Comparison by Application , 2026-2036
  • Figure 127: Middle East & Africa Market Attractiveness Analysis by Application
  • Figure 128: Middle East & Africa Market Value Share and BPS Analysis by End Use Industry, 2026 and 2036
  • Figure 129: Middle East & Africa Market Y-o-Y Growth Comparison by End Use Industry, 2026-2036
  • Figure 130: Middle East & Africa Market Attractiveness Analysis by End Use Industry
  • Figure 131: Middle East & Africa Market Value Share and BPS Analysis by Grade, 2026 and 2036
  • Figure 132: Middle East & Africa Market Y-o-Y Growth Comparison by Grade, 2026-2036
  • Figure 133: Middle East & Africa Market Attractiveness Analysis by Grade
  • Figure 134: Middle East & Africa Market Value Share and BPS Analysis by Form, 2026 and 2036
  • Figure 135: Middle East & Africa Market Y-o-Y Growth Comparison by Form, 2026-2036
  • Figure 136: Middle East & Africa Market Attractiveness Analysis by Form
  • Figure 137: Middle East & Africa Market Value Share and BPS Analysis by Sales Channel, 2026 and 2036
  • Figure 138: Middle East & Africa Market Y-o-Y Growth Comparison by Sales Channel, 2026-2036
  • Figure 139: Middle East & Africa Market Attractiveness Analysis by Sales Channel
  • Figure 140: Global Market - Tier Structure Analysis
  • Figure 141: Global Market - Company Share Analysis

Benzoic Acid Market