Better-for-you Snacks Market

Better-for-you Snacks Market Analysis, By Product Type (Cereal & Granola Bars, Dried Fruits & Nuts, and Others), By Ingredients (Whole Grains, Nuts & Seeds, and Others), By Claim (Gluten-Free, Low/No Sugar, and Others), By Consumer Group, By Distribution Channel, and Region - Market Insights 2025 to 2035

The Cereal & Granola Bars segment is projected to grow at a CAGR of 7.9%, whereas another segment Dried Fruits & Nuts is likely to grow at 8.3%. In terms of countries U.S. is projected to grow at 5.7%, followed by Germany at 5.0% and UK to grow at 9.5%

Better-for-you Snacks Market Outlook (2025 to 2035)

The global better-for-you snacks market is expected to reach USD 70.3 billion by 2035, up from USD 32.7 billion in 2024. During the forecast period (2025 to 2035), the industry is projected to expand at a CAGR of 7.2%, driven by growing health awareness, a preference for clean-label and functional ingredients, and the widespread embrace of active, wellness-focused lifestyles.

Consumers are exhibiting a strong preference for low-sugar, high-protein, and plant-based alternatives. Moreover, advancements in food technology and strategic investments by established FMCG players are facilitating broader market accessibility and sustained category growth.

Metric Value
Industry Size (2025E) USD 35.1 billion
Industry Size (2035F) USD 70.3 billion
CAGR (2025 to 2035) 7.2%

What key factors are driving growth in the global Better-for-you Snacks market segment today?

Several factors have contributed to the growth of the better-for-you snacks market. Increasing consumer awareness of diet-related health issues marks a positive shift toward the adoption of nutrient-dense and functional snack options.

The fear of busy lifestyles has led to calls for convenient and healthy alternatives to traditional snacks. Manufacturers have rolled out alternatives that cater to various diets, including vegan, keto, and allergen-free options.

The increasing demand for natural and sustainable foods has also prompted firms to reformulate their foods with clean-label ingredients. Wellness-oriented and transparent marketing strategies have also been accepted by consumers, maintaining high market interest and participation.

What are the key consumer-driven trends shaping the global better-for-you snacks market today?

Trends in dynamism, pegged to health, sustainability, and convenience, have come to be associated with the better-for-you snacks market. Meat-free snacks are gaining popularity, which also appeals to environmentally conscious individuals and those with digestive issues.

Adaptogen-laden, probiotic-infused, and high-fiber snacks have become increasingly commonplace. Minimal processing and clean-label transparency have been of high priority among consumers, which has influenced their purchasing behavior.

Innovative packaging and portion control features have enhanced on-the-go convenience, while influencer marketing and digital engagement strategies have been adopted to build consumer trust and expand brand visibility. Such changing patterns have influenced the development of innovative products and increased consumer loyalty within some core segments.

What factors are currently restraining growth in the global better-for-you snacks market?

Although this market is showing a favorable growing cycle, the better-for-you snacks market has been hindered by several challenges. Premium ingredients and sustainably sourced products have been significant challenges to production, leading to pricing issues in retail competition. Complexities in the regulation of health claims and labeling standards have increased operational challenges for global brands.

The concerns of consumers regarding the authenticity and transparency of their products that are also known to be health-washed have forced brands to keep their products and their processes of making products as quite transparent. The broader market penetration has not been achieved due to low awareness among certain sections and geographies.

Some formulations have also presented technical limitations regarding the optimization of shelf life and palatability. Such conditions have necessitated thorough strategic planning in order to maintain market performance and growth.

What regions are driving growth in the Better-for-you Snacks Market and why?

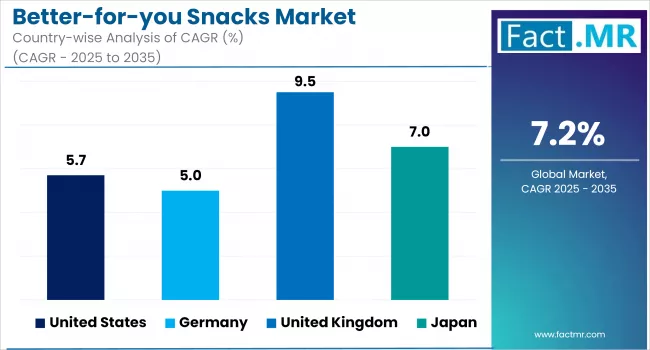
North America holds the largest share of the global better-for-you snacks market, driven by a substantial health-conscious consumer base and strong demand for clean-label and functional products. Creativity in protein and low-sugar-based snacks, along with the emergence of focused health food stores, has helped this region maintain solid market leadership up to 2025.

The better-for-you snacks market in East Asia has been expanding rapidly, fueled by accelerating urbanization, rising health awareness, and the growth of emerging middle-class populations. The demand in the region has been high for nutrient-based snacks of plant origin, particularly in countries such as China and South Korea, where the demographics have been predominantly characterized by the younger generation, whose preferences have driven the demand for functional and convenient snacking products.

Western Europe has emerged as a significant market in the better-for-you snacks sector, driven by a growing emphasis on healthy snacking among regulators and a rising preference among consumers for organic, gluten-free, and sustainable options. The current wellness trend and clean-label transparency have contributed to the steady demand in the region until 2025.

Country-Wise Outlook

Health-Conscious Consumers and Functional Ingredients Boost U.S. Better-for-you Snacks Market

Better For You Snacks Market Country Wise Analysis Of CAGR 2025 2035

The better-for-you snack market share in the U.S. has been steadily increasing due to consumers' preference for snack products that have been added to and enriched with nutrients. The increasing interest in wellness and clean-label ingredients has encouraged food brands to become more invested in products with functional ingredients that are integrated, reduced sugar, and plant-based nutrition.

This change has also led to healthier, goal-driven eating habits. Protein bars, whole-grain crisps, and lightly processed nuts have been extremely popular, as they cater to the conditions of satiety and transparency.

The need for snacking options that actually work, with an increased emphasis on those containing probiotics or adaptogens, has elevated Better-for-you Snacks to a mandatory level, further strengthening consumer priorities of focusing on immune support and digestive health without sacrificing flavor.

Clean-Label Compliance and Dairy Innovation Propel Germany’s Better-for-you Snacks Market

The German Better-for-you Snacks market has been supported by regulatory compliance and consumer demand for clean-label products. With the high standards of European food safety and the growing demand for additive-free and organic foods, manufacturers have found an opportunity to utilize natural ingredients and functional additives as well.

Improved-for-you snacks have trended in the dairy and bakery sections, where water-absorbing high-fiber grains, lower sugar content, and vegetable-based ingredients have been found to aid in avoiding spoilage without compromising taste and mouthfeel.

With the increased popularity of clean-label products, food producers have been adding familiar, short ingredient lists to their food in order to promote brand integrity as well as appeal to consumers interested in authenticity and sustainability in their daily snack foods. One of the crucial forms that support this trend has been vegan cheese snacks and crackers made of spelt.

Heritage Cuisine and Gourmet Consumption Spur U.K. Better-for-you Snacks Market

The better-for-you snacks market in the U.K. has experienced stability as the population has become increasingly fond of gourmet and Mediterranean-style eating lifestyles. The experience of artisanal and ethnic food inspiration has led to an increase in functional and nutrient-rich snacks in both home and out-of-home consumption.

The consumer in Britain has been shifting towards clean eating, which has led to a demand for lightly processed snack products with high nutritional content. Novel products like air-dried vegetable crisps, snack bars made of oats, as well as lentil chips, have found their way to the newfound focus of interest in indulgence and health.

Besides, the emergence of veganism and flexitarian food patterns has led to the creation of cross-foods that allow hybrids to incorporate plant-based ingredients into the texture and culinary adaptability that dairy-based products once offered.

Category-Wise Market Outlook

Protein/Energy Bites Gain Momentum Amid Busy Lifestyles and Functional Nutrition Trends

Better For You Snacks Market Analysis By Product Type

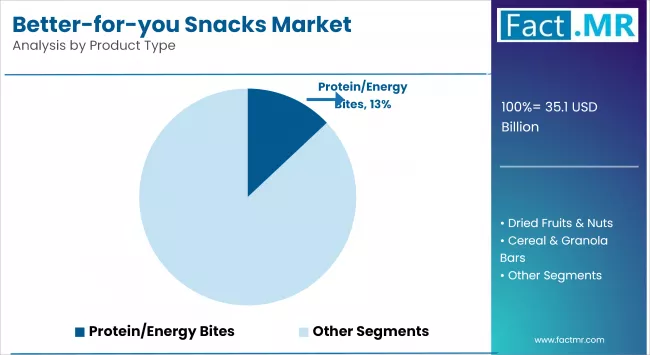
A rapidly expanding type of product is that of better-for-you snacks, where protein and energy bites are growing in popularity in the market. This category has been spurred by the rising demand for small-sized, saturated nutrition snacks among mobile consumers and shoppers. These bites have provided a convenient way to deliver high-quality proteins, vitamins, and adaptogens to people who care about their health.

Their increased popularity correlates with the transition to functional foods, where snacks are not only the means of hunger suppression, but the means to recover lost muscle mass, manage body weight, and provide current energy. They have also helped the clean-label claims with the help of natural sweeteners and plant ingredients, as well as being products of interest to sportspeople, as well as the general market.

Plant-Based Proteins Surge Forward as Sustainability and Dietary Shifts Reshape Snack Formulations

Better For You Snacks Market Analysis By Ingredient

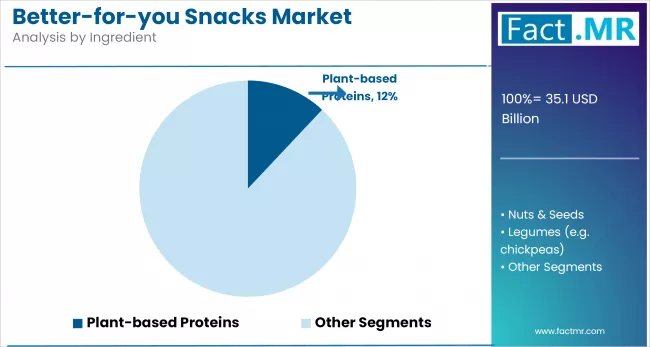
Plant-based Proteins are an ingredient in the better-for-you snacks market, which is currently experiencing super-accelerated growth. Around this, the increasing awareness of the environmental impacts of animal farming and the accompanying shift toward more vegan and flexitarian diets have driven growth.

The companies of snack brands have swiftly added pea protein, chickpea flour, and soy isolates to redevelop conventional snacks such as chips and granola bars in order to provide them with an increased protein content. It is also in line with recent consumer values on the areas of animal welfare and personal health.

Major corporations have jumped into this trend and released high-protein plant-based alternatives without any loss of flavor or texture. This trend has gained great impetus in places like North America and some areas in Asia-Pacific, which now enforce and practice sustainable and ethically correct consumption patterns to a much greater extent.

High Protein Snacks Dominate Amid Fitness-Driven Consumer Preferences

Protein is a vital value addition to consumers who practice active lifestyles because they demand snacks that can provide muscle-repairing as well as make them feel full. Major brands have responded by creating high-protein bars, chips, and confections with ingredients such as whey, casein, and legumes.

The trend has converged with that of keto and paleo diets, which have given additional energy to the consumer interest. Market penetration has been facilitated by regulatory support for health claims regarding protein and the presence of fortified products in retail channels, especially in regions where a culture of going to the gym and health clubs has led to more automated everyday dietary choices.

Competitive Analysis

A strong trend has emerged in the better-for-you snacks market, with major food and beverage companies prioritizing health-focused innovation. General Mills, for instance, has expanded its Nature Valley and LÄRABAR brands by incorporating cleaner labels and functional benefits. PepsiCo has expanded the Frito-Lay range by offering plant-based, baked and reduced-fat varieties. Nestle has relaunched its current snack and provided healthier snack options that profess its value in health-based and clean eating.

With brands such as RXBAR and Special K, Kellogg has focused on protein and fiber-forward products. Hain Celestial Group made a name for itself with its organic, non-GMO snacks, especially in its Earth's Best and Terra brands, which improved its standing among the health-conscious consumers.

The acquisition of Clif Bar & Company by Mondelēz International is strategic, as it also indicates the latter company's further commitment to the health bar and whole food snack category. Started by introducing transparent labeling and nut snacks that do not contain artificial ingredients, Kind LLC has established a strong brand identity.

Nature’s Bakery has also continued to focus on fruit- and whole-grain-based snacks, which appeal to consumers of natural foods. HIPPEAS has been a pioneer of innovation in the legume snack market, offering vegan and gluten-free chickpea puffs. Sustainability, ingredient transparency, and functional snacking are the driving forces behind the development of the competitive and fast-evolving snacking industry, as embraced by these companies.

Key players of the better-for-you snacks industry are General Mills, PepsiCo, Nestlé, Kellogg’s, The Hain Celestial Group, Mondelēz International, Kind LLC, Clif Bar & Company, Nature’s Bakery, and HIPPEAS.

Recent Development

  • In December 2024 Superfoodio unveiled Peanut Butter Better Cups, a plant-based, no-added-sugar alternative to traditional peanut butter cups. Made with 100% natural ingredients, these snacks aim to provide a healthier indulgence for peanut butter enthusiasts.
  • In June 2024, Clio Snacks expanded its better-for-you portfolio with Mini Greek Yogurt Bars Dipped in Yogurt. These refrigerated, grab-and-go snacks offer a convenient, indulgent option with the benefits of Greek yogurt, catering to health-conscious consumers seeking nutritious treats.

Fact.MR has provided detailed information about the price points of key manufacturers in the better-for-you snacks market, positioned across regions, including sales growth, production capacity, and speculative technological expansion, in the recently published report.

Methodology and Industry Tracking Approach

The 2025 global better-for-you snacks market report by Fact.MR sets a new benchmark in strategic market intelligence, offering a precision-engineered, data-intensive view of the expanding influence of better-for-you snacks across global foodservice, premium snacking innovation, and sustainable nutrition ecosystems. Anchored in insights from over 7,500 stakeholders across 35 countries, each providing more than 300 qualified responses, the report delivers unmatched analytical rigor, geographic diversity, and industry relevance.

The respondent architecture was deliberately constructed to ensure 360-degree perspectives, with two-thirds comprising end users and strategic decision-makers, including R&D directors, category managers, innovation heads, procurement leads, and sustainability officers from leading CPG, hospitality, and retail firms. The remaining one-third featured domain experts such as nutritionists, food scientists, clean-label auditors, shelf-life technologists, and supply chain specialists active in functional ingredients, protein fortification, and minimally processed formulations.

Spanning an extensive research cycle from June 2024 to May 2025, the report captures the transformative currents reshaping the better-for-you snacks market: ingredient innovations (e.g., plant-based proteins, adaptogens, fiber-enriched matrices), processing advancements (air-puffing, high-moisture extrusion), format diversification (bite-sized, resealable packs, hybrid sweet-savory combos), and regulatory progress surrounding nutrition labeling, HFSS compliance, and international clean-label standards. A stratified modeling framework ensured robust weighting of insights by region, stakeholder profile, and distribution channel.

Developed using over 250 validated sources, including global trade flows, regulatory archives, patent databases, whitepapers, and in-house audit systems, the study applies advanced techniques such as segmentation clustering, trend trajectory modeling, and multi-factor regression to deliver predictive, decision-grade insights.

With continuous monitoring since 2018, this 2025 edition is an essential strategic toolkit for CPG innovation leaders, foodservice planners, clean-label reformulation teams, retail category architects, and institutional investors seeking to lead in the rapidly evolving better-for-you snacks economy.

Segmentation of Better-for-you Snacks Market Research

  • By Product Type :

    • Cereal & Granola Bars
    • Dried Fruits & Nuts
    • Trail Mix & Snack Mixes
    • Vegetable Chips
    • Protein/Energy Bites
    • Functional Snack Foods
    • Low-Calorie Confections
  • By Ingredient :

    • Whole Grains
    • Nuts & Seeds
    • Legumes (e.g. chickpeas)
    • Fruits & Vegetables
    • Plant-based Proteins
    • Functional Ingredients
    • Alternative Sweeteners
  • By Claim :

    • Gluten-Free
    • Low/No Sugar
    • Organic
    • Vegan
    • High Protein
    • Non-GMO
    • Clean Label
  • By Consumer Group :

    • Children
    • Adults
    • Seniors
    • Fitness Enthusiasts
    • Diabetic Consumers
    • Lactose-Intolerant
    • Pregnant Women
  • By Distribution Channel :

    • Supermarkets/Hypermarkets
    • Convenience Stores
    • Specialty Stores
    • Online Retail
    • Health Food Stores
    • Pharmacies/Drug Stores
    • Others (e.g. vending machines)
  • By Region :

    • North America
    • Latin America
    • Western Europe
    • Eastern Europe
    • East Asia
    • South Asia & Pacific
    • Middle East & Africa

Table of Content

  1. Executive Summary
    • Global Market Outlook
    • Demand-side Trends
    • Supply-side Trends
    • Technology Roadmap Analysis
    • Analysis and Recommendations
  2. Market Overview
    • Market Coverage / Taxonomy
    • Market Definition / Scope / Limitations
  3. Market Background
    • Market Dynamics
      • Drivers
      • Restraints
      • Opportunity
      • Trends
    • Scenario Forecast
      • Demand in Optimistic Scenario
      • Demand in Likely Scenario
      • Demand in Conservative Scenario
    • Opportunity Map Analysis
    • Product Life Cycle Analysis
    • Supply Chain Analysis
      • Supply Side Participants and their Roles
        • Producers
        • Mid-Level Participants (Traders/ Agents/ Brokers)
        • Wholesalers and Distributors
      • Value Added and Value Created at Node in the Supply Chain
      • List of Raw Material Suppliers
      • List of Existing and Potential Buyers
    • Investment Feasibility Matrix
    • Value Chain Analysis
      • Profit Margin Analysis
      • Wholesalers and Distributors
      • Retailers
    • PESTLE and Porter’s Analysis
    • Regulatory Landscape
      • By Key Regions
      • By Key Countries
    • Production and Consumption Statistics
    • Import and Export Statistics
  4. Global Market Analysis 2020 to 2024 and Forecast, 2025 to 2035
    • Historical Market Size Value (USD Bn) & Volume (Tons) Analysis, 2020 to 2024
    • Current and Future Market Size Value (USD Bn) & Volume (Tons) Projections, 2025 to 2035
      • Y-o-Y Growth Trend Analysis
      • Absolute $ Opportunity Analysis
  5. Global Market Pricing Analysis 2020 to 2024 and Forecast 2025 to 2035
  6. Global Market Analysis 2020 to 2024 and Forecast 2025 to 2035, By Product Type
    • Introduction / Key Findings
    • Historical Market Size Value (USD Bn) & Volume (Tons) Analysis By Product Type, 2020 to 2024
    • Current and Future Market Size Value (USD Bn) & Volume (Tons) Analysis and Forecast By Product Type, 2025 to 2035
      • Cereal & Granola Bars
      • Dried Fruits & Nuts
      • Trail Mix & Snack Mixes
      • Vegetable Chips
      • Protein/Energy Bites
      • Functional Snack Foods
      • Low-Calorie Confections
    • Y-o-Y Growth Trend Analysis By Product Type, 2020 to 2024
    • Absolute $ Opportunity Analysis By Product Type, 2025 to 2035
  7. Global Market Analysis 2020 to 2024 and Forecast 2025 to 2035, By Ingredient
    • Introduction / Key Findings
    • Historical Market Size Value (USD Bn) & Volume (Tons) Analysis By Ingredient, 2020 to 2024
    • Current and Future Market Size Value (USD Bn) & Volume (Tons) Analysis and Forecast By Ingredient, 2025 to 2035
      • Whole Grains
      • Nuts & Seeds
      • Legumes (e.g. chickpeas)
      • Fruits & Vegetables
      • Plant-based Proteins
      • Functional Ingredients
      • Alternative Sweeteners
    • Y-o-Y Growth Trend Analysis By Ingredient, 2020 to 2024
    • Absolute $ Opportunity Analysis By Ingredient, 2025 to 2035
  8. Global Market Analysis 2020 to 2024 and Forecast 2025 to 2035, By Claim
    • Introduction / Key Findings
    • Historical Market Size Value (USD Bn) & Volume (Tons) Analysis By Claim, 2020 to 2024
    • Current and Future Market Size Value (USD Bn) & Volume (Tons) Analysis and Forecast By Claim, 2025 to 2035
      • Gluten-Free
      • Low/No Sugar
      • Organic
      • Vegan
      • High Protein
      • Non-GMO
      • Clean Label
    • Y-o-Y Growth Trend Analysis By Claim, 2020 to 2024
    • Absolute $ Opportunity Analysis By Claim, 2025 to 2035
  9. Global Market Analysis 2020 to 2024 and Forecast 2025 to 2035, By Consumer Group
    • Introduction / Key Findings
    • Historical Market Size Value (USD Bn) & Volume (Tons) Analysis By Consumer Group, 2020 to 2024
    • Current and Future Market Size Value (USD Bn) & Volume (Tons) Analysis and Forecast By Consumer Group, 2025 to 2035
      • Children
      • Adults
      • Seniors
      • Fitness Enthusiasts
      • Diabetic Consumers
      • Lactose-Intolerant
      • Pregnant Women
    • Y-o-Y Growth Trend Analysis By Consumer Group, 2020 to 2024
    • Absolute $ Opportunity Analysis By Consumer Group, 2025 to 2035
  10. Global Market Analysis 2020 to 2024 and Forecast 2025 to 2035, By Distribution Channel
    • Introduction / Key Findings
    • Historical Market Size Value (USD Bn) & Volume (Tons) Analysis By Distribution Channel, 2020 to 2024
    • Current and Future Market Size Value (USD Bn) & Volume (Tons) Analysis and Forecast By Distribution Channel, 2025 to 2035
      • Supermarkets/Hypermarkets
      • Convenience Stores
      • Specialty Stores
      • Online Retail
      • Health Food Stores
      • Pharmacies/Drug Stores
      • Others (e.g. vending machines)
    • Y-o-Y Growth Trend Analysis By Distribution Channel, 2020 to 2024
    • Absolute $ Opportunity Analysis By Distribution Channel, 2025 to 2035
  11. Global Market Analysis 2020 to 2024 and Forecast 2025 to 2035, By Region
    • Introduction
    • Historical Market Size Value (USD Bn) & Volume (Tons) Analysis By Region, 2020 to 2024
    • Current Market Size Value (USD Bn) & Volume (Tons) Analysis and Forecast By Region, 2025 to 2035
      • North America
      • Latin America
      • Europe
      • East Asia
      • South Asia
      • Oceania
      • MEA
    • Market Attractiveness Analysis By Region
  12. North America Market Analysis 2020 to 2024 and Forecast 2025 to 2035, By Country
    • Historical Market Size Value (USD Bn) & Volume (Tons) Trend Analysis By Market Taxonomy, 2020 to 2024
    • Market Size Value (USD Bn) & Volume (Tons) Forecast By Market Taxonomy, 2025 to 2035
      • By Country
        • U.S.
        • Canada
      • By Product Type
      • By Ingredient
      • By Claim
      • By Consumer Group
      • By Distribution Channel
    • Market Attractiveness Analysis
      • By Country
      • By Product Type
      • By Ingredient
      • By Claim
      • By Consumer Group
      • By Distribution Channel
    • Key Takeaways
  13. Latin America Market Analysis 2020 to 2024 and Forecast 2025 to 2035, By Country
    • Historical Market Size Value (USD Bn) & Volume (Tons) Trend Analysis By Market Taxonomy, 2020 to 2024
    • Market Size Value (USD Bn) & Volume (Tons) Forecast By Market Taxonomy, 2025 to 2035
      • By Country
        • Brazil
        • Mexico
        • Argentina
        • Chile
        • Peru
        • Rest of Latin America
      • By Product Type
      • By Ingredient
      • By Claim
      • By Consumer Group
      • By Distribution Channel
    • Market Attractiveness Analysis
      • By Country
      • By Product Type
      • By Ingredient
      • By Claim
      • By Consumer Group
      • By Distribution Channel
    • Key Takeaways
  14. Europe Market Analysis 2020 to 2024 and Forecast 2025 to 2035, By Country
    • Historical Market Size Value (USD Bn) & Volume (Tons) Trend Analysis By Market Taxonomy, 2020 to 2024
    • Market Size Value (USD Bn) & Volume (Tons) Forecast By Market Taxonomy, 2025 to 2035
      • By Country
        • Germany
        • Italy
        • France
        • U.K.
        • Spain
        • Russia
        • BENELUX
        • Rest of Europe
      • By Product Type
      • By Ingredient
      • By Claim
      • By Consumer Group
      • By Distribution Channel
    • Market Attractiveness Analysis
      • By Country
      • By Product Type
      • By Ingredient
      • By Claim
      • By Consumer Group
      • By Distribution Channel
    • Key Takeaways
  15. East Asia Market Analysis 2020 to 2024 and Forecast 2025 to 2035, By Country
    • Historical Market Size Value (USD Bn) & Volume (Tons) Trend Analysis By Market Taxonomy, 2020 to 2024
    • Market Size Value (USD Bn) & Volume (Tons) Forecast By Market Taxonomy, 2025 to 2035
      • By Country
        • China
        • Japan
        • South Korea
      • By Product Type
      • By Ingredient
      • By Claim
      • By Consumer Group
      • By Distribution Channel
    • Market Attractiveness Analysis
      • By Country
      • By Product Type
      • By Ingredient
      • By Claim
      • By Consumer Group
      • By Distribution Channel
    • Key Takeaways
  16. South Asia Market Analysis 2020 to 2024 and Forecast 2025 to 2035, By Country
    • Historical Market Size Value (USD Bn) & Volume (Tons) Trend Analysis By Market Taxonomy, 2020 to 2024
    • Market Size Value (USD Bn) & Volume (Tons) Forecast By Market Taxonomy, 2025 to 2035
      • By Country
        • India
        • Thailand
        • Malaysia
        • Indonesia
        • Rest of South Asia
      • By Product Type
      • By Ingredient
      • By Claim
      • By Consumer Group
      • By Distribution Channel
    • Market Attractiveness Analysis
      • By Country
      • By Product Type
      • By Ingredient
      • By Claim
      • By Consumer Group
      • By Distribution Channel
    • Key Takeaways
  17. Oceania Market Analysis 2020 to 2024 and Forecast 2025 to 2035, By Country
    • Historical Market Size Value (USD Bn) & Volume (Tons) Trend Analysis By Market Taxonomy, 2020 to 2024
    • Market Size Value (USD Bn) & Volume (Tons) Forecast By Market Taxonomy, 2025 to 2035
      • By Country
        • Australia
        • New Zealand
      • By Product Type
      • By Ingredient
      • By Claim
      • By Consumer Group
      • By Distribution Channel
    • Market Attractiveness Analysis
      • By Country
      • By Product Type
      • By Ingredient
      • By Claim
      • By Consumer Group
      • By Distribution Channel
    • Key Takeaways
  18. MEA Market Analysis 2020 to 2024 and Forecast 2025 to 2035, By Country
    • Historical Market Size Value (USD Bn) & Volume (Tons) Trend Analysis By Market Taxonomy, 2020 to 2024
    • Market Size Value (USD Bn) & Volume (Tons) Forecast By Market Taxonomy, 2025 to 2035
      • By Country
        • GCC
        • Rest of MEA
      • By Product Type
      • By Ingredient
      • By Claim
      • By Consumer Group
      • By Distribution Channel
    • Market Attractiveness Analysis
      • By Country
      • By Product Type
      • By Ingredient
      • By Claim
      • By Consumer Group
      • By Distribution Channel
    • Key Takeaways
  19. Key Countries Market Analysis
    • Value (USD Bn) & Volume (Tons)ed States
      • Pricing Analysis
      • Market Share Analysis, 2024
        • By Product Type
        • By Ingredient
        • By Claim
        • By Consumer Group
        • By Distribution Channel
    • Germany
      • Pricing Analysis
      • Market Share Analysis, 2024
        • By Product Type
        • By Ingredient
        • By Claim
        • By Consumer Group
        • By Distribution Channel
    • Value (USD Bn) & Volume (Tons)ed Kingdom
      • Pricing Analysis
      • Market Share Analysis, 2024
        • By Product Type
        • By Ingredient
        • By Claim
        • By Consumer Group
        • By Distribution Channel
    • Japan
      • Pricing Analysis
      • Market Share Analysis, 2024
        • By Product Type
        • By Ingredient
        • By Claim
        • By Consumer Group
        • By Distribution Channel
    • China
      • Pricing Analysis
      • Market Share Analysis, 2024
        • By Product Type
        • By Ingredient
        • By Claim
        • By Consumer Group
        • By Distribution Channel
  20. Market Structure Analysis
    • Competition Dashboard
    • Competition Benchmarking
    • Market Share Analysis of Top Players
      • By Regional
      • By Product Type
      • By Ingredient
      • By Claim
      • By Consumer Group
      • By Distribution Channel
  21. Competition Analysis
    • Competition Deep Dive
      • General Mills
        • Overview
        • Product Portfolio
        • Profitability by Market Segments (Product/Age /Sales Channel/Region)
        • Sales Footprint
        • Strategy Overview
          • Marketing Strategy
          • Product Strategy
          • Channel Strategy
      • PepsiCo
        • Overview
        • Product Portfolio
        • Profitability by Market Segments (Product/Age /Sales Channel/Region)
        • Sales Footprint
        • Strategy Overview
          • Marketing Strategy
          • Product Strategy
          • Channel Strategy
      • Nestlé
        • Overview
        • Product Portfolio
        • Profitability by Market Segments (Product/Age /Sales Channel/Region)
        • Sales Footprint
        • Strategy Overview
          • Marketing Strategy
          • Product Strategy
          • Channel Strategy
      • Kellogg’s
        • Overview
        • Product Portfolio
        • Profitability by Market Segments (Product/Age /Sales Channel/Region)
        • Sales Footprint
        • Strategy Overview
          • Marketing Strategy
          • Product Strategy
          • Channel Strategy
      • The Hain Celestial Group
        • Overview
        • Product Portfolio
        • Profitability by Market Segments (Product/Age /Sales Channel/Region)
        • Sales Footprint
        • Strategy Overview
          • Marketing Strategy
          • Product Strategy
          • Channel Strategy
      • Mondelēz International
        • Overview
        • Product Portfolio
        • Profitability by Market Segments (Product/Age /Sales Channel/Region)
        • Sales Footprint
        • Strategy Overview
          • Marketing Strategy
          • Product Strategy
          • Channel Strategy
      • Kind LLC
        • Overview
        • Product Portfolio
        • Profitability by Market Segments (Product/Age /Sales Channel/Region)
        • Sales Footprint
        • Strategy Overview
          • Marketing Strategy
          • Product Strategy
          • Channel Strategy
      • Clif Bar & Company
        • Overview
        • Product Portfolio
        • Profitability by Market Segments (Product/Age /Sales Channel/Region)
        • Sales Footprint
        • Strategy Overview
          • Marketing Strategy
          • Product Strategy
          • Channel Strategy
      • Nature’s Bakery
        • Overview
        • Product Portfolio
        • Profitability by Market Segments (Product/Age /Sales Channel/Region)
        • Sales Footprint
        • Strategy Overview
          • Marketing Strategy
          • Product Strategy
          • Channel Strategy
      • HIPPEAS
        • Overview
        • Product Portfolio
        • Profitability by Market Segments (Product/Age /Sales Channel/Region)
        • Sales Footprint
        • Strategy Overview
          • Marketing Strategy
          • Product Strategy
          • Channel Strategy
  22. Assumptions & Acronyms Used
  23. Research Methodology

List Of Table

  • Table 1: Global Market Value (USD Bn) Forecast by Region, 2020 to 2035
  • Table 2: Global Market Volume (Tons) Forecast by Region, 2020 to 2035
  • Table 3: Global Market Value (USD Bn) Forecast by Product Type, 2020 to 2035
  • Table 4: Global Market Volume (Tons) Forecast by Product Type, 2020 to 2035
  • Table 5: Global Market Value (USD Bn) Forecast by Ingredient, 2020 to 2035
  • Table 6: Global Market Volume (Tons) Forecast by Ingredient, 2020 to 2035
  • Table 7: Global Market Value (USD Bn) Forecast by Claim, 2020 to 2035
  • Table 8: Global Market Volume (Tons) Forecast by Claim, 2020 to 2035
  • Table 9: Global Market Value (USD Bn) Forecast by Consumer Group, 2020 to 2035
  • Table 10: Global Market Volume (Tons) Forecast by Consumer Group, 2020 to 2035
  • Table 11: Global Market Value (USD Bn) Forecast by Distribution Channel, 2020 to 2035
  • Table 12: Global Market Volume (Tons) Forecast by Distribution Channel, 2020 to 2035
  • Table 13: North America Market Value (USD Bn) Forecast by Country, 2020 to 2035
  • Table 14: North America Market Volume (Tons) Forecast by Country, 2020 to 2035
  • Table 15: North America Market Value (USD Bn) Forecast by Product Type, 2020 to 2035
  • Table 16: North America Market Volume (Tons) Forecast by Product Type, 2020 to 2035
  • Table 17: North America Market Value (USD Bn) Forecast by Ingredient, 2020 to 2035
  • Table 18: North America Market Volume (Tons) Forecast by Ingredient, 2020 to 2035
  • Table 19: North America Market Value (USD Bn) Forecast by Claim, 2020 to 2035
  • Table 20: North America Market Volume (Tons) Forecast by Claim, 2020 to 2035
  • Table 21: North America Market Value (USD Bn) Forecast by Consumer Group, 2020 to 2035
  • Table 22: North America Market Volume (Tons) Forecast by Consumer Group, 2020 to 2035
  • Table 23: North America Market Value (USD Bn) Forecast by Distribution Channel, 2020 to 2035
  • Table 24: North America Market Volume (Tons) Forecast by Distribution Channel, 2020 to 2035
  • Table 25: Latin America Market Value (USD Bn) Forecast by Country, 2020 to 2035
  • Table 26: Latin America Market Volume (Tons) Forecast by Country, 2020 to 2035
  • Table 27: Latin America Market Value (USD Bn) Forecast by Product Type, 2020 to 2035
  • Table 28: Latin America Market Volume (Tons) Forecast by Product Type, 2020 to 2035
  • Table 29: Latin America Market Value (USD Bn) Forecast by Ingredient, 2020 to 2035
  • Table 30: Latin America Market Volume (Tons) Forecast by Ingredient, 2020 to 2035
  • Table 31: Latin America Market Value (USD Bn) Forecast by Claim, 2020 to 2035
  • Table 32: Latin America Market Volume (Tons) Forecast by Claim, 2020 to 2035
  • Table 33: Latin America Market Value (USD Bn) Forecast by Consumer Group, 2020 to 2035
  • Table 34: Latin America Market Volume (Tons) Forecast by Consumer Group, 2020 to 2035
  • Table 35: Latin America Market Value (USD Bn) Forecast by Distribution Channel, 2020 to 2035
  • Table 36: Latin America Market Volume (Tons) Forecast by Distribution Channel, 2020 to 2035
  • Table 37: Europe Market Value (USD Bn) Forecast by Country, 2020 to 2035
  • Table 38: Europe Market Volume (Tons) Forecast by Country, 2020 to 2035
  • Table 39: Europe Market Value (USD Bn) Forecast by Product Type, 2020 to 2035
  • Table 40: Europe Market Volume (Tons) Forecast by Product Type, 2020 to 2035
  • Table 41: Europe Market Value (USD Bn) Forecast by Ingredient, 2020 to 2035
  • Table 42: Europe Market Volume (Tons) Forecast by Ingredient, 2020 to 2035
  • Table 43: Europe Market Value (USD Bn) Forecast by Claim, 2020 to 2035
  • Table 44: Europe Market Volume (Tons) Forecast by Claim, 2020 to 2035
  • Table 45: Europe Market Value (USD Bn) Forecast by Consumer Group, 2020 to 2035
  • Table 46: Europe Market Volume (Tons) Forecast by Consumer Group, 2020 to 2035
  • Table 47: Europe Market Value (USD Bn) Forecast by Distribution Channel, 2020 to 2035
  • Table 48: Europe Market Volume (Tons) Forecast by Distribution Channel, 2020 to 2035
  • Table 49: East Asia Market Value (USD Bn) Forecast by Country, 2020 to 2035
  • Table 50: East Asia Market Volume (Tons) Forecast by Country, 2020 to 2035
  • Table 51: East Asia Market Value (USD Bn) Forecast by Product Type, 2020 to 2035
  • Table 52: East Asia Market Volume (Tons) Forecast by Product Type, 2020 to 2035
  • Table 53: East Asia Market Value (USD Bn) Forecast by Ingredient, 2020 to 2035
  • Table 54: East Asia Market Volume (Tons) Forecast by Ingredient, 2020 to 2035
  • Table 55: East Asia Market Value (USD Bn) Forecast by Claim, 2020 to 2035
  • Table 56: East Asia Market Volume (Tons) Forecast by Claim, 2020 to 2035
  • Table 57: East Asia Market Value (USD Bn) Forecast by Consumer Group, 2020 to 2035
  • Table 58: East Asia Market Volume (Tons) Forecast by Consumer Group, 2020 to 2035
  • Table 59: East Asia Market Value (USD Bn) Forecast by Distribution Channel, 2020 to 2035
  • Table 60: East Asia Market Volume (Tons) Forecast by Distribution Channel, 2020 to 2035
  • Table 61: South Asia Market Value (USD Bn) Forecast by Country, 2020 to 2035
  • Table 62: South Asia Market Volume (Tons) Forecast by Country, 2020 to 2035
  • Table 63: South Asia Market Value (USD Bn) Forecast by Product Type, 2020 to 2035
  • Table 64: South Asia Market Volume (Tons) Forecast by Product Type, 2020 to 2035
  • Table 65: South Asia Market Value (USD Bn) Forecast by Ingredient, 2020 to 2035
  • Table 66: South Asia Market Volume (Tons) Forecast by Ingredient, 2020 to 2035
  • Table 67: South Asia Market Value (USD Bn) Forecast by Claim, 2020 to 2035
  • Table 68: South Asia Market Volume (Tons) Forecast by Claim, 2020 to 2035
  • Table 69: South Asia Market Value (USD Bn) Forecast by Consumer Group, 2020 to 2035
  • Table 70: South Asia Market Volume (Tons) Forecast by Consumer Group, 2020 to 2035
  • Table 71: South Asia Market Value (USD Bn) Forecast by Distribution Channel, 2020 to 2035
  • Table 72: South Asia Market Volume (Tons) Forecast by Distribution Channel, 2020 to 2035
  • Table 73: Oceania Market Value (USD Bn) Forecast by Country, 2020 to 2035
  • Table 74: Oceania Market Volume (Tons) Forecast by Country, 2020 to 2035
  • Table 75: Oceania Market Value (USD Bn) Forecast by Product Type, 2020 to 2035
  • Table 76: Oceania Market Volume (Tons) Forecast by Product Type, 2020 to 2035
  • Table 77: Oceania Market Value (USD Bn) Forecast by Ingredient, 2020 to 2035
  • Table 78: Oceania Market Volume (Tons) Forecast by Ingredient, 2020 to 2035
  • Table 79: Oceania Market Value (USD Bn) Forecast by Claim, 2020 to 2035
  • Table 80: Oceania Market Volume (Tons) Forecast by Claim, 2020 to 2035
  • Table 81: Oceania Market Value (USD Bn) Forecast by Consumer Group, 2020 to 2035
  • Table 82: Oceania Market Volume (Tons) Forecast by Consumer Group, 2020 to 2035
  • Table 83: Oceania Market Value (USD Bn) Forecast by Distribution Channel, 2020 to 2035
  • Table 84: Oceania Market Volume (Tons) Forecast by Distribution Channel, 2020 to 2035
  • Table 85: MEA Market Value (USD Bn) Forecast by Country, 2020 to 2035
  • Table 86: MEA Market Volume (Tons) Forecast by Country, 2020 to 2035
  • Table 87: MEA Market Value (USD Bn) Forecast by Product Type, 2020 to 2035
  • Table 88: MEA Market Volume (Tons) Forecast by Product Type, 2020 to 2035
  • Table 89: MEA Market Value (USD Bn) Forecast by Ingredient, 2020 to 2035
  • Table 90: MEA Market Volume (Tons) Forecast by Ingredient, 2020 to 2035
  • Table 91: MEA Market Value (USD Bn) Forecast by Claim, 2020 to 2035
  • Table 92: MEA Market Volume (Tons) Forecast by Claim, 2020 to 2035
  • Table 93: MEA Market Value (USD Bn) Forecast by Consumer Group, 2020 to 2035
  • Table 94: MEA Market Volume (Tons) Forecast by Consumer Group, 2020 to 2035
  • Table 95: MEA Market Value (USD Bn) Forecast by Distribution Channel, 2020 to 2035
  • Table 96: MEA Market Volume (Tons) Forecast by Distribution Channel, 2020 to 2035

List Of Figures

  • Figure 1: Global Market Volume (Tons) Forecast 2020 to 2035
  • Figure 2: Global Market Pricing Analysis
  • Figure 3: Global Market Value (USD Bn) Forecast 2020 to 2035
  • Figure 4: Global Market Value Share and BPS Analysis by Product Type, 2025 and 2035
  • Figure 5: Global Market Y-o-Y Growth Comparison by Product Type, 2025 to 2035
  • Figure 6: Global Market Attractiveness Analysis by Product Type
  • Figure 7: Global Market Value Share and BPS Analysis by Ingredient, 2025 and 2035
  • Figure 8: Global Market Y-o-Y Growth Comparison by Ingredient, 2025 to 2035
  • Figure 9: Global Market Attractiveness Analysis by Ingredient
  • Figure 10: Global Market Value Share and BPS Analysis by Claim, 2025 and 2035
  • Figure 11: Global Market Y-o-Y Growth Comparison by Claim, 2025 to 2035
  • Figure 12: Global Market Attractiveness Analysis by Claim
  • Figure 13: Global Market Value Share and BPS Analysis by Consumer Group, 2025 and 2035
  • Figure 14: Global Market Y-o-Y Growth Comparison by Consumer Group, 2025 to 2035
  • Figure 15: Global Market Attractiveness Analysis by Consumer Group
  • Figure 16: Global Market Value Share and BPS Analysis by Distribution Channel, 2025 and 2035
  • Figure 17: Global Market Y-o-Y Growth Comparison by Distribution Channel, 2025 to 2035
  • Figure 18: Global Market Attractiveness Analysis by Distribution Channel
  • Figure 19: Global Market Value (USD Bn) Share and BPS Analysis by Region, 2025 and 2035
  • Figure 20: Global Market Y-o-Y Growth Comparison by Region, 2025 to 2035
  • Figure 21: Global Market Attractiveness Analysis by Region
  • Figure 22: North America Market Incremental $ Opportunity, 2025 to 2035
  • Figure 23: Latin America Market Incremental $ Opportunity, 2025 to 2035
  • Figure 24: Europe Market Incremental $ Opportunity, 2025 to 2035
  • Figure 25: East Asia Market Incremental $ Opportunity, 2025 to 2035
  • Figure 26: South Asia Market Incremental $ Opportunity, 2025 to 2035
  • Figure 27: Oceania Market Incremental $ Opportunity, 2025 to 2035
  • Figure 28: MEA Market Incremental $ Opportunity, 2025 to 2035
  • Figure 29: North America Market Value Share and BPS Analysis by Country, 2025 and 2035
  • Figure 30: North America Market Value Share and BPS Analysis by Product Type, 2025 and 2035
  • Figure 31: North America Market Y-o-Y Growth Comparison by Product Type, 2025 to 2035
  • Figure 32: North America Market Attractiveness Analysis by Product Type
  • Figure 33: North America Market Value Share and BPS Analysis by Ingredient, 2025 and 2035
  • Figure 34: North America Market Y-o-Y Growth Comparison by Ingredient, 2025 to 2035
  • Figure 35: North America Market Attractiveness Analysis by Ingredient
  • Figure 36: North America Market Value Share and BPS Analysis by Claim, 2025 and 2035
  • Figure 37: North America Market Y-o-Y Growth Comparison by Claim, 2025 to 2035
  • Figure 38: North America Market Attractiveness Analysis by Claim
  • Figure 39: North America Market Value Share and BPS Analysis by Consumer Group, 2025 and 2035
  • Figure 40: North America Market Y-o-Y Growth Comparison by Consumer Group, 2025 to 2035
  • Figure 41: North America Market Attractiveness Analysis by Consumer Group
  • Figure 42: North America Market Value Share and BPS Analysis by Distribution Channel, 2025 and 2035
  • Figure 43: North America Market Y-o-Y Growth Comparison by Distribution Channel, 2025 to 2035
  • Figure 44: North America Market Attractiveness Analysis by Distribution Channel
  • Figure 45: Latin America Market Value Share and BPS Analysis by Country, 2025 and 2035
  • Figure 46: Latin America Market Value Share and BPS Analysis by Product Type, 2025 and 2035
  • Figure 47: Latin America Market Y-o-Y Growth Comparison by Product Type, 2025 to 2035
  • Figure 48: Latin America Market Attractiveness Analysis by Product Type
  • Figure 49: Latin America Market Value Share and BPS Analysis by Ingredient, 2025 and 2035
  • Figure 50: Latin America Market Y-o-Y Growth Comparison by Ingredient, 2025 to 2035
  • Figure 51: Latin America Market Attractiveness Analysis by Ingredient
  • Figure 52: Latin America Market Value Share and BPS Analysis by Claim, 2025 and 2035
  • Figure 53: Latin America Market Y-o-Y Growth Comparison by Claim, 2025 to 2035
  • Figure 54: Latin America Market Attractiveness Analysis by Claim
  • Figure 55: Latin America Market Value Share and BPS Analysis by Consumer Group, 2025 and 2035
  • Figure 56: Latin America Market Y-o-Y Growth Comparison by Consumer Group, 2025 to 2035
  • Figure 57: Latin America Market Attractiveness Analysis by Consumer Group
  • Figure 58: Latin America Market Value Share and BPS Analysis by Distribution Channel, 2025 and 2035
  • Figure 59: Latin America Market Y-o-Y Growth Comparison by Distribution Channel, 2025 to 2035
  • Figure 60: Latin America Market Attractiveness Analysis by Distribution Channel
  • Figure 61: Europe Market Value Share and BPS Analysis by Country, 2025 and 2035
  • Figure 62: Europe Market Value Share and BPS Analysis by Product Type, 2025 and 2035
  • Figure 63: Europe Market Y-o-Y Growth Comparison by Product Type, 2025 to 2035
  • Figure 64: Europe Market Attractiveness Analysis by Product Type
  • Figure 65: Europe Market Value Share and BPS Analysis by Ingredient, 2025 and 2035
  • Figure 66: Europe Market Y-o-Y Growth Comparison by Ingredient, 2025 to 2035
  • Figure 67: Europe Market Attractiveness Analysis by Ingredient
  • Figure 68: Europe Market Value Share and BPS Analysis by Claim, 2025 and 2035
  • Figure 69: Europe Market Y-o-Y Growth Comparison by Claim, 2025 to 2035
  • Figure 70: Europe Market Attractiveness Analysis by Claim
  • Figure 71: Europe Market Value Share and BPS Analysis by Consumer Group, 2025 and 2035
  • Figure 72: Europe Market Y-o-Y Growth Comparison by Consumer Group, 2025 to 2035
  • Figure 73: Europe Market Attractiveness Analysis by Consumer Group
  • Figure 74: Europe Market Value Share and BPS Analysis by Distribution Channel, 2025 and 2035
  • Figure 75: Europe Market Y-o-Y Growth Comparison by Distribution Channel, 2025 to 2035
  • Figure 76: Europe Market Attractiveness Analysis by Distribution Channel
  • Figure 77: East Asia Market Value Share and BPS Analysis by Country, 2025 and 2035
  • Figure 78: East Asia Market Value Share and BPS Analysis by Product Type, 2025 and 2035
  • Figure 79: East Asia Market Y-o-Y Growth Comparison by Product Type, 2025 to 2035
  • Figure 80: East Asia Market Attractiveness Analysis by Product Type
  • Figure 81: East Asia Market Value Share and BPS Analysis by Ingredient, 2025 and 2035
  • Figure 82: East Asia Market Y-o-Y Growth Comparison by Ingredient, 2025 to 2035
  • Figure 83: East Asia Market Attractiveness Analysis by Ingredient
  • Figure 84: East Asia Market Value Share and BPS Analysis by Claim, 2025 and 2035
  • Figure 85: East Asia Market Y-o-Y Growth Comparison by Claim, 2025 to 2035
  • Figure 86: East Asia Market Attractiveness Analysis by Claim
  • Figure 87: East Asia Market Value Share and BPS Analysis by Consumer Group, 2025 and 2035
  • Figure 88: East Asia Market Y-o-Y Growth Comparison by Consumer Group, 2025 to 2035
  • Figure 89: East Asia Market Attractiveness Analysis by Consumer Group
  • Figure 90: East Asia Market Value Share and BPS Analysis by Distribution Channel, 2025 and 2035
  • Figure 91: East Asia Market Y-o-Y Growth Comparison by Distribution Channel, 2025 to 2035
  • Figure 92: East Asia Market Attractiveness Analysis by Distribution Channel
  • Figure 93: South Asia Market Value Share and BPS Analysis by Country, 2025 and 2035
  • Figure 94: South Asia Market Value Share and BPS Analysis by Product Type, 2025 and 2035
  • Figure 95: South Asia Market Y-o-Y Growth Comparison by Product Type, 2025 to 2035
  • Figure 96: South Asia Market Attractiveness Analysis by Product Type
  • Figure 97: South Asia Market Value Share and BPS Analysis by Ingredient, 2025 and 2035
  • Figure 98: South Asia Market Y-o-Y Growth Comparison by Ingredient, 2025 to 2035
  • Figure 99: South Asia Market Attractiveness Analysis by Ingredient
  • Figure 100: South Asia Market Value Share and BPS Analysis by Claim, 2025 and 2035
  • Figure 101: South Asia Market Y-o-Y Growth Comparison by Claim, 2025 to 2035
  • Figure 102: South Asia Market Attractiveness Analysis by Claim
  • Figure 103: South Asia Market Value Share and BPS Analysis by Consumer Group, 2025 and 2035
  • Figure 104: South Asia Market Y-o-Y Growth Comparison by Consumer Group, 2025 to 2035
  • Figure 105: South Asia Market Attractiveness Analysis by Consumer Group
  • Figure 106: South Asia Market Value Share and BPS Analysis by Distribution Channel, 2025 and 2035
  • Figure 107: South Asia Market Y-o-Y Growth Comparison by Distribution Channel, 2025 to 2035
  • Figure 108: South Asia Market Attractiveness Analysis by Distribution Channel
  • Figure 109: Oceania Market Value Share and BPS Analysis by Country, 2025 and 2035
  • Figure 110: Oceania Market Value Share and BPS Analysis by Product Type, 2025 and 2035
  • Figure 111: Oceania Market Y-o-Y Growth Comparison by Product Type, 2025 to 2035
  • Figure 112: Oceania Market Attractiveness Analysis by Product Type
  • Figure 113: Oceania Market Value Share and BPS Analysis by Ingredient, 2025 and 2035
  • Figure 114: Oceania Market Y-o-Y Growth Comparison by Ingredient, 2025 to 2035
  • Figure 115: Oceania Market Attractiveness Analysis by Ingredient
  • Figure 116: Oceania Market Value Share and BPS Analysis by Claim, 2025 and 2035
  • Figure 117: Oceania Market Y-o-Y Growth Comparison by Claim, 2025 to 2035
  • Figure 118: Oceania Market Attractiveness Analysis by Claim
  • Figure 119: Oceania Market Value Share and BPS Analysis by Consumer Group, 2025 and 2035
  • Figure 120: Oceania Market Y-o-Y Growth Comparison by Consumer Group, 2025 to 2035
  • Figure 121: Oceania Market Attractiveness Analysis by Consumer Group
  • Figure 122: Oceania Market Value Share and BPS Analysis by Distribution Channel, 2025 and 2035
  • Figure 123: Oceania Market Y-o-Y Growth Comparison by Distribution Channel, 2025 to 2035
  • Figure 124: Oceania Market Attractiveness Analysis by Distribution Channel
  • Figure 125: MEA Market Value Share and BPS Analysis by Country, 2025 and 2035
  • Figure 126: MEA Market Value Share and BPS Analysis by Product Type, 2025 and 2035
  • Figure 127: MEA Market Y-o-Y Growth Comparison by Product Type, 2025 to 2035
  • Figure 128: MEA Market Attractiveness Analysis by Product Type
  • Figure 129: MEA Market Value Share and BPS Analysis by Ingredient, 2025 and 2035
  • Figure 130: MEA Market Y-o-Y Growth Comparison by Ingredient, 2025 to 2035
  • Figure 131: MEA Market Attractiveness Analysis by Ingredient
  • Figure 132: MEA Market Value Share and BPS Analysis by Claim, 2025 and 2035
  • Figure 133: MEA Market Y-o-Y Growth Comparison by Claim, 2025 to 2035
  • Figure 134: MEA Market Attractiveness Analysis by Claim
  • Figure 135: MEA Market Value Share and BPS Analysis by Consumer Group, 2025 and 2035
  • Figure 136: MEA Market Y-o-Y Growth Comparison by Consumer Group, 2025 to 2035
  • Figure 137: MEA Market Attractiveness Analysis by Consumer Group
  • Figure 138: MEA Market Value Share and BPS Analysis by Distribution Channel, 2025 and 2035
  • Figure 139: MEA Market Y-o-Y Growth Comparison by Distribution Channel, 2025 to 2035
  • Figure 140: MEA Market Attractiveness Analysis by Distribution Channel
  • Figure 141: Global Market - Tier Structure Analysis
  • Figure 142: Global Market - Company Share Analysis

- FAQs -

What was the Global Better-for-you Snacks Market Size Reported by Fact.MR for 2024?

The global Better-for-you Snacks Market was valued at USD 32.7 Billion in 2024.

Who are the Major Players Operating in the Better-for-you Snacks Market?

Prominent players in the market are General Mills, PepsiCo, Nestlé, Kellogg’s, The Hain Celestial Group, Mondelēz International, Kind LLC, Clif Bar & Company, Nature’s Bakery, HIPPEAS.

What is the Estimated Valuation of the Better-for-you Snacks Market in 2035?

The market is expected to reach a valuation of USD 70.3 Billion in 2035.

What Value CAGR did the Better-for-you Snacks Market Exhibit Over the Last Five Years?

The historic growth rate of the Better-for-you Snacks Market was 6.7% from 2020 to 2024.

- Also of Interest -

Snacks Market

Snacks Market Analysis By Product Type (Nuts & Seeds, Cookies & Biscuits, Meat Snacks, Cereal Bars, Salty Snacks), By Nature (Organic, Conventional), By Source (Wheat, Maize, Rye, Rice, Fruits & Vegetables, Meat), By Sales Channel & Region - Global Market Insights 2023 to 2033

Jerky Snacks Market

Jerky Snacks Market Analysis, By Product (Beef, Pork, Poultry, Others), By Distribution Channel (Offline, Online), and Region – Global Market Insights 2023 to 2033

Fruit Snacks Market

Fruit Snacks Market Study by Sweets & Savories, Dairy Products, and Beverages Sold through Modern Trade, Specialty Stores, Convenience Stores, and Online Stores from 2023 to 2033

Functional Snacks Market

Functional Snacks Market Analysis, By Product Type, By Functional Ingredient, By Packaging Type, By Consumer Demographics, By Application, By Distribution Channel, and Region - Market Insights 2025 to 2035

Better-for-you Snacks Market

Schedule a Call