- Market Value (2025): USD 1.29 Bn
- Estimated Value (2026): USD 1.44 Bn
- Forecast Value (2036): USD 4.41 Bn
- CAGR (2026-2036): 11.8%
What is the Bio-Based Ethylene Market forecast to be worth by 2036?
USD 1.4 billion in 2026 to USD 4.4 billion by 2036, with an 11.8% reported CAGR.
- According to Fact.MR analysis, the bio-based ethylene market stood at USD 1.29 billion in 2025.
- Global sales are forecast to rise from USD 1.44 billion in 2026 to USD 4.41 billion by 2036 as resin producers extend renewable feedstock choices.
- An 11.8% CAGR over 2026 to 2036 reflects investment in ethanol-to-ethylene conversion and industrial demand for traceable renewable carbon.
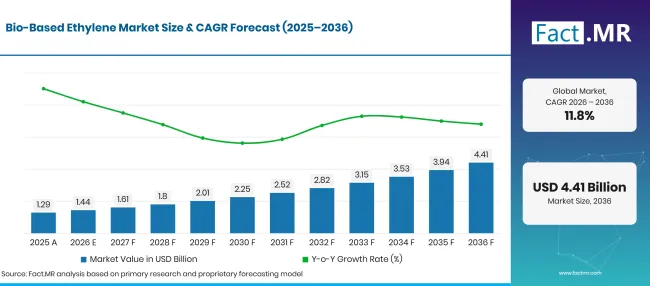
Bio Based Ethylene Market Forecast Global | Source: Fact.MR
| Year | Basis | Market Value (USD billion) |
|---|---|---|
| 2025 | Actual | 1.29 |
| 2026 | Estimate | 1.44 |
| 2036 | Forecast | 4.41 |
| CAGR 2026 to 2036 | Forecast period | 11.8% |
Source: Fact.MR analysis. Updated Nov 9, 2026
What are the defining numbers behind Bio-Based Ethylene Market growth?
The projected increase is USD 3.0 billion between 2026 and 2036.
- Demand Drivers in the Market
- Packaging producers can use renewable polyethylene in extrusion and molding operations that already handle comparable conventional grades. They still need to check resin performance and confirm the renewable origin of the feedstock before approving a material for commercial packaging.
- Chemical manufacturers need reliable ethanol volumes before financing dehydration units.
- Packaging Planners increasingly assess material choice alongside recycling obligations. The European Commission confirmed in June 2026 that Regulation (EU) 2025/40 applies from August 2026 [2].
- Chemical producers are assessing renewable carbon routes that can use established manufacturing equipment. Ethanol dehydration creates ethylene suitable for conversion to polyethylene and downstream intermediates. Contract terms for ethanol and steady plant utilization are central to the business case.
- Key Segments Analyzed
- By Feedstock: Sugarcane accounts for 55.0% of the 2026 market, reflecting the established link between cane ethanol and commercial renewable ethylene production.
- By Application: Packaging represents 42.3% of 2026 sales because renewable polyethylene can be used in familiar plastic packaging formats.
- By End-User Industry: Automotive contributes 30.0% of 2026 market value in the segmentation, reflecting interest in renewable chemical inputs for polymer-based components.
- Analyst Opinion at Fact.MR
- Shambhu Nath Jha, Principal Consultant at Fact.MR, states, “Bio-based ethylene producers need dependable ethanol supply at a competitive delivered cost. The finished ethylene molecule has the same chemical properties as conventional ethylene, but customers also want reliable evidence of renewable carbon origin.”
- Strategic Implications
- Ethanol producers can separate multiyear chemical-grade supply agreements from transport-fuel business because delivery terms and pricing structures differ.
- Ethylene project developers need to compare dehydration plant utilization with seasonal feedstock availability and ethanol transport costs to chemical sites.
- Resin makers benefit from documenting renewable feedstock origin while maintaining the performance specifications converters already require.
- Packaging buyers can assess renewable-carbon credentials together with recyclability requirements and the performance demands of the finished package.
Germany is forecast to grow at 12.9% CAGR, reflecting demand for renewable chemical options in its established industrial base. Brazil follows at 11.8% through its sugarcane-to-ethanol system. The USA is forecast at 10.6% as corn ethanol offers a possible conversion route. The UK records 9.5% amid packaging compliance changes, while Japan reaches 8.4% as brand owners test renewable polymer inputs.
How does the Bio-Based Ethylene Market break down by segment?
Sugarcane leads Feedstock with 55.0%; Packaging leads Application with 42.3%; Automotive leads End-User Industry with 30.0%.
Which feedstock leads bio-based ethylene production?
Sugarcane is estimated to represent 55.0% of feedstock value in 2026.
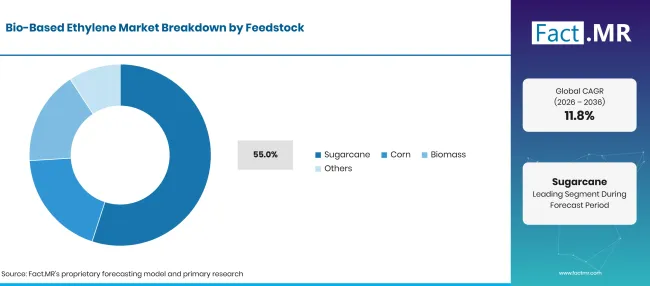
Bio Based Ethylene Market Breakdown Feedstock | Source: Fact.MR
| Feedstock | Share (2026) |
|---|---|
| Sugarcane (Leading segment) | 55.0% |
| Other segments combined | 45.0% |
| Total | 100.0% |
Source: Fact.MR analysis. Updated Nov 9, 2026
Sugarcane ethanol provides a practical starting material for industrial ethylene dehydration. Producers first make ethanol from fermentable sugar and then remove water chemically to obtain ethylene. Braskem’s commercial Brazilian operation anchors the established production route. Corn offers another ethanol source and is relevant in the United States, where the farming and fuel-ethanol systems already operate at scale. Biomass routes may use crop residues or other organic inputs, although treatment and conversion needs depend on the material. The remaining category covers other renewable sources. Supply contracts and plant location influence the delivered feedstock price. Sugarcane also supplies fiber-based product chains.
How do applications shape sales?
Packaging accounts for 42.3% of the application segment in 2026.
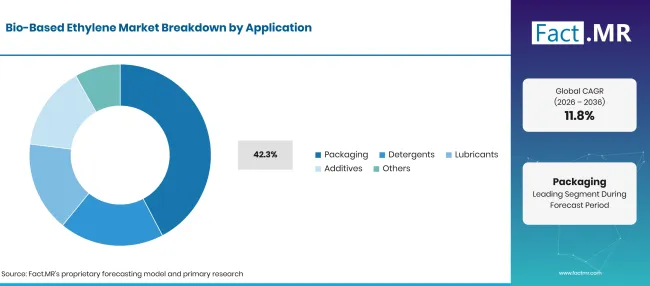
Bio Based Ethylene Market Breakdown Application | Source: Fact.MR
| Application | Share (2026) |
|---|---|
| Packaging (Leading segment) | 42.3% |
| Other segments combined | 57.7% |
| Total | 100.0% |
Source: Fact.MR analysis. Updated Nov 9, 2026
Packaging manufacturers value renewable polyethylene because they can process it in applications that already use compatible polyethylene grades. Film and rigid packaging buyers assess seal strength and handling alongside renewable-content claims. Detergents form another application route where ethylene-derived chemistry enters surfactant and related production chains, subject to the specific conversion process. Lubricants and additives use ethylene-based intermediates in different chemical steps. Each application has its own quality specifications. Packaging firms benefit from familiar polymer chemistry. Converters also assess alternative bio-based packaging polymers. Packaging teams compare those specifications with other bio-based polymers.
What determines demand across end-user industries?
Automotive leads with 30.0% of the 2026 end-user industry segment.
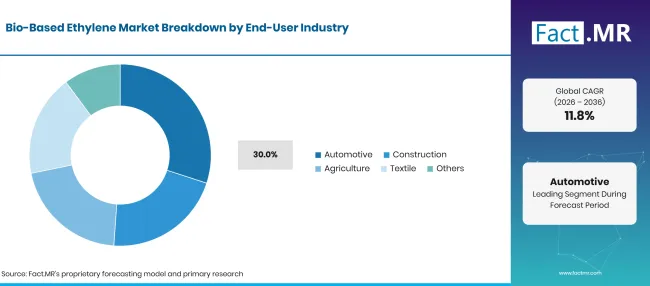
Bio Based Ethylene Market Breakdown End User Industry | Source: Fact.MR
| End-User Industry | Share (2026) |
|---|---|
| Automotive (Leading segment) | 30.0% |
| Other segments combined | 70.0% |
| Total | 100.0% |
Source: Fact.MR analysis. Updated Nov 9, 2026
Automotive material teams assess renewable inputs within established resin specifications for interior and other polymer components. Approval depends on strength and dimensional behavior under the intended operating conditions. Construction users consider films or other polyethylene-derived products where renewable carbon can be traced. Agricultural applications include film products that still need appropriate mechanical properties and end-of-life management. Textile uses depend on the particular ethylene derivative and manufacturing process. Across these end users, purchase decisions depend on stable resin quality and documented origin, while finished-product suitability remains a separate test. Polymer buyers may compare other bio-based plastic grades.
What is accelerating Bio-Based Ethylene Market adoption, and what is holding it back?
Demand is supported by access to ethanol and the ability to use renewable ethylene in established polymer processes. The price of feedstock, qualification work and the capital required for new conversion plants influence the pace of investment.
Drivers Impact Analysis
| Driver | (~) % IMPACT ON CAGR | Geographic Relevance | Impact Timeline |
|---|---|---|---|
| Feedstock integration at ethanol sites | +1.2% | Brazil, North America | Medium term (2–4 years) |
| Compatibility with polyethylene conversion | +1.0% | Global | Short term (≤2 years) |
| Packaging renewable-content programs | +0.8% | Europe, Japan | Medium term (2–4 years) |
| New ethanol dehydration projects | +0.6% | Asia, Latin America | Long term (≥4 years) |
| Contracted feedstock traceability | +0.4% | Global | Medium term (2–4 years) |
Source: Fact.MR analysis. Updated Nov 9, 2026
Opportunity Impact Analysis
| Opportunity | (~) % IMPACT ON CAGR | Geographic Relevance | Impact Timeline |
|---|---|---|---|
| Additional cane-to-ethylene capacity | +0.7% | Latin America, Asia | Long term (≥4 years) |
| Renewable polyethylene packaging | +0.6% | Europe, North America | Medium term (2–4 years) |
| Corn-ethanol chemical conversion | +0.4% | USA | Long term (≥4 years) |
| Certified feedstock traceability | +0.3% | Global | Short term (≤2 years) |
Source: Fact.MR analysis. Updated Nov 9, 2026
Restraints Impact Analysis
| Restraint | (~) % IMPACT ON CAGR | Geographic Relevance | Impact Timeline |
|---|---|---|---|
| Ethanol price and competing uses | -0.9% | Brazil, USA | Short term (≤2 years) |
| Large initial chemical-plant investment | -0.7% | Global | Long term (≥4 years) |
| Resin qualification and traceability cost | -0.5% | Europe, Japan | Medium term (2–4 years) |
| Weak chemicals plant utilization | -0.4% | Germany, Europe | Short term (≤2 years) |
Source: Fact.MR analysis. Updated Nov 9, 2026
Which countries are scaling the Bio-Based Ethylene Market through 2036?
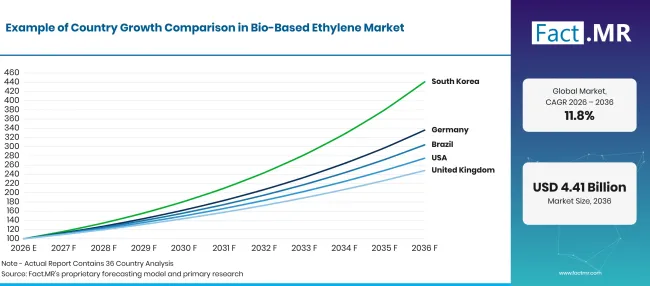
Bio Based Ethylene Market Growth Index | Source: Fact.MR
| Country | CAGR (2026 to 2036) |
|---|---|
| Germany | 12.9% |
| Brazil | 11.8% |
| USA | 10.6% |
| UK | 9.5% |
| Japan | 8.4% |
Source: Fact.MR analysis. Updated Nov 9, 2026
What supports Germany bio-based ethylene adoption?
12.9% CAGR, linked to industrial resin qualification and renewable chemical sourcing.
German chemical groups are assessing renewable ethylene as an input that can enter established polyethylene production chains. In July 2026, the German Chemical Industry Association (VCI) reported that first-half chemical and pharmaceutical production was around 3% below the previous year [7]. Investment choices remain sensitive to plant operating conditions. VCI reported in March 2026 that German chemicals plants averaged 72.5% capacity utilization during 2025 [4].
What supports Brazil bio-based ethylene adoption?
11.8% CAGR, supported by sugarcane ethanol and an operating green ethylene complex.
Brazil connects sugarcane farming with commercial production of renewable ethylene. In August 2026, Companhia Nacional de Abastecimento estimated 705.2 million tonnes of sugarcane for the 2026/27 harvest [1]. The agricultural supply base provides a route to ethanol that chemical plants can convert into ethylene. In May 2025, Braskem confirmed an annual capacity of 275,000 tonnes at its Triunfo green ethylene plant [3].
What supports USA bio-based ethylene adoption?
10.6% CAGR, reflecting corn ethanol availability and downstream polymer demand.
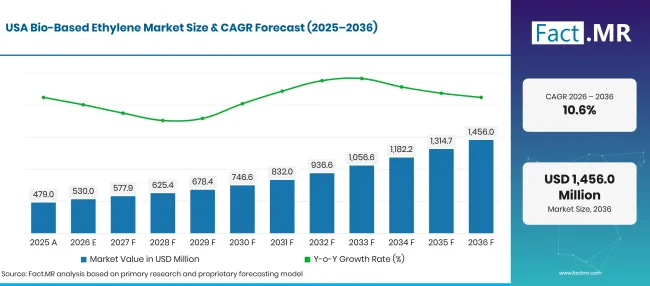
Bio Based Ethylene Market Forecast Usa | Source: Fact.MR
US corn-based ethanol production offers an established route for developing renewable ethylene feedstock. In October 2026, the US Energy Information Administration published updated fuel ethanol production capacity data [5]. Chemical developers can examine whether ethanol from existing supply networks meets the specifications needed for dehydration into ethylene. The domestic polyethylene manufacturing base provides potential industrial customers familiar with film extrusion and polymer testing.
What supports UK bio-based ethylene adoption?
9.5% CAGR, influenced by packaging economics and renewable resin sourcing.
UK manufacturers are approaching bio-based ethylene mainly through renewable polyethylene purchased for packaging. In September 2026, the Department for Environment, Food and Rural Affairs published updated national packaging waste statistics [6]. Packaging converters can evaluate bio-based grades for films and rigid formats using the same functional tests applied to conventional polyethylene.
What supports Japan bio-based ethylene adoption?
8.4% CAGR, associated with material qualification and selective renewable-carbon use.
Japanese manufacturers are evaluating renewable ethylene derivatives where product quality and documented material origin can be checked against existing requirements. Packaging companies can assess suitable bio-based polyethylene grades on familiar converting equipment. Consumer goods manufacturers may request information on renewable carbon content before approving materials. Japan also offers established technical distribution channels through which overseas producers can explain polymer grade selection and testing procedures.
Who leads the Bio-Based Ethylene Market?
Braskem operates commercial sugarcane-derived ethylene production for bio-based polyethylene.
SCG Chemicals is developing a related production route through Braskem Siam, while other chemical groups participate in adjacent renewable feedstock and polymer activities. The competitive distinction lies in whether a company operates bio-ethylene capacity, develops a dedicated project, or supplies a related chemical product
Which companies are the key providers?
Key companies include Braskem S.A.; SCG Chemicals Public Company Limited; Dow Inc.; LyondellBasell Industries N.V.; SABIC; INEOS Group Holdings S.A.; Shell plc; BASF SE; New Energy Blue / New Energy Chemicals; India Glycols Limited.
- Braskem S.A.
- SCG Chemicals Public Company Limited
- Dow Inc.
- LyondellBasell Industries N.V.
- SABIC
- INEOS Group Holdings S.A.
- Shell plc
- BASF SE
- New Energy Blue / New Energy Chemicals
- India Glycols Limited
Bibliography
- [1] Companhia Nacional de Abastecimento. (2026, August 20). Nova estimativa de cana-de-açúcar traz produção de 705,2 milhões de toneladas na safra 2026/27.
- [2] European Commission. (2026, June 10). Guidance document for Regulation (EU) 2025/40 on packaging and packaging waste.
- [3] Braskem. (2025, May 6). Celebrating 15 years of I’m green™ bio-based with operation rates above nameplate capacity after expansion.
- [4] Statistisches Bundesamt (Destatis). (2026, February 6). Production in December 2025: -1.9% on the previous month.
- [5] U.S. Energy Information Administration. (2026, October 30). U.S. fuel ethanol production capacity.
- [6] Department for Environment, Food & Rural Affairs. (2026, September 23). UK statistics on waste.
- [7] Statistisches Bundesamt (Destatis). (2026, August 25). Gross domestic product: Detailed results on economic performance in the second quarter of 2026.
This Report Answers
- The analysis explains how sugarcane, corn and other biomass feedstocks enter the renewable ethylene production chain.
- Application coverage distinguishes packaging demand from other chemical uses of ethylene-derived intermediates.
- Country analysis examines agricultural supply, conversion capacity and downstream material qualification in five markets.
- The competitive review separates operating bio-ethylene capacity from broader renewable-material and petrochemical activity.
What does the Bio-Based Ethylene Market cover?
The report covers bio-based ethylene made using renewable biological carbon. It examines feedstock availability and conversion economics alongside uses of renewable ethylene in downstream chemicals and polymers. Market value follows the renewable ethylene boundary, not every finished product that contains an ethylene derivative.
What is included in the scope?
Sugarcane ethanol and corn ethanol are included where they serve as feedstock for renewable ethylene production.
Biomass routes are included when they can lead to ethylene through appropriate chemical steps. Applications cover packaging and selected industrial chemistry uses.
What is excluded from the scope?
Conventional fossil ethylene is outside this market unless a separately documented renewable feedstock allocation applies.
Ethanol sold only as transport fuel is excluded. Finished polyethylene, detergents and other products are not counted as additional ethylene revenue, so the same renewable carbon is not recorded repeatedly across the chemical chain.
How Was the Analysis Built?
The analysis draws on 120+ sources, 35+ company portfolios, 25+ countries, and more than 20 industry interviews.
- Primary Research: Primary research includes discussions with manufacturers, service providers, technology developers, distributors, end users, and subject-matter experts. These conversations examine purchasing priorities, product adoption, operational challenges, approval requirements, competitive positioning, and the factors that influence wider market acceptance.
- Desk Research: Desk research covers government statistics, regulatory publications, company filings, trade data, technical studies, industry associations, standards, public policy, and other authoritative sources. Every source used in the analysis is documented in the bibliography.
- Market Sizing and Forecasting: Market estimates combine historical performance, demand indicators, pricing and volume trends, segment shares, company participation, country-level growth, adoption patterns, investment activity, and barriers to market expansion.
- Data Validation and Update Cycle: Findings are validated by comparing primary interviews with public data, company activity, regulatory changes, trade patterns, and industry developments. Regular updates review new product launches, capacity changes, partnerships, approvals, and shifts in commercial adoption.
Segmentation
What is the report’s scope and coverage?
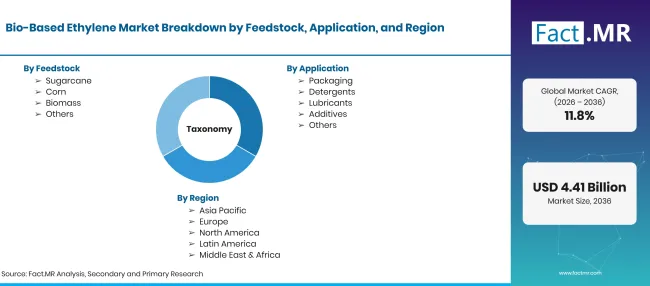
Bio Based Ethylene Market Taxonomy | Source: Fact.MR
| Attribute | Details |
|---|---|
| Quantitative Units | USD billion |
| Market Definition | Ethylene obtained from renewable biological feedstocks via ethanol conversion or other established renewable routes; downstream uses attributed to the renewable ethylene input. |
| Feedstock | Sugarcane; Corn; Biomass; Others |
| Application | Packaging; Detergents; Lubricants; Additives; Others |
| End-User Industry | Automotive; Construction; Agriculture; Textile; Others |
| Regions Covered | North America; Latin America; Western Europe; Eastern Europe; East Asia; South Asia & Pacific; Middle East & Africa |
| Countries Covered | Germany; Brazil; USA; UK; Japan |
| Companies Profiled | Braskem S.A.; SCG Chemicals Public Company Limited; Dow Inc.; LyondellBasell Industries N.V.; SABIC; INEOS Group Holdings S.A.; Shell plc; BASF SE; New Energy Blue / New Energy Chemicals; India Glycols Limited. |
| Forecast Period | 2026 to 2036 |
| Approach | Market valuation paired with feedstock, polymer use, facility evidence and country-specific growth analysis. |
Source: Fact.MR analysis. Updated Nov 9, 2026
How is the market segmented?
-
By Feedstock
- Sugarcane
- Corn
- Biomass
- Others
-
By Application
- Packaging
- Detergents
- Lubricants
- Additives
- Others
-
By End-User Industry
- Automotive
- Construction
- Agriculture
- Textile
- Others
-
By Region
- North America
- Latin America
- Western Europe
- Eastern Europe
- East Asia
- South Asia & Pacific
- Middle East & Africa
Frequently Asked Questions
How large is the bio-based ethylene market in 2026?
What is the CAGR for 2026 to 2036?
Which feedstock accounts for the greatest share?
Which application holds the largest share?
Which end-user industry leads?
Which country records the highest forecast CAGR?
Who are the main companies in the Bio-Based Ethylene Market?
Who worked on this report


Preview the report firsthand - request a free sample
Free SampleGet the brochure for pricing and purchase details
Download PDF