Botanical Brain Concentrate Market Size, Share, Growth and Forecast (2026 - 2036)

Botanical Brain Concentrate Market is segmented by Ingredient Type, by Product Form, by Consumer Need/Function, by Positioning/Label Claims, by Consumer Demographic, by Distribution Channel, and by Region. Forecast for 2026 to 2036.

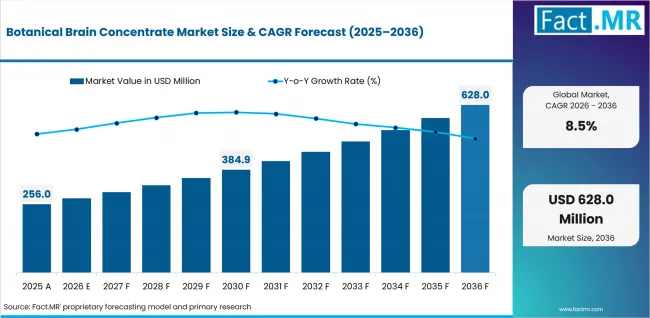
According to market estimates, the botanical brain concentrate market stood at USD 256.0 million in 2025 and is projected to reach USD 277.8 million in 2026 and USD 628.0 million by 2036, registering a CAGR of 8.5% during the forecast period. By Ingredient Type, Herbal Botanicals are expected to dominate the market with a 36.7% share in 2026, driven by increasing consumer preference for natural cognitive wellness products and the growing adoption of botanical ingredients such as Bacopa Monnieri, Ginkgo Biloba, and Rosemary in nootropic supplements and functional wellness formulations.
Botanical Brain Concentrate Market Overview, Growth Outlook, and Forecast by Fact.MR

  • In 2025, the botanical brain concentrate market was valued at USD 256.0 million.
  • Demand for botanical brain concentrate products is projected to grow to USD 277.8 million in 2026 and reach USD 628.0 million by 2036.
  • The market is expected to expand at a CAGR of 8.5% during the forecast period.

Botanical Brain Concentrate Market Value Analysis

Summary of the Botanical Brain Concentrate Market

  • Market Snapshot
    • Global botanical brain concentrate market revenue stood at USD 277.8 million in 2026 and is forecast to reach USD 628.0 million by 2036.
    • At an 8.5% CAGR from 2026 to 2036, the market is expected to expand ~2.3x in value, creating an absolute dollar opportunity of USD 350.2 million.
    • The growth of the market is attributed to factors such as growing consumer inclination for natural cognitive wellness products, increasing focus on productivity enhancement, and higher adoption of botanical nootropics and medicinal mushrooms.
    • Rising preponderance of clean-label supplements, adaptogenic based formulations, and plant-based brain health-based solutions is driving the demand in developed and developing regions.
    • The development of e-commerce wellness platforms, high-end nootropic brands and functional beverage products is also promoting the demand globally.
  • Demand and Growth Drivers
    • Increasing incidence of stress, mental exhaustion, and attention-related lifestyle problems
    • Growing demand from consumers for natural cognitive enhancement products over artificial stimulants
    • More widespread use of medicinal mushrooms like Lion’s Mane and adaptogens like Ashwagandha and Rhodiola
    • Liquid nootropic concentrate, gummy, and functional beverage segments are rapidly gaining traction
    • Rising awareness about preventive cognitive wellness and holistic brain health solutions
    • Penetration of direct-to-consumer wellness brands and digital supplement platforms
    • Need for solutions providing:
    • Enhanced focus and productivity
    • Memory and cognitive support
    • Stress resilience and mental clarity
    • Natural mental-energy support
    • Clean-label and plant-based formulations
  • Product and Segment View
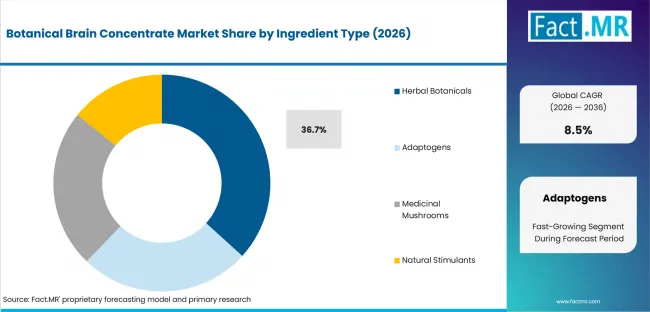
    • Herbal Botanicals account for 36.72% of ingredient type share in 2026, supported by strong demand for botanical cognitive-support ingredients such as Bacopa Monnieri, Ginkgo Biloba, and Rosemary.
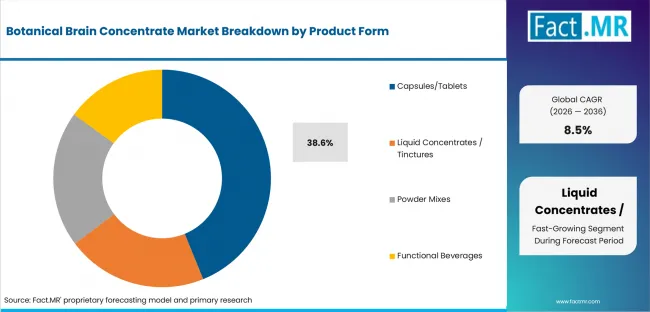
    • Capsules/Tablets hold 38.64% of product form share in 2026, driven by convenience, dosage consistency, and broad retail availability.
    • Focus & Productivity accounts for 34.92% of consumer need/function share in 2026, supported by increasing demand from professionals, students, and performance-focused consumers.
  • Geography and Competitive Outlook
    • Rising adoption of natural nootropics, increasing awareness regarding cognitive wellness, and growing demand for herbal brain-support supplements are driving strong market growth across North America, East Asia, and South Asia & Pacific.
    • Major growth markets in the Botanical Brain Concentrate Market include Japan (10.7% CAGR), China (10.4% CAGR), Canada (9.4% CAGR), United States (7.6% CAGR), United Kingdom (7.5% CAGR), Germany (6.9% CAGR), and India (5.7% CAGR) during the forecast period.
    • Market growth is supported by:
      • Increasing consumer spending on cognitive wellness products
      • Growing popularity of medicinal mushrooms and adaptogens
      • Rising clean-label and plant-based supplement demand
      • Expansion of premium nootropic and functional beverage categories
      • Increasing adoption of DTC supplement business models
    • Prominent players in the market include Mind Lab Pro, Qualia, Onnit, Four Sigmatic, Host Defense, Gaia Herbs, NooCube, Finzelberg, Alicanto Biotech, Mac Biosciences, and Phytologix Lifesciences.
  • Analyst Opinion
    • Shambhu Nath Jha, Principal Consultant at Fact.MR, opines, “CXO leaders should anticipate that Botanical Brain Concentrate market competitive dynamics will increasingly be defined by the development of clinically substantiated botanical nootropic formulations, broadening medicinal mushroom and adaptogenic-based product offerings, capitalizing on clean-label and plant-based cognitive wellness trends, and boosting direct-to-consumer and digital wellness distribution channels to capture an expanding global market for enhanced focus, mental clarity, stress resilience, and preventive brain health care.

Botanical Brain Concentrate Market — At a Glance

Attribute Details
Market Value 2025 USD 256.0 Million
Market Value 2026 USD 277.8 Million
Market Value 2036 USD 628.0 Million
Absolute Dollar Opportunity USD 350.2 Million
Total Growth 126.06%
CAGR 8.50%
Growth Multiple 2.3x
Key Demand Theme Rising consumer demand for natural cognitive wellness products, increasing adoption of botanical nootropics and medicinal mushrooms, growing preference for clean-label and plant-based supplements, expansion of functional wellness beverages, and increasing focus on productivity enhancement and preventive brain health
Leading Ingredient Type Herbal Botanicals
Ingredient Type Share 36.7%
Leading Product Form Capsules/Tablets
Product Form Share 38.6%
Leading Consumer Need / Function Focus & Productivity
Consumer Need / Function Share 34.9%
Leading Positioning / Label Claim Organic / Clean Label
Positioning Share 30.8%
Leading Consumer Demographic Working Professionals
Consumer Demographic Share 41.6%
Leading Distribution Channel E-commerce / DTC
Distribution Channel Share 39.6%
Key Growth Regions North America, East Asia, South Asia & Pacific
Key Companies Mind Lab Pro, Qualia, Onnit, Four Sigmatic, Host Defense, Gaia Herbs, NooCube, Finzelberg, Alicanto Biotech, Mac Biosciences, Phytologix Lifesciences
Segmentation by Ingredient Type Herbal Botanicals, Adaptogens, Medicinal Mushrooms, Natural Stimulants
Segmentation by Product Form Capsules/Tablets, Powder Mixes, Liquid Concentrates/Tinctures, Gummies, Functional Beverages
Segmentation by Consumer Need / Function Memory Enhancement, Focus & Productivity, Stress & Cognitive Resilience, Mental Energy, Sleep + Cognitive Recovery
Segmentation by Positioning / Label Claims Organic / Clean Label, Vegan / Plant-Based, Sugar-Free, Non-GMO, Clinically Backed, Ayurvedic / Traditional Medicine
Segmentation by Consumer Demographic Students, Working Professionals, Aging Population, Wellness Consumers
Segmentation by Distribution Channel E-commerce / DTC, Pharmacies & Drug Stores, Health & Wellness Retail, Specialty Supplement Stores, Practitioner / Functional Medicine Clinics
Segmentation by Region North America, Latin America, East Asia, South Asia & Pacific, Western Europe, Eastern Europe, AND Middle East & Africa

The botanical brain concentrate market is projected to create an absolute dollar opportunity of USD 350.2 million between 2026 and 2036. Market growth is driven by increasing consumer demand for natural cognitive wellness products, rising adoption of herbal nootropics and medicinal mushrooms, and growing awareness regarding focus, mental clarity, and stress resilience. Expanding interest in clean-label, plant-based supplements, along with increasing consumption of functional beverages and adaptogenic wellness formulations, is further supporting market expansion globally.

Key Growth Drivers, Constraints, and Opportunities

Key Factors Driving Growth

  • Growing global consciousness related to cognitive products for mental clarity, focus, and brain health and prevention are likely to propel demand for botanical brain concentrate products.
  • Favorable consumer preference towards natural/plant-based/clean label nootropics over synthetic cognitive stimulants is contributing to the market growth in the wellness industries.
  • The increasing demand for therapeutic mushrooms such as Lion’s Mane and adaptogens like Ashwagandha and Rhodiola in dietary supplements, functional beverages, and productivity-oriented wellness products is further driving the growth of the market.
     
Growth Driver Demand Impact Time Horizon Key Impact Area Fact.MR Insight
Rising consumer focus on cognitive wellness and productivity enhancement High Short–Mid Term Demand for botanical nootropics & brain-health supplements Increasing awareness regarding focus, memory enhancement, mental clarity, and preventive brain health is significantly driving adoption of botanical brain concentrate products globally.
Growing preference for natural and plant-based cognitive wellness solutions High Short–Mid Term Clean-label nootropics & herbal supplement demand Consumers are increasingly shifting toward plant-based and non-synthetic cognitive support products, accelerating demand for herbal nootropics and botanical formulations.
Expanding adoption of medicinal mushrooms and adaptogens in wellness products Medium-High Mid–Long Term Product innovation & premium wellness positioning Medicinal mushrooms such as Lion’s Mane and adaptogens including Ashwagandha and Rhodiola are witnessing strong integration into supplements, tinctures, gummies, and functional beverages for cognitive support and stress resilience.
Increasing penetration of e-commerce and direct-to-consumer wellness platforms Medium-High Mid–Long Term Digital supplement retail & consumer accessibility Rapid expansion of online wellness ecosystems and subscription-based supplement models is improving consumer engagement and accelerating market penetration globally.
Rising development of clinically validated botanical nootropic formulations Medium-High Mid–Long Term Scientific substantiation & premium product development Increasing investment in clinical research, ingredient standardization, and evidence-based cognitive wellness products is strengthening consumer trust and supporting long-term market expansion.

Key Market Constraints

  • In some countries, the marketability may be hindered by the complicated regulations related to the cognitive-health claims, the ingredient approvals, and the botanical standardization.
  • Variations in raw material quality, active compound concentration and supply consistency create challenges for the industry in sourcing and formulating.
  • A lack of robust clinical evidence for certain herbal nootropic ingredients could impact consumer trust and uptake in the broader medical community.

Key Opportunity Areas

  • The growing need for proactive cognitive wellness and productivity-enhancing products is anticipated to provide long-term growth prospects for botanical nootropic manufacturers.
  • Increasing demand for customized nutrition, mushroom-based cognitive products and science-backed botanical formulations is driving innovation in premium products.
  • The development offunctional beverages, liquid nootropic concentrates, and convenient supplement formats are expected to further drive penetration in younger consumers and working professionals.

Segment-wise Analysis of the Botanical Brain Concentrate Market

  • Herbal Botanicals account for 36.72% share of the ingredient type segment in 2026, driven by increasing consumer preference for natural cognitive wellness products, rising adoption of Bacopa Monnieri and Ginkgo Biloba-based formulations, and growing awareness regarding botanical support for focus, memory enhancement, and mental clarity.
  • Capsules/Tablets represent 38.64% share of the product form segment in 2026, supported by strong consumer preference for convenient dosage formats, accurate ingredient dosing, product stability, and broad availability through retail and e-commerce wellness channels.
  • Focus & Productivity hold 34.92% share of the consumer need/function segment in 2026, owing to rising demand from professionals, students, and performance-focused consumers seeking cognitive enhancement and sustained mental performance.

The Botanical Brain Concentrate market is segmented by ingredient type, product form, consumer need/function, positioning/label claims, consumer demographic, distribution channel, and region.

Which Ingredient Type Segment Topped the Botanical Brain Concentrate Market?
Botanical Brain Concentrate Market Analysis By Ingredient Type

Herbal Botanicals are projected to lead the Botanical Brain Concentrate Market in 2026, accounting for a 36.7% revenue share. This leadership is driven by rising consumer preference for natural cognitive wellness solutions and plant-based nootropics, along with greater use of ingredients such as Bacopa Monnieri, Ginkgo Biloba, and Rosemary in brain-health formulations, cognitive-support supplements, and functional beverages.

Which Product Form Segment Accounts for the Highest Share in the Market?
Botanical Brain Concentrate Market Analysis By Product Form

Capsules/Tablets are anticipated to account for the largest 38.6% share in the product form category in 2026. The high popularity of this segment can be attributed to widespread consumer preference for simple and convenient supplement form factors, precise dose delivery, improved product stability, and wider accessibility through pharmacies, wellness outlets and online platforms.

Which Consumer Need / Function Segment Leads the Market?
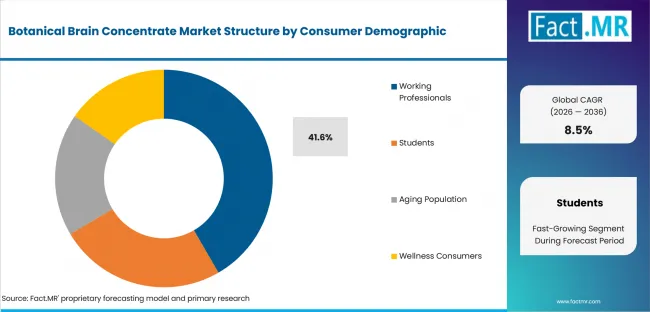
Botanical Brain Concentrate Market Analysis By Consumer Demographic

Focus & Productivity is anticipated to hold the highest market share, accounting for 34.9% in 2026, owing to increasing demand from professionals, students, and performance-oriented consumers seeking mental clarity, sustained concentration, and cognitive enhancement. Rising workplace stress and productivity optimization trends are further supporting segment growth globally.

Which Positioning / Label Claim Segment Holds the Largest Share in the Market?
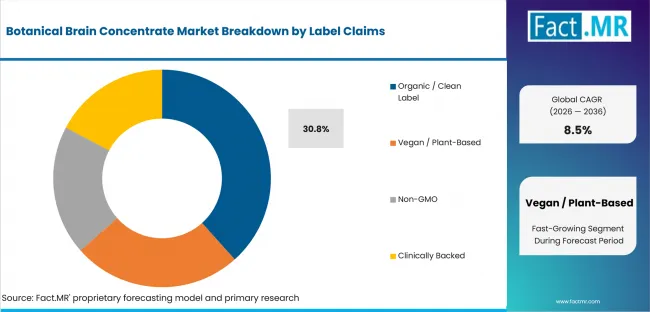
Botanical Brain Concentrate Market Analysis By Label Claims

Organic / Clean Label is projected to dominate the positioning segment, capturing 30.8% share in 2026. This leadership is driven by growing consumer preference for transparent ingredient sourcing, minimally processed formulations, plant-based cognitive wellness products, and increasing demand for clean-label nootropic supplements.

Which Distribution Channel Segment Holds the Largest Share in the Market?
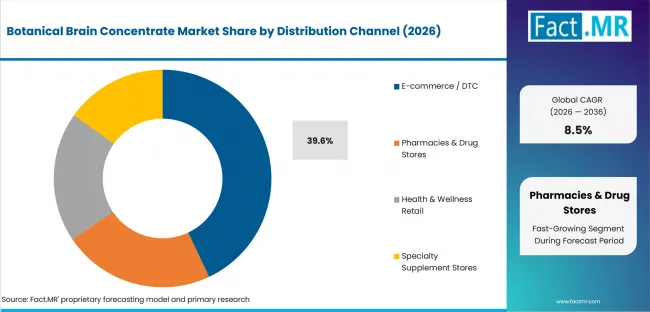
Botanical Brain Concentrate Market Analysis By Distribution Channel

E-commerce / DTC is projected to dominate the distribution channel segment, accounting for 39.64% share in 2026. This growth is supported by rising online supplement purchases, expansion of direct-to-consumer wellness brands, subscription-based supplement models, wider product accessibility, and increasing consumer preference for digital wellness shopping platforms.

Regional Outlook Across Key Markets

North America, Latin America, Western Europe, Eastern Europe, East Asia, South Asia & Pacific, and Middle East & Africa are the geographies covered in this report. It comprises consumer insights analysis on awareness regarding cognitive wellness, focus enhancement, preventive brain health, and mental clarity, along with increasing adoption of botanical nootropics, medicinal mushrooms, and adaptogenic cognitive supplements.

Top Country Growth Comparison Botanical Brain Concentrate Market Cagr (2026 2036)

CAGR Table

Country CAGR (%)
United States 7.6%
China 10.4%
Germany 6.9%
Japan 10.7%
India 5.7%
United Kingdom 7.5%
Canada 9.4%

Source: Fact.MR (FMR) analysis, based on proprietary forecasting model and primary research.
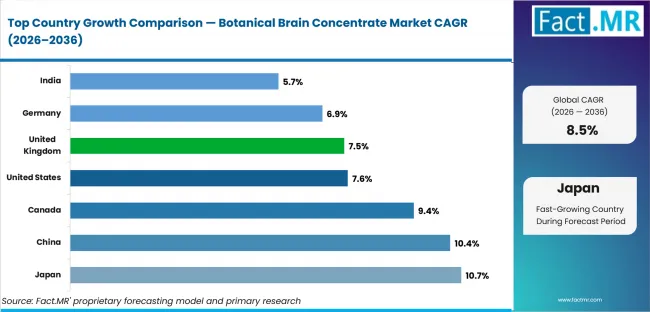
Botanical Brain Concentrate Market Cagr Analysis By Country

North America Botanical Brain Concentrate Market

North America is known as one of the most commercially developed areas in the market. It is mainly attributed to the fact that people are increasingly adopting nootropics, cognitive wellness awareness is growing, preventive healthcare practices are well-established, and the demand for botanical brain-health supplements is on the rise. Growth of the specialty retail channels such as e-commerce wellness platform, premium nootropic brands, and functional mushroom are contributing to the growth of the market in the region. Mind Lab Pro, Qualia, Onnit, Four Sigmatic and Gaia Herbs are among those who are establishing a stronger foothold in the market with clinically positioned botanical formulations and cognitive wellness innovation.

  • U.S.: Demand for the makret in the U.S. is projected to rise at 7.6% CAGR through 2036, driven by growing focus on productivity enhancement, mental clarity, medicinal mushroom adoption, and increasing preference for natural cognitive wellness products.
  • Canada: Demand for Botanical Brain Concentrates in Canada is projected to grow at 9.4% CAGR through 2036, supported by increasing clean-label supplement demand, rising wellness spending, and expanding adoption of plant-based nootropics.

Europe Botanical Brain Concentrate Market
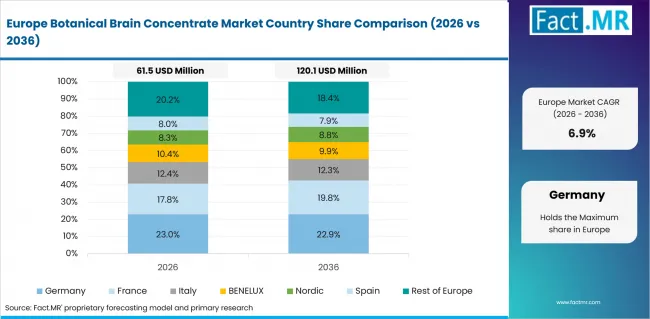
Botanical Brain Concentrate Market Europe Country Market Share Analysis, 2026 & 2036

Europe holds a major share in the market due to the growing inclination of consumers towards natural products that enhance cognitive wellness, adoption of preventive solutions for brain-health, and a high demand for botanically supported nootropics with clinical evidence. The region is experiencing growing popularity of natural nutraceutical products as well as functional health care products and medicated mushroom products. Brands are fortifying their positions in the market with premium botanical wellness formulations and clean-label nootropics.

  • Germany: Demand for Botanical Brain Concentrates in Germany is projected to rise at 6.9% CAGR through 2036, supported by increasing interest in herbal nootropics, scientifically validated cognitive-support products, and premium clean-label nutraceutical solutions.
  • United Kingdom: Demand for Botanical Brain Concentrates in the U.K. is projected to grow at 7.5% CAGR through 2036, driven by rising demand for productivity-focused wellness products, functional beverages, and digital wellness platforms.

East Asia Botanical Brain Concentrate Market
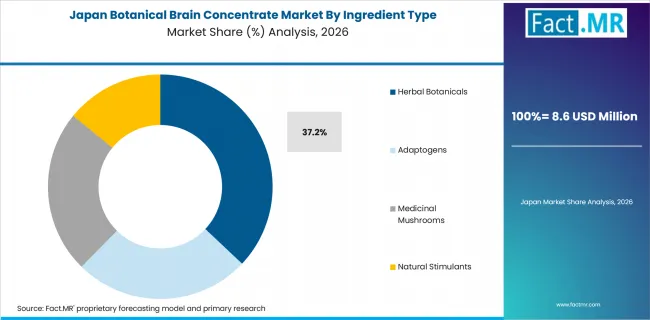
Botanical Brain Concentrate Market Japan Market Share Analysis By Ingredient Type

East Asia will be a high growth region in the market, due to strong traditional herbal medicine culture, growing intake of functional wellness products, and growing awareness related to brain health and mental performance. Companies in the region are increasingly concentrating on medicinal mushroom formulations, botanical nootropics and high-end cognitive wellness products.

  • China: Demand for botanical brain concentrates in China is projected to rise at 10.4% CAGR through 2036, driven by increasing herbal supplement consumption, expansion of functional beverage categories, rising middle-class wellness spending, and growing preventive healthcare awareness.
  • Japan: Demand for botanical brain concentrates in Japan is expected to grow at 10.7% CAGR through 2036 due to rising focus on cognitive longevity, aging population wellness needs, increasing functional nutrition adoption, and growing demand for premium brain-health products.

South Asia & Pacific Botanical Brain Concentrate Market

The South Asia & Pacific would be the fastest growing region in the market due to strong Ayurvedic tradition, rising consumption of nutraceuticals, increasing middle-class expenditure on wellness and awareness about herbal products for cognitive support. Regional players are aggressively introducing products such as nootropics based on adaptogens, botanical wellness beverages, and clean-label supplements for cognition.

  • India: Demand for botanical brain concentrates in India is projected to rise at 5.7% CAGR through 2036, supported by increasing adoption of Ayurvedic wellness products, expansion of herbal supplement brands, and growing consumer preference for natural preventive brain-health solutions.

Latin America Botanical Brain Concentrate Market

Growth of the market in Latin America is supported by increasing awareness regarding cognitive wellness, rising adoption of plant-based nutraceuticals, and expansion of herbal wellness distribution channels. Urban consumers are increasingly adopting functional beverages, medicinal mushroom products, and botanical cognitive-support supplements.

  • Brazil: Demand for botanical brain concentrates in Brazil is projected to witness steady growth through 2036, supported by increasing adoption of herbal wellness supplements, rising cognitive wellness awareness, and growing demand for natural focus-enhancement solutions.

The Fact.MR report analyzes market trends, regulatory frameworks, competitive benchmarking, consumer cognitive wellness behavior, ingredient adoption patterns, product innovation strategies, and long-term growth opportunities across individual countries in North America, Latin America, Europe, East Asia, South Asia & Pacific, and Middle East & Africa. Readers gain detailed insights into nootropics industry expansion, medicinal mushroom adoption trends, botanical ingredient commercialization, clean-label cognitive wellness demand, e-commerce penetration, functional beverage innovation, and future growth opportunities for botanical brain-health and preventive cognitive wellness products across developed and emerging global markets.

Competitive Benchmarking and Company Positioning
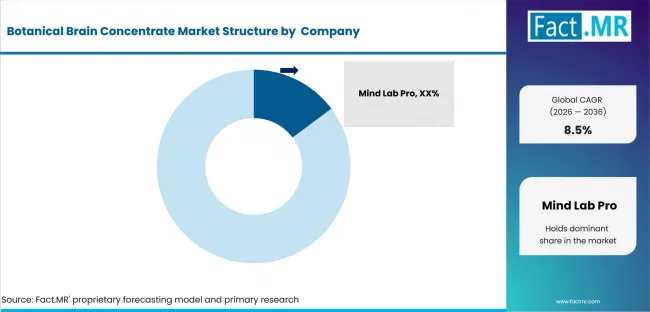
Botanical Brain Concentrate Market Analysis By Company

Leading Companies Shaping the Botanical Brain Concentrate Market

The Botanical Brain Concentrate industry is quite diversified and includes Mind Lab Pro, Qualia, Onnit, Four Sigmatic, Host Defense, Gaia Herbs, NooCube, Finzelberg, Alicanto Biotech, Mac Biosciences, and Phytologix Lifesciences. Clinical substantiation based botanicals nootropic formulations, inclusion of medicinal mushrooms, clean-label claims, ingredient standardization, and exciting e-commerce strategies are some of the compares and contrast of this space,

Top brands are currently specializing in adaptogenic cognitive wellness, functional mushroom blends, liquid nootropic concentrates, and high-end brain health formulations, seizing consumer mindshare. Regional and emerging manufacturers also are competing by way of Ayurvedic principles, plant-based cognitive formulations, cost-effective wellness products, direct-to-consumer an avenue, influencer-led branding, personalized nootropic solutions for professionals, students, wellness consumers, and users of preventive cognitive healthcare across the world.

Recent Industry Developments

  • Nestlé Vital – Launch of Brain Health & Longevity Beverage Powders (January 2025)
  • Nestlé Vital introduced a new range of beverage powders formulated to support brain health, energy, and healthy aging among adults over 40. The launch strengthens Nestlé’s positioning in functional nutrition and cognitive wellness while expanding its presence in preventive health and longevity-focused nutraceutical products.
  • Gaia Herbs – Partnership with SuppCo for Third-Party Quality Verification (March 2026)
  • Gaia Herbs partnered with SuppCo to introduce third-party TrustScore™ verification across its botanical wellness portfolio. The partnership enhances ingredient transparency, sourcing validation, and consumer trust while strengthening Gaia Herbs’ competitive positioning in clinically supported botanical and cognitive wellness supplements.
  • Magic Mind – Expansion of Functional Cognitive Performance Beverage Platform (July 2025)
  • Magic Mind announced expansion of its functional cognitive performance beverage portfolio focused on sustained mental energy, productivity enhancement, and focus support. The company highlighted increasing demand for nootropic beverages positioned beyond traditional caffeine-based energy products.
  • NeuroDyne – Launch of NeuroDyne Drops for Memory & Cognitive Support (September 2025)
  • NeuroDyne launched NeuroDyne Drops, a botanical cognitive-support formulation designed to enhance focus, sharp thinking, memory retention, and sustained mental performance. The product launch strengthens the company’s positioning in fast-acting nootropic delivery systems and botanical brain-health supplementation.
  • Four Sigmatic – Launch of “The Last of Us” Organic Ground Coffee with Lion’s Mane (February 2025)
  • Four Sigmatic introduced “The Last of Us” Organic Ground Coffee infused with Lion’s Mane mushroom to support focus, mental clarity, and energy enhancement. The launch strengthens the company’s presence in mushroom-based nootropic beverages and cognitive wellness products.
  • Host Defense – Introduction of MycoBenefits® Mushroom Wellness Product Line (March 2025)
  • Host Defense launched MycoBenefits®, a new line of mushroom mycelium supplements targeting cognitive wellness, stress resilience, immune support, and preventive health applications. The product expansion strengthens the company’s leadership in medicinal mushroom-based nutraceuticals and botanical cognitive wellness solutions.

Leading Companies Shaping the Botanical Brain Concentrate Market

  • Mind Lab Pro
  • Qualia
  • Onnit
  • Noocube
  • Finzelberg
  • Alicanto Biotech
  • Mac Biosciences
  • Phytologix Lifesciences
  • Four Sigmatic
  • Host Defense
  • Gaia Herbs

Sources and Research References

  • [1] Nestlé Health Science, “Nestlé Vital Protein Beverage Powders Target Brain Health, Longevity, and Energy for Adults Over 40”, January 2025
  • [2] Gaia Herbs, “Gaia Herbs® Partners with SuppCo for Third-Party Quality Verification”, March 2026
  • [3] Magic Mind, “Beyond Caffeine: Expanding Functional Cognitive Performance Beverages”, July 2025
  • [4] NeuroDyne, “NeuroDyne Drops: Sharp Mind, Enhanced Memory, and Lasting Cognitive Support”, September 2025
  • [5] Four Sigmatic, “Four Sigmatic Debuts The Last of Us Organic Ground Coffee – Infected with Focus & Energy”, February 2025
  • [6] Host Defense, “Host Defense® Introduces MycoBenefits®: A New Line of Mushroom Mycelium Supplements”, March 2025

Botanical Brain Concentrate Market Definition

Botanical brain concentrate market is a segment of the plant-based cognitive wellness market that includes products having ingredients or formulation that aids mental clarity, brain focus, memory, stress resilience and general brain wellness. They usually have herbal botanicals, adaptogens, mushrooms medicinal, and stimulants naturales, and you can buy them in caps, powder mixes, liquid concentrates/tinctures, gummies, functional drinks. Botanical brain concentrates have traditionally been used to help us focus and get things done, support cognitive function, enhance mental energy, manage stress, and help protect preventatively an aging brain.

Botanical Brain Concentrate Market Inclusions

The market report covers a comprehensive analysis of the global and regional market for 2026-2036. By ingredient type, product form, consumer need/function, positioning, consumer group, and distribution channel, it analyses regional adoption patterns, competitive landscapes, consumer wellness behavior, product innovation, and botanical ingredient innovation in the wellness industry. The report also identifies growing trends, including medicinal mushroom nootropics, clean-label cognitive wellness products, functional nootropic beverages, adaptogenic formulations, personalization in supplementation and growth in direct-to-consumer wellness platforms.

Botanical Brain Concentrate Market Exclusions

This report covers the natural nootropic branded ingredients, herb extracts, medicinal mushrooms, adaptogens blends, and botanicals-based brain health solutions designed to assist with mental focus, memory and retention, cognitive capabilities, stress management, and brain-health usage. However, the review does not cover synthetic drug cognitive enhancers, prescription neuro-stimulants, psychiatric drugs, or clinical neurology treatments. The review will also not cover general supplements or dietary supplements which are not marketed or labeled as cognitive wellness supplements, this includes items that are exclusively sports nutrition, immune support, weight management, digestive health or simple vitamin/mineral supplements without botanicals that assist brain health and function unless used in such a way.

Botanical Brain Concentrate Market Research Methodology

  • Primary Research
    • The global market was estimated using top-down and bottom-up methodologies. Elaborate primer research has been conducted with the botanical ingredient suppliers, nootropic supplement manufacturers, medicinal mushroom producers, functional drink companies, wellness retailers, healthcare e-commerce providers, medical practitioners and industry consultants to confirm market trends, consumer adoption patterns, pricing models, innovation strategies and potential future demand.
  • Desk Research
    • The report includes information retrieved from annual reports of companies, investor presentations, reports on the nutraceutical industry, herbal wellness journals, research papers on nootropics, trade databases, government statistics of dietary supplements, regulatory publications, and studies on cognitive wellness, adaptogens, medicinal mushrooms, preventive healthcare and functional nutrition.
  • Market-Sizing and Forecasting
    • Fact.MR’s market estimation approach for the market is based on a comprehensive methodology wherein revenues generated by botanical nootropic manufacturers, medicinal mushroom suppliers, herbal wellness brands, and functional beverage companies are analyzed through a bottom-up approach and further validated using a top-down framework considering the broader ecosystem of nootropics, nutraceuticals, cognitive wellness products, and preventive healthcare supplements across major regional and application markets.
  • Data Validation and Update Cycle
    • The Market estimates were validated through primary interviews, company financial analysis, demand assessment of the ingredients, analysis of retail and e-commerce sales, regional consumption patterns of cognitive wellness, and historical growth of botanical nootropics and adaptogen-based products. Projections are subject to revision in light of shifts in consumer tastes, emerging regulatory requirements, new ingredient development, scientific substantiation of botanical cognitive formulations, growth of digital wellness platforms, and other global trends relating to anticipatory brain-health and cognitive wellness expenditures.

Scope of Analysis

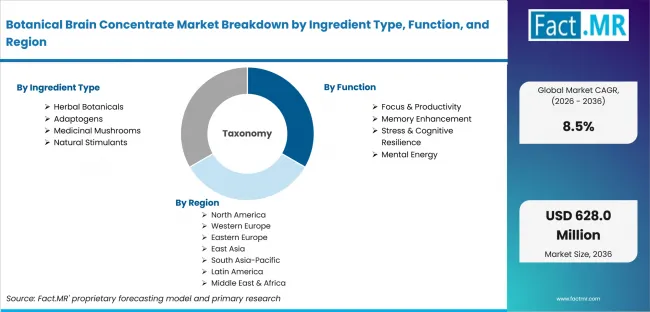
Botanical Brain Concentrate Market Breakdown By Ingredient Type, Function, And Region


Parameter
Details
Quantitative Units USD 256.0 million (2025) to USD 628.0 million (2036), at a CAGR of 8.5%
Market Definition The Botanical Brain Concentrate market covers plant-based nootropic ingredients, herbal extracts, medicinal mushrooms, adaptogens, and botanical cognitive wellness formulations designed to support focus enhancement, memory support, mental clarity, stress resilience, cognitive balance, mental energy, and overall brain health. These products include capsules/tablets, powder mixes, liquid concentrates/tinctures, gummies, and functional beverages formulated using ingredients such as Bacopa Monnieri, Ginkgo Biloba, Lion’s Mane, Ashwagandha, Rhodiola, Rosemary, and other botanical nootropics used across nutraceutical, dietary supplement, herbal wellness, functional beverage, and preventive healthcare industries.
Regions Covered North America, Eastern Europe, Western Europe, East Asia, South Asia & Pacific, Latin America, Middle East & Africa
Countries Covered USA, Canada, Germany, United Kingdom, China, Japan, India, Brazil, South Korea, Australia, UAE, South Africa, and 20+ countries
Key Companies Mind Lab Pro, Qualia, Onnit, Four Sigmatic, Host Defense, Gaia Herbs, NooCube, Finzelberg, Alicanto Biotech, Mac Biosciences, Phytologix Lifesciences
Forecast Period 2026 to 2036
Approach Hybrid demand-side and top-down methodology based on botanical nootropic consumption trends, medicinal mushroom adoption rates, cognitive wellness demand, preventive brain-health spending, functional beverage expansion, e-commerce penetration, clean-label nutraceutical growth, and increasing investments in clinically validated botanical formulations, validated through primary interviews with nootropic manufacturers, botanical ingredient suppliers, wellness retailers, healthcare practitioners, distributors, and industry experts across key global regions.

Analysis by Ingredient Type, Product Form, Consumer Need / Function, Positioning / Label Claims, Consumer Demographic, Distribution Channel, and Region

  • Botanical Brain Concentrate Market by Ingredient Type

    • Herbal Botanicals
      • Bacopa Monnieri (Brahmi)
      • Ginkgo Biloba
      • Gotu Kola
      • Rosemary
      • Sage
    • Adaptogens
      • Ashwagandha
      • Rhodiola Rosea
      • Holy Basil (Tulsi)
      • Schisandra
    • Medicinal Mushrooms
      • Lion’s Mane
      • Reishi
      • Cordyceps
      • Chaga
    • Natural Stimulants
      • Green Tea Extract
      • Guarana
      • Yerba Mate
    • Combination Formulas
  • Botanical Brain Concentrate Market by Product Form

    • Capsules/Tablets
    • Powder Mixes
    • Liquid Concentrates / Tinctures
    • Gummies
    • Functional Beverages
  • Botanical Brain Concentrate Market by Consumer Need / Function

    • Memory Enhancement
    • Focus & Productivity
    • Stress & Cognitive Resilience
    • Mental Energy
    • Sleep + Cognitive Recovery
  • Botanical Brain Concentrate Market by Positioning / Label Claims

    • Organic / Clean Label
    • Vegan / Plant-Based
    • Sugar-Free
    • Non-GMO
    • Clinically Backed
    • Ayurvedic / Traditional Medicine
  • Botanical Brain Concentrate Market by Consumer Demographic

    • Students
    • Working Professionals
    • Aging Population
    • Wellness Consumers
  • Botanical Brain Concentrate Market by Distribution Channel

    • E-commerce / DTC
    • Pharmacies & Drug Stores
    • Health & Wellness Retail
    • Specialty Supplement Stores
    • Practitioner / Functional Medicine Clinics
  • Botanical Brain Concentrate Market by Region

    • North America
      • USA
      • Canada
      • Mexico
    • Latin America
      • Brazil
      • Chile
      • Rest of LATAM
    • East Asia
      • China
      • Japan
      • South Korea
      • Taiwan
    • South Asia & Pacific
      • India
      • Singapore
      • Australia
      • ASEAN
    • Western Europe
      • Germany
      • France
      • U.K.
      • Italy
      • Spain
      • BENELUX
      • Nordic
      • Rest of Western Europe
    • Eastern Europe
      • Poland
      • Hungary
      • Czech Republic
      • Balkan & Baltics
      • Rest of Eastern Europe
    • Middle East and Africa
      • Kingdom of Saudi Arabia
      • United Arab Emirates
      • South Africa
      • Rest of Middle East and Africa

- Frequently Asked Questions -

How large is the demand for Botanical Brain Concentrates in the global market in 2025?

Demand for Botanical Brain Concentrates in the global market is estimated to be valued at USD 256.0 million in 2025.

What will be the market size of the Botanical Brain Concentrate Market by 2036?

The Botanical Brain Concentrate market is projected to reach USD 628.0 million by 2036.

What is the expected demand growth for the Botanical Brain Concentrate Market between 2026 and 2036?

Demand for Botanical Brain Concentrates is expected to grow at a CAGR of 8.5% between 2026 and 2036, supported by increasing consumer focus on cognitive wellness, rising demand for natural nootropic solutions, growing adoption of medicinal mushrooms and adaptogenic supplements, expansion of functional wellness products, and increasing preference for plant-based preventive brain-health solutions globally.

How significant is the growth outlook for Japan in this market?

Japan is expected to grow at a CAGR of 10.7% through 2036, supported by rising demand for cognitive wellness products, increasing focus on healthy aging and mental performance, growing adoption of premium functional nutrition products, and expanding consumer preference for botanical nootropics and preventive brain-health solutions.

Which company is identified as a leading player in the Botanical Brain Concentrate Market?

Mind Lab Pro is recognized as a leading player in the Botanical Brain Concentrate Market, offering premium botanical nootropic formulations, cognitive wellness supplements, focus-enhancement products, and clean-label brain-health solutions across global nutraceutical and wellness industries

Table of Content

  1. Botanical Brain Concentrate Market - Executive Summary
  2. Market Overview
    • Market Definition and Introduction
    • Market Taxonomy/ Research Scope
  3. Global Botanical Brain Concentrate Market Demand Analysis 2021-2025 and Forecast, 2026–2036
    • Historical Market Volume Analysis, 2021-2025
    • Current and Future Market Volume Forecast, 2026–2036
    • Y-o-Y Growth Trend Analysis
  4. Global Botanical Brain Concentrate Market - Pricing Analysis
    • Product Category and Country-Level Pricing Analysis
    • Global Average Pricing Analysis Benchmark
    • Factors Influencing Pricing
    • Competitive Pricing Strategies
    • Price Trends and Forecasts
      • Historical price trends
      • Future price forecasts
  5. Global Botanical Brain Concentrate Market Demand Analysis 2021-2025 and Forecast, 2026–2036
    • Historical Market Value Analysis, 2021-2025
    • Current and Future Market Value Forecast, 2026–2036
      • Y-o-Y Growth Trend Analysis
      • Absolute $ Opportunity Analysis
  6. Market Background and Foundation Data
    • Global Nootropics Market Outlook, 2025
      • Rising demand for cognitive wellness products
      • Growth driven by natural nootropics and adaptogens
      • Functional mushrooms gained strong traction
      • North America dominated market revenue
      • eCommerce remained the leading sales channel
    • Penetration of Botanical Brain Concentrate in Global Nootropics Market
      • Emerging niche within natural nootropics
      • Accounted for ~5–6% of nootropics market
      • Growing adoption of botanical cognition products
      • Demand supported by clean-label trends
      • Premium wellness consumers driving penetration
    • Consumer Perception Analysis
      • Consumers prefer natural brain-enhancement products
      • Strong demand for stress-relief and focus support
      • Lion’s Mane and Ashwagandha highly preferred
      • Organic and vegan claims influence purchases
      • Transparency and ingredient traceability important
    • Recent Developments by Market Players
      • Launch of mushroom-based cognition products
      • Expansion of liquid nootropic concentrates
      • Increased focus on DTC sales channels
      • Partnerships with botanical ingredient suppliers
      • Investments in clinically backed formulations
    • Trade Scenario, 2025
      • Imports & Export Analysis
      • By Region
      • By Country
    • Investment Analysis, By Region
    • Start-up Ecosystem Analysis, 2021–2025
      • Total Number of Startups
      • Emerging Start-ups
      • Regions Covered
      • Investment Trends
      • Regulations & Policies
      • Sustainability Initiatives
    • Botanical Brain Concentrate Market Opportunity Assessment
      • Total Available Market (US$ Mn)
      • Serviceable Addressable Market (US$ Mn)
      • Serviceable Obtainable Market (US$ Mn)
    • Porter’s Five Forces and PESTEL Analysis
    • Investment Feasibility Analysis
    • Macro-Economic Factors
    • Forecast Factors - Relevance & Impact
    • Industry Value and Supply Chain Analysis
      • List of Key Channel Partners
      • Profit Margin & Operating Margin at Each Node of Supply Chain.
      • Notes on Value Added at Each Node in the Value Chain
      • Factors Influencing Value Chain
    • Market Dynamics
      • Drivers
      • Restraints
      • Opportunity
      • Trend Analysis
    • Key Regulations & Certifications
  7. Global Botanical Brain Concentrate Market Analysis 2021-2025 and Forecast 2026–2036, By Ingredient Type
    • Introduction / Key Findings
    • Market Size & Volume Analysis by Market Taxonomy, 2021–2036
      • Herbal Botanicals
        • Bacopa Monnieri (Brahmi)
        • Ginkgo Biloba
        • Gotu Kola
        • Rosemary
        • Sage
      • Adaptogens
        • Ashwagandha
        • Rhodiola Rosea
        • Holy Basil (Tulsi)
        • Schisandra
      • Medicinal Mushrooms
        • Lion’s Mane
        • Reishi
        • Cordyceps
        • Chaga
      • Natural Stimulants
        • Green Tea Extract
        • Guarana
        • Yerba Mate
      • Combination Formulas
    • Market Attractiveness Analysis by Ingredient Type
  8. Global Botanical Brain Concentrate Market Analysis 2021-2025 and Forecast 2026–2036, By Product Form
    • Introduction / Key Findings
    • Market Size & Volume Analysis by Market Taxonomy, 2021–2036
      • Capsules/Tablets
      • Powder Mixes
      • Liquid Concentrates / Tinctures
      • Gummies
      • Functional Beverages
    • Market Attractiveness Analysis by Product Form
  9. Global Botanical Brain Concentrate Market Analysis 2021-2025 and Forecast 2026–2036, By Consumer Need / Function
    • Introduction / Key Findings
    • Market Size & Volume Analysis by Market Taxonomy, 2021–2036
      • Memory Enhancement
      • Focus & Productivity
      • Stress & Cognitive Resilience
      • Mental Energy
      • Sleep + Cognitive Recovery
    • Market Attractiveness Analysis by Consumer Need / Function
  10. Global Botanical Brain Concentrate Market Analysis 2021-2025 and Forecast 2026–2036, By Positioning / Label Claims
    • Introduction / Key Findings
    • Market Size & Volume Analysis by Market Taxonomy, 2021–2036
      • Organic / Clean Label
      • Vegan / Plant-Based
      • Sugar-Free
      • Non-GMO
      • Clinically Backed
      • Ayurvedic / Traditional Medicine
    • Market Attractiveness Analysis by Positioning / Label Claims
  11. Global Botanical Brain Concentrate Market Analysis 2021-2025 and Forecast 2026–2036, By Consumer Demographic
    • Introduction / Key Findings
    • Market Size & Volume Analysis by Market Taxonomy, 2021–2036
      • Students
      • Working Professionals
      • Aging Population
      • Wellness Consumers
    • Market Attractiveness Analysis by Consumer Demographic
  12. Global Botanical Brain Concentrate Market Analysis 2021-2025 and Forecast 2026–2036, By Distribution Channel
    • Introduction / Key Findings
    • Market Size & Volume Analysis by Market Taxonomy, 2021–2036
      • E-commerce / DTC
      • Pharmacies & Drug Stores
      • Health & Wellness Retail
      • Specialty Supplement Stores
      • Practitioner / Functional Medicine Clinics
    • Market Attractiveness Analysis by Distribution Channel
  13. Global Botanical Brain Concentrate Market Analysis and Forecast, by Region
    • Introduction / Key Findings
    • Market Size & Volume Analysis by Market Taxonomy, 2021–2036
      • North America
      • Latin America
      • Western Europe
      • Eastern Europe
      • East Asia
      • South Asia & Pacific
      • Middle East & Africa
    • Market Attractiveness Analysis by Region
  14. North America Botanical Brain Concentrate Market Analysis and Forecast
    • Market Size & Volume Analysis by Market Taxonomy, 2021–2036
      • By Country
        • United States
        • Canada
        • Mexico
      • By Taxonomy
    • Market Attractiveness Analysis by Country & Taxonomy
  15. Latin America Botanical Brain Concentrate Market Analysis and Forecast
    • Market Size & Volume Analysis by Market Taxonomy, 2021–2036
      • By Country
        • Brazil
        • Chile
        • Rest of LATAM
      • By Taxonomy
    • Market Attractiveness Analysis by Country & Taxonomy
  16. Western Europe Botanical Brain Concentrate Market Analysis and Forecast
    • Market Size & Volume Analysis by Market Taxonomy, 2021–2036
      • By Country
        • Germany
        • Italy
        • France
        • United Kingdom
        • Spain
        • BENELUX
        • Nordics
        • Rest of Western Europe
      • By Taxonomy
    • Market Attractiveness Analysis by Country & Taxonomy
  17. Eastern Europe Botanical Brain Concentrate Market Analysis and Forecast
    • Market Size & Volume Analysis by Market Taxonomy, 2021–2036
      • By Country
        • Russia
        • Hungary
        • Poland
        • Balkan & Baltics
        • Rest of Eastern Europe
      • By Taxonomy
    • Market Attractiveness Analysis by Country & Taxonomy
  18. East Asia Botanical Brain Concentrate Market Analysis and Forecast
    • Market Size & Volume Analysis by Market Taxonomy, 2021–2036
      • By Country
        • China
        • Japan
        • South Korea
      • By Taxonomy
    • Market Attractiveness Analysis by Country & Taxonomy
  19. South Asia & Pacific Botanical Brain Concentrate Market Analysis and Forecast
    • Market Size & Volume Analysis by Market Taxonomy, 2021–2036
      • By Country
        • India
        • ASEAN
        • Australia & New Zealand
        • Rest of South Asia & Pacific
      • By Taxonomy
    • Market Attractiveness Analysis by Country & Taxonomy
  20. Middle East & Africa Botanical Brain Concentrate Market Analysis and Forecast
    • Market Size & Volume Analysis by Market Taxonomy, 2021–2036
      • By Country
        • Kingdom of Saudi Arabia
        • Other GCC Countries
        • Türkiye
        • South Africa
        • Other African Union
      • By Taxonomy
    • Market Attractiveness Analysis by Country & Taxonomy
  21. Country-level Botanical Brain Concentrate Market Analysis and Forecast
    • Introduction
      • Market Value Proportion Analysis, By Key Countries
      • Global Vs. Country Growth Comparison
    • United States Botanical Brain Concentrate Market Analysis
      • Market Size & Volume Analysis by Market Taxonomy, 2021–2036
        • By Ingredient Type
        • By Product Form
        • By Consumer Need / Function
        • By Positioning / Label Claims
        • By Consumer Demographic
        • By Distribution Channel
      • Canada Botanical Brain Concentrate Market Analysis
      • Mexico Botanical Brain Concentrate Market Analysis
      • Brazil Botanical Brain Concentrate Market Analysis
      • Chile Botanical Brain Concentrate Market Analysis
      • Germany Botanical Brain Concentrate Market Analysis
      • France Botanical Brain Concentrate Market Analysis
      • Italy Botanical Brain Concentrate Market Analysis
      • Spain Botanical Brain Concentrate Market Analysis
      • United Kingdom Botanical Brain Concentrate Market Analysis
      • BENELUX Botanical Brain Concentrate Market Analysis
      • Nordics Botanical Brain Concentrate Market Analysis
      • Poland Botanical Brain Concentrate Market Analysis
      • Russia Botanical Brain Concentrate Market Analysis
      • Hungary Botanical Brain Concentrate Market Analysis
      • Balkan & Baltics Botanical Brain Concentrate Market Analysis
      • China Botanical Brain Concentrate Market Analysis
      • Japan Botanical Brain Concentrate Market Analysis
      • South Korea Botanical Brain Concentrate Market Analysis
      • India Botanical Brain Concentrate Market Analysis
      • ASEAN Botanical Brain Concentrate Market Analysis
      • ANZ Botanical Brain Concentrate Market Analysis
      • KSA Botanical Brain Concentrate Market Analysis
      • Other GCC Countries Botanical Brain Concentrate Market Analysis
      • South Africa Botanical Brain Concentrate Market Analysis
      • Türkiye Botanical Brain Concentrate Market Analysis
    • Botanical Brain Concentrate Market Structure Analysis
      • Market Analysis by Tier of Companies
      • Market Share Analysis of Top Players
      • Market Space for New Brands and Dollar Opportunity
      • Market Presence Analysis
        • Regional Footprint of Players
        • Product Footprint by Players
        • Application Footprint by Players
    • Botanical Brain Concentrate Competition Analysis
      • Competition Dashboard
      • Pricing Analysis by Competition
      • Competition Benchmarking
      • Competition Deep Dive (Consumer Nootropic Brands)
        • Mind Lab Pro
          • Overview
          • Product Portfolio
          • Sales Footprint
          • Key Developments
          • SWOT Analysis
          • Strategy Overview
          • Key Financials
        • Qualia
        • Onnit
        • Four Sigmatic
        • Host Defense
        • Gaia Herbs
        • NooCube
        • Other Prominent Players
      • Competition Deep Dive (Botanical Ingredient Suppliers)
        • Finzelberg
        • Alicanto Biotech
        • Mac Biosciences
        • Phytologix Lifesciences
        • Other Prominent Players
    • Assumption & Acronyms Used
    • Research Methodology & Data Sources

List Of Table

  • Table 1: Global Market Value (USD Mn) Forecast by Region, 2021 to 2036
  • Table 2: Global Market Volume (Units) Forecast by Region, 2021 to 2036
  • Table 3: Global Market Value (USD Mn) Forecast by Ingredient Type, 2021 to 2036
  • Table 4: Global Market Volume (Units) Forecast by Ingredient Type, 2021 to 2036
  • Table 5: Global Market Value (USD Mn) Forecast by Product Form, 2021 to 2036
  • Table 6: Global Market Volume (Units) Forecast by Product Form, 2021 to 2036
  • Table 7: Global Market Value (USD Mn) Forecast by Consumer Need / Function, 2021 to 2036
  • Table 8: Global Market Volume (Units) Forecast by Consumer Need / Function, 2021 to 2036
  • Table 9: Global Market Value (USD Mn) Forecast by Positioning / Label Claims, 2021 to 2036
  • Table 10: Global Market Volume (Units) Forecast by Positioning / Label Claims, 2021 to 2036
  • Table 11: Global Market Value (USD Mn) Forecast by Consumer Demographic, 2021 to 2036
  • Table 12: Global Market Volume (Units) Forecast by Consumer Demographic, 2021 to 2036
  • Table 13: Global Market Value (USD Mn) Forecast by Distribution Channel, 2021 to 2036
  • Table 14: Global Market Volume (Units) Forecast by Distribution Channel, 2021 to 2036
  • Table 15: North America Market Value (USD Mn) Forecast by Country, 2021 to 2036
  • Table 16: North America Market Volume (Units) Forecast by Country, 2021 to 2036
  • Table 17: North America Market Value (USD Mn) Forecast by Ingredient Type, 2021 to 2036
  • Table 18: North America Market Volume (Units) Forecast by Ingredient Type, 2021 to 2036
  • Table 19: North America Market Value (USD Mn) Forecast by Product Form, 2021 to 2036
  • Table 20: North America Market Volume (Units) Forecast by Product Form, 2021 to 2036
  • Table 21: North America Market Value (USD Mn) Forecast by Consumer Need / Function, 2021 to 2036
  • Table 22: North America Market Volume (Units) Forecast by Consumer Need / Function, 2021 to 2036
  • Table 23: North America Market Value (USD Mn) Forecast by Positioning / Label Claims, 2021 to 2036
  • Table 24: North America Market Volume (Units) Forecast by Positioning / Label Claims, 2021 to 2036
  • Table 25: North America Market Value (USD Mn) Forecast by Consumer Demographic, 2021 to 2036
  • Table 26: North America Market Volume (Units) Forecast by Consumer Demographic, 2021 to 2036
  • Table 27: North America Market Value (USD Mn) Forecast by Distribution Channel, 2021 to 2036
  • Table 28: North America Market Volume (Units) Forecast by Distribution Channel, 2021 to 2036
  • Table 29: Latin America Market Value (USD Mn) Forecast by Country, 2021 to 2036
  • Table 30: Latin America Market Volume (Units) Forecast by Country, 2021 to 2036
  • Table 31: Latin America Market Value (USD Mn) Forecast by Ingredient Type, 2021 to 2036
  • Table 32: Latin America Market Volume (Units) Forecast by Ingredient Type, 2021 to 2036
  • Table 33: Latin America Market Value (USD Mn) Forecast by Product Form, 2021 to 2036
  • Table 34: Latin America Market Volume (Units) Forecast by Product Form, 2021 to 2036
  • Table 35: Latin America Market Value (USD Mn) Forecast by Consumer Need / Function, 2021 to 2036
  • Table 36: Latin America Market Volume (Units) Forecast by Consumer Need / Function, 2021 to 2036
  • Table 37: Latin America Market Value (USD Mn) Forecast by Positioning / Label Claims, 2021 to 2036
  • Table 38: Latin America Market Volume (Units) Forecast by Positioning / Label Claims, 2021 to 2036
  • Table 39: Latin America Market Value (USD Mn) Forecast by Consumer Demographic, 2021 to 2036
  • Table 40: Latin America Market Volume (Units) Forecast by Consumer Demographic, 2021 to 2036
  • Table 41: Latin America Market Value (USD Mn) Forecast by Distribution Channel, 2021 to 2036
  • Table 42: Latin America Market Volume (Units) Forecast by Distribution Channel, 2021 to 2036
  • Table 43: Western Europe Market Value (USD Mn) Forecast by Country, 2021 to 2036
  • Table 44: Western Europe Market Volume (Units) Forecast by Country, 2021 to 2036
  • Table 45: Western Europe Market Value (USD Mn) Forecast by Ingredient Type, 2021 to 2036
  • Table 46: Western Europe Market Volume (Units) Forecast by Ingredient Type, 2021 to 2036
  • Table 47: Western Europe Market Value (USD Mn) Forecast by Product Form, 2021 to 2036
  • Table 48: Western Europe Market Volume (Units) Forecast by Product Form, 2021 to 2036
  • Table 49: Western Europe Market Value (USD Mn) Forecast by Consumer Need / Function, 2021 to 2036
  • Table 50: Western Europe Market Volume (Units) Forecast by Consumer Need / Function, 2021 to 2036
  • Table 51: Western Europe Market Value (USD Mn) Forecast by Positioning / Label Claims, 2021 to 2036
  • Table 52: Western Europe Market Volume (Units) Forecast by Positioning / Label Claims, 2021 to 2036
  • Table 53: Western Europe Market Value (USD Mn) Forecast by Consumer Demographic, 2021 to 2036
  • Table 54: Western Europe Market Volume (Units) Forecast by Consumer Demographic, 2021 to 2036
  • Table 55: Western Europe Market Value (USD Mn) Forecast by Distribution Channel, 2021 to 2036
  • Table 56: Western Europe Market Volume (Units) Forecast by Distribution Channel, 2021 to 2036
  • Table 57: Eastern Europe Market Value (USD Mn) Forecast by Country, 2021 to 2036
  • Table 58: Eastern Europe Market Volume (Units) Forecast by Country, 2021 to 2036
  • Table 59: Eastern Europe Market Value (USD Mn) Forecast by Ingredient Type, 2021 to 2036
  • Table 60: Eastern Europe Market Volume (Units) Forecast by Ingredient Type, 2021 to 2036
  • Table 61: Eastern Europe Market Value (USD Mn) Forecast by Product Form, 2021 to 2036
  • Table 62: Eastern Europe Market Volume (Units) Forecast by Product Form, 2021 to 2036
  • Table 63: Eastern Europe Market Value (USD Mn) Forecast by Consumer Need / Function, 2021 to 2036
  • Table 64: Eastern Europe Market Volume (Units) Forecast by Consumer Need / Function, 2021 to 2036
  • Table 65: Eastern Europe Market Value (USD Mn) Forecast by Positioning / Label Claims, 2021 to 2036
  • Table 66: Eastern Europe Market Volume (Units) Forecast by Positioning / Label Claims, 2021 to 2036
  • Table 67: Eastern Europe Market Value (USD Mn) Forecast by Consumer Demographic, 2021 to 2036
  • Table 68: Eastern Europe Market Volume (Units) Forecast by Consumer Demographic, 2021 to 2036
  • Table 69: Eastern Europe Market Value (USD Mn) Forecast by Distribution Channel, 2021 to 2036
  • Table 70: Eastern Europe Market Volume (Units) Forecast by Distribution Channel, 2021 to 2036
  • Table 71: East Asia Market Value (USD Mn) Forecast by Country, 2021 to 2036
  • Table 72: East Asia Market Volume (Units) Forecast by Country, 2021 to 2036
  • Table 73: East Asia Market Value (USD Mn) Forecast by Ingredient Type, 2021 to 2036
  • Table 74: East Asia Market Volume (Units) Forecast by Ingredient Type, 2021 to 2036
  • Table 75: East Asia Market Value (USD Mn) Forecast by Product Form, 2021 to 2036
  • Table 76: East Asia Market Volume (Units) Forecast by Product Form, 2021 to 2036
  • Table 77: East Asia Market Value (USD Mn) Forecast by Consumer Need / Function, 2021 to 2036
  • Table 78: East Asia Market Volume (Units) Forecast by Consumer Need / Function, 2021 to 2036
  • Table 79: East Asia Market Value (USD Mn) Forecast by Positioning / Label Claims, 2021 to 2036
  • Table 80: East Asia Market Volume (Units) Forecast by Positioning / Label Claims, 2021 to 2036
  • Table 81: East Asia Market Value (USD Mn) Forecast by Consumer Demographic, 2021 to 2036
  • Table 82: East Asia Market Volume (Units) Forecast by Consumer Demographic, 2021 to 2036
  • Table 83: East Asia Market Value (USD Mn) Forecast by Distribution Channel, 2021 to 2036
  • Table 84: East Asia Market Volume (Units) Forecast by Distribution Channel, 2021 to 2036
  • Table 85: South Asia and Pacific Market Value (USD Mn) Forecast by Country, 2021 to 2036
  • Table 86: South Asia and Pacific Market Volume (Units) Forecast by Country, 2021 to 2036
  • Table 87: South Asia and Pacific Market Value (USD Mn) Forecast by Ingredient Type, 2021 to 2036
  • Table 88: South Asia and Pacific Market Volume (Units) Forecast by Ingredient Type, 2021 to 2036
  • Table 89: South Asia and Pacific Market Value (USD Mn) Forecast by Product Form, 2021 to 2036
  • Table 90: South Asia and Pacific Market Volume (Units) Forecast by Product Form, 2021 to 2036
  • Table 91: South Asia and Pacific Market Value (USD Mn) Forecast by Consumer Need / Function, 2021 to 2036
  • Table 92: South Asia and Pacific Market Volume (Units) Forecast by Consumer Need / Function, 2021 to 2036
  • Table 93: South Asia and Pacific Market Value (USD Mn) Forecast by Positioning / Label Claims, 2021 to 2036
  • Table 94: South Asia and Pacific Market Volume (Units) Forecast by Positioning / Label Claims, 2021 to 2036
  • Table 95: South Asia and Pacific Market Value (USD Mn) Forecast by Consumer Demographic, 2021 to 2036
  • Table 96: South Asia and Pacific Market Volume (Units) Forecast by Consumer Demographic, 2021 to 2036
  • Table 97: South Asia and Pacific Market Value (USD Mn) Forecast by Distribution Channel, 2021 to 2036
  • Table 98: South Asia and Pacific Market Volume (Units) Forecast by Distribution Channel, 2021 to 2036
  • Table 99: Middle East & Africa Market Value (USD Mn) Forecast by Country, 2021 to 2036
  • Table 100: Middle East & Africa Market Volume (Units) Forecast by Country, 2021 to 2036
  • Table 101: Middle East & Africa Market Value (USD Mn) Forecast by Ingredient Type, 2021 to 2036
  • Table 102: Middle East & Africa Market Volume (Units) Forecast by Ingredient Type, 2021 to 2036
  • Table 103: Middle East & Africa Market Value (USD Mn) Forecast by Product Form, 2021 to 2036
  • Table 104: Middle East & Africa Market Volume (Units) Forecast by Product Form, 2021 to 2036
  • Table 105: Middle East & Africa Market Value (USD Mn) Forecast by Consumer Need / Function, 2021 to 2036
  • Table 106: Middle East & Africa Market Volume (Units) Forecast by Consumer Need / Function, 2021 to 2036
  • Table 107: Middle East & Africa Market Value (USD Mn) Forecast by Positioning / Label Claims, 2021 to 2036
  • Table 108: Middle East & Africa Market Volume (Units) Forecast by Positioning / Label Claims, 2021 to 2036
  • Table 109: Middle East & Africa Market Value (USD Mn) Forecast by Consumer Demographic, 2021 to 2036
  • Table 110: Middle East & Africa Market Volume (Units) Forecast by Consumer Demographic, 2021 to 2036
  • Table 111: Middle East & Africa Market Value (USD Mn) Forecast by Distribution Channel, 2021 to 2036
  • Table 112: Middle East & Africa Market Volume (Units) Forecast by Distribution Channel, 2021 to 2036

List Of Figures

  • Figure 1: Global Market Volume (Units) Forecast 2021–2036
  • Figure 2: Global Market Pricing Analysis
  • Figure 3: Global Market Value (USD Mn) Forecast 2021–2036
  • Figure 4: Global Market Value Share and BPS Analysis by Ingredient Type, 2026 and 2036
  • Figure 5: Global Market Y-o-Y Growth Comparison by Ingredient Type, 2026 to 2036
  • Figure 6: Global Market Attractiveness Analysis by Ingredient Type
  • Figure 7: Global Market Value Share and BPS Analysis by Product Form, 2026 and 2036
  • Figure 8: Global Market Y-o-Y Growth Comparison by Product Form, 2026 to 2036
  • Figure 9: Global Market Attractiveness Analysis by Product Form
  • Figure 10: Global Market Value Share and BPS Analysis by Consumer Need / Function, 2026 and 2036
  • Figure 11: Global Market Y-o-Y Growth Comparison by Consumer Need / Function, 2026 to 2036
  • Figure 12: Global Market Attractiveness Analysis by Consumer Need / Function
  • Figure 13: Global Market Value Share and BPS Analysis by Positioning / Label Claims, 2026 and 2036
  • Figure 14: Global Market Y-o-Y Growth Comparison by Positioning / Label Claims, 2026 to 2036
  • Figure 15: Global Market Attractiveness Analysis by Positioning / Label Claims
  • Figure 16: Global Market Value Share and BPS Analysis by Consumer Demographic, 2026 and 2036
  • Figure 17: Global Market Y-o-Y Growth Comparison by Consumer Demographic, 2026 to 2036
  • Figure 18: Global Market Attractiveness Analysis by Consumer Demographic
  • Figure 19: Global Market Value Share and BPS Analysis by Distribution Channel, 2026 and 2036
  • Figure 20: Global Market Y-o-Y Growth Comparison by Distribution Channel, 2026 to 2036
  • Figure 21: Global Market Attractiveness Analysis by Distribution Channel
  • Figure 22: Global Market Value (USD Mn) Share and BPS Analysis by Region, 2026 and 2036
  • Figure 23: Global Market Y-o-Y Growth Comparison by Region, 2026 to 2036
  • Figure 24: Global Market Attractiveness Analysis by Region
  • Figure 25: North America Market Incremental $ Opportunity, 2026 to 2036
  • Figure 26: Latin America Market Incremental $ Opportunity, 2026 to 2036
  • Figure 27: Western Europe Market Incremental $ Opportunity, 2026 to 2036
  • Figure 28: Eastern Europe Market Incremental $ Opportunity, 2026 to 2036
  • Figure 29: East Asia Market Incremental $ Opportunity, 2026 to 2036
  • Figure 30: South Asia and Pacific Market Incremental $ Opportunity, 2026 to 2036
  • Figure 31: Middle East & Africa Market Incremental $ Opportunity, 2026 to 2036
  • Figure 32: North America Market Value Share and BPS Analysis by Country, 2026 and 2036
  • Figure 33: North America Market Value Share and BPS Analysis by Ingredient Type, 2026 and 2036
  • Figure 34: North America Market Y-o-Y Growth Comparison by Ingredient Type, 2026 to 2036
  • Figure 35: North America Market Attractiveness Analysis by Ingredient Type
  • Figure 36: North America Market Value Share and BPS Analysis by Product Form, 2026 and 2036
  • Figure 37: North America Market Y-o-Y Growth Comparison by Product Form, 2026 to 2036
  • Figure 38: North America Market Attractiveness Analysis by Product Form
  • Figure 39: North America Market Value Share and BPS Analysis by Consumer Need / Function, 2026 and 2036
  • Figure 40: North America Market Y-o-Y Growth Comparison by Consumer Need / Function, 2026 to 2036
  • Figure 41: North America Market Attractiveness Analysis by Consumer Need / Function
  • Figure 42: North America Market Value Share and BPS Analysis by Positioning / Label Claims, 2026 and 2036
  • Figure 43: North America Market Y-o-Y Growth Comparison by Positioning / Label Claims, 2026 to 2036
  • Figure 44: North America Market Attractiveness Analysis by Positioning / Label Claims
  • Figure 45: North America Market Value Share and BPS Analysis by Consumer Demographic, 2026 and 2036
  • Figure 46: North America Market Y-o-Y Growth Comparison by Consumer Demographic, 2026 to 2036
  • Figure 47: North America Market Attractiveness Analysis by Consumer Demographic
  • Figure 48: North America Market Value Share and BPS Analysis by Distribution Channel, 2026 and 2036
  • Figure 49: North America Market Y-o-Y Growth Comparison by Distribution Channel, 2026 to 2036
  • Figure 50: North America Market Attractiveness Analysis by Distribution Channel
  • Figure 51: Latin America Market Value Share and BPS Analysis by Country, 2026 and 2036
  • Figure 52: Latin America Market Value Share and BPS Analysis by Ingredient Type, 2026 and 2036
  • Figure 53: Latin America Market Y-o-Y Growth Comparison by Ingredient Type, 2026 to 2036
  • Figure 54: Latin America Market Attractiveness Analysis by Ingredient Type
  • Figure 55: Latin America Market Value Share and BPS Analysis by Product Form, 2026 and 2036
  • Figure 56: Latin America Market Y-o-Y Growth Comparison by Product Form, 2026 to 2036
  • Figure 57: Latin America Market Attractiveness Analysis by Product Form
  • Figure 58: Latin America Market Value Share and BPS Analysis by Consumer Need / Function, 2026 and 2036
  • Figure 59: Latin America Market Y-o-Y Growth Comparison by Consumer Need / Function, 2026 to 2036
  • Figure 60: Latin America Market Attractiveness Analysis by Consumer Need / Function
  • Figure 61: Latin America Market Value Share and BPS Analysis by Positioning / Label Claims, 2026 and 2036
  • Figure 62: Latin America Market Y-o-Y Growth Comparison by Positioning / Label Claims, 2026 to 2036
  • Figure 63: Latin America Market Attractiveness Analysis by Positioning / Label Claims
  • Figure 64: Latin America Market Value Share and BPS Analysis by Consumer Demographic, 2026 and 2036
  • Figure 65: Latin America Market Y-o-Y Growth Comparison by Consumer Demographic, 2026 to 2036
  • Figure 66: Latin America Market Attractiveness Analysis by Consumer Demographic
  • Figure 67: Latin America Market Value Share and BPS Analysis by Distribution Channel, 2026 and 2036
  • Figure 68: Latin America Market Y-o-Y Growth Comparison by Distribution Channel, 2026 to 2036
  • Figure 69: Latin America Market Attractiveness Analysis by Distribution Channel
  • Figure 70: Western Europe Market Value Share and BPS Analysis by Country, 2026 and 2036
  • Figure 71: Western Europe Market Value Share and BPS Analysis by Ingredient Type, 2026 and 2036
  • Figure 72: Western Europe Market Y-o-Y Growth Comparison by Ingredient Type, 2026 to 2036
  • Figure 73: Western Europe Market Attractiveness Analysis by Ingredient Type
  • Figure 74: Western Europe Market Value Share and BPS Analysis by Product Form, 2026 and 2036
  • Figure 75: Western Europe Market Y-o-Y Growth Comparison by Product Form, 2026 to 2036
  • Figure 76: Western Europe Market Attractiveness Analysis by Product Form
  • Figure 77: Western Europe Market Value Share and BPS Analysis by Consumer Need / Function, 2026 and 2036
  • Figure 78: Western Europe Market Y-o-Y Growth Comparison by Consumer Need / Function, 2026 to 2036
  • Figure 79: Western Europe Market Attractiveness Analysis by Consumer Need / Function
  • Figure 80: Western Europe Market Value Share and BPS Analysis by Positioning / Label Claims, 2026 and 2036
  • Figure 81: Western Europe Market Y-o-Y Growth Comparison by Positioning / Label Claims, 2026 to 2036
  • Figure 82: Western Europe Market Attractiveness Analysis by Positioning / Label Claims
  • Figure 83: Western Europe Market Value Share and BPS Analysis by Consumer Demographic, 2026 and 2036
  • Figure 84: Western Europe Market Y-o-Y Growth Comparison by Consumer Demographic, 2026 to 2036
  • Figure 85: Western Europe Market Attractiveness Analysis by Consumer Demographic
  • Figure 86: Western Europe Market Value Share and BPS Analysis by Distribution Channel, 2026 and 2036
  • Figure 87: Western Europe Market Y-o-Y Growth Comparison by Distribution Channel, 2026 to 2036
  • Figure 88: Western Europe Market Attractiveness Analysis by Distribution Channel
  • Figure 89: Eastern Europe Market Value Share and BPS Analysis by Country, 2026 and 2036
  • Figure 90: Eastern Europe Market Value Share and BPS Analysis by Ingredient Type, 2026 and 2036
  • Figure 91: Eastern Europe Market Y-o-Y Growth Comparison by Ingredient Type, 2026 to 2036
  • Figure 92: Eastern Europe Market Attractiveness Analysis by Ingredient Type
  • Figure 93: Eastern Europe Market Value Share and BPS Analysis by Product Form, 2026 and 2036
  • Figure 94: Eastern Europe Market Y-o-Y Growth Comparison by Product Form, 2026 to 2036
  • Figure 95: Eastern Europe Market Attractiveness Analysis by Product Form
  • Figure 96: Eastern Europe Market Value Share and BPS Analysis by Consumer Need / Function, 2026 and 2036
  • Figure 97: Eastern Europe Market Y-o-Y Growth Comparison by Consumer Need / Function, 2026 to 2036
  • Figure 98: Eastern Europe Market Attractiveness Analysis by Consumer Need / Function
  • Figure 99: Eastern Europe Market Value Share and BPS Analysis by Positioning / Label Claims, 2026 and 2036
  • Figure 100: Eastern Europe Market Y-o-Y Growth Comparison by Positioning / Label Claims, 2026 to 2036
  • Figure 101: Eastern Europe Market Attractiveness Analysis by Positioning / Label Claims
  • Figure 102: Eastern Europe Market Value Share and BPS Analysis by Consumer Demographic, 2026 and 2036
  • Figure 103: Eastern Europe Market Y-o-Y Growth Comparison by Consumer Demographic, 2026 to 2036
  • Figure 104: Eastern Europe Market Attractiveness Analysis by Consumer Demographic
  • Figure 105: Eastern Europe Market Value Share and BPS Analysis by Distribution Channel, 2026 and 2036
  • Figure 106: Eastern Europe Market Y-o-Y Growth Comparison by Distribution Channel, 2026 to 2036
  • Figure 107: Eastern Europe Market Attractiveness Analysis by Distribution Channel
  • Figure 108: East Asia Market Value Share and BPS Analysis by Country, 2026 and 2036
  • Figure 109: East Asia Market Value Share and BPS Analysis by Ingredient Type, 2026 and 2036
  • Figure 110: East Asia Market Y-o-Y Growth Comparison by Ingredient Type, 2026 to 2036
  • Figure 111: East Asia Market Attractiveness Analysis by Ingredient Type
  • Figure 112: East Asia Market Value Share and BPS Analysis by Product Form, 2026 and 2036
  • Figure 113: East Asia Market Y-o-Y Growth Comparison by Product Form, 2026 to 2036
  • Figure 114: East Asia Market Attractiveness Analysis by Product Form
  • Figure 115: East Asia Market Value Share and BPS Analysis by Consumer Need / Function, 2026 and 2036
  • Figure 116: East Asia Market Y-o-Y Growth Comparison by Consumer Need / Function, 2026 to 2036
  • Figure 117: East Asia Market Attractiveness Analysis by Consumer Need / Function
  • Figure 118: East Asia Market Value Share and BPS Analysis by Positioning / Label Claims, 2026 and 2036
  • Figure 119: East Asia Market Y-o-Y Growth Comparison by Positioning / Label Claims, 2026 to 2036
  • Figure 120: East Asia Market Attractiveness Analysis by Positioning / Label Claims
  • Figure 121: East Asia Market Value Share and BPS Analysis by Consumer Demographic, 2026 and 2036
  • Figure 122: East Asia Market Y-o-Y Growth Comparison by Consumer Demographic, 2026 to 2036
  • Figure 123: East Asia Market Attractiveness Analysis by Consumer Demographic
  • Figure 124: East Asia Market Value Share and BPS Analysis by Distribution Channel, 2026 and 2036
  • Figure 125: East Asia Market Y-o-Y Growth Comparison by Distribution Channel, 2026 to 2036
  • Figure 126: East Asia Market Attractiveness Analysis by Distribution Channel
  • Figure 127: South Asia and Pacific Market Value Share and BPS Analysis by Country, 2026 and 2036
  • Figure 128: South Asia and Pacific Market Value Share and BPS Analysis by Ingredient Type, 2026 and 2036
  • Figure 129: South Asia and Pacific Market Y-o-Y Growth Comparison by Ingredient Type, 2026 to 2036
  • Figure 130: South Asia and Pacific Market Attractiveness Analysis by Ingredient Type
  • Figure 131: South Asia and Pacific Market Value Share and BPS Analysis by Product Form, 2026 and 2036
  • Figure 132: South Asia and Pacific Market Y-o-Y Growth Comparison by Product Form, 2026 to 2036
  • Figure 133: South Asia and Pacific Market Attractiveness Analysis by Product Form
  • Figure 134: South Asia and Pacific Market Value Share and BPS Analysis by Consumer Need / Function, 2026 and 2036
  • Figure 135: South Asia and Pacific Market Y-o-Y Growth Comparison by Consumer Need / Function, 2026 to 2036
  • Figure 136: South Asia and Pacific Market Attractiveness Analysis by Consumer Need / Function
  • Figure 137: South Asia and Pacific Market Value Share and BPS Analysis by Positioning / Label Claims, 2026 and 2036
  • Figure 138: South Asia and Pacific Market Y-o-Y Growth Comparison by Positioning / Label Claims, 2026 to 2036
  • Figure 139: South Asia and Pacific Market Attractiveness Analysis by Positioning / Label Claims
  • Figure 140: South Asia and Pacific Market Value Share and BPS Analysis by Consumer Demographic, 2026 and 2036
  • Figure 141: South Asia and Pacific Market Y-o-Y Growth Comparison by Consumer Demographic, 2026 to 2036
  • Figure 142: South Asia and Pacific Market Attractiveness Analysis by Consumer Demographic
  • Figure 143: South Asia and Pacific Market Value Share and BPS Analysis by Distribution Channel, 2026 and 2036
  • Figure 144: South Asia and Pacific Market Y-o-Y Growth Comparison by Distribution Channel, 2026 to 2036
  • Figure 145: South Asia and Pacific Market Attractiveness Analysis by Distribution Channel
  • Figure 146: Middle East & Africa Market Value Share and BPS Analysis by Country, 2026 and 2036
  • Figure 147: Middle East & Africa Market Value Share and BPS Analysis by Ingredient Type, 2026 and 2036
  • Figure 148: Middle East & Africa Market Y-o-Y Growth Comparison by Ingredient Type, 2026 to 2036
  • Figure 149: Middle East & Africa Market Attractiveness Analysis by Ingredient Type
  • Figure 150: Middle East & Africa Market Value Share and BPS Analysis by Product Form, 2026 and 2036
  • Figure 151: Middle East & Africa Market Y-o-Y Growth Comparison by Product Form, 2026 to 2036
  • Figure 152: Middle East & Africa Market Attractiveness Analysis by Product Form
  • Figure 153: Middle East & Africa Market Value Share and BPS Analysis by Consumer Need / Function, 2026 and 2036
  • Figure 154: Middle East & Africa Market Y-o-Y Growth Comparison by Consumer Need / Function, 2026 to 2036
  • Figure 155: Middle East & Africa Market Attractiveness Analysis by Consumer Need / Function
  • Figure 156: Middle East & Africa Market Value Share and BPS Analysis by Positioning / Label Claims, 2026 and 2036
  • Figure 157: Middle East & Africa Market Y-o-Y Growth Comparison by Positioning / Label Claims, 2026 to 2036
  • Figure 158: Middle East & Africa Market Attractiveness Analysis by Positioning / Label Claims
  • Figure 159: Middle East & Africa Market Value Share and BPS Analysis by Consumer Demographic, 2026 and 2036
  • Figure 160: Middle East & Africa Market Y-o-Y Growth Comparison by Consumer Demographic, 2026 to 2036
  • Figure 161: Middle East & Africa Market Attractiveness Analysis by Consumer Demographic
  • Figure 162: Middle East & Africa Market Value Share and BPS Analysis by Distribution Channel, 2026 and 2036
  • Figure 163: Middle East & Africa Market Y-o-Y Growth Comparison by Distribution Channel, 2026 to 2036
  • Figure 164: Middle East & Africa Market Attractiveness Analysis by Distribution Channel
  • Figure 165: Global Market – Tier Structure Analysis
  • Figure 166: Global Market – Company Share Analysis

Botanical Brain Concentrate Market