Cardiac Pacemaker Market Size, Share, Growth and Forecast (2026 - 2036)
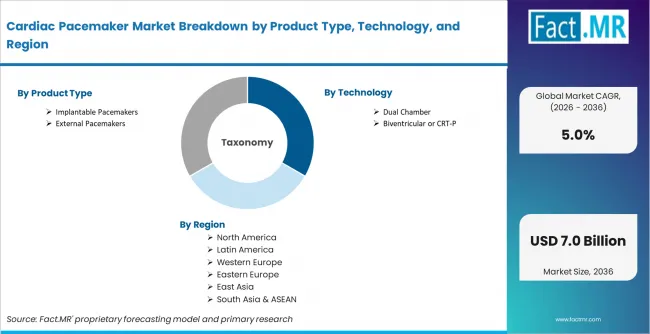
The Cardiac Pacemaker Market is segmented by Product Type, by Technology,by Pacing Indication, by End User, by Device Capability, and Region. Forecast for 2026 to 2036.
Fact.MR opines that cardiac pacemaker demand is shifting toward implantable devices with better monitoring and longer service life. Cardiologists need pacing systems that support safer rhythm correction. Hospitals require devices that fit complex cardiac procedures. Patients with slow or irregular heart rhythms need dependable pacing support.
Cardiac Pacemaker Market Size, Market Forecast and Outlook by Fact.MR
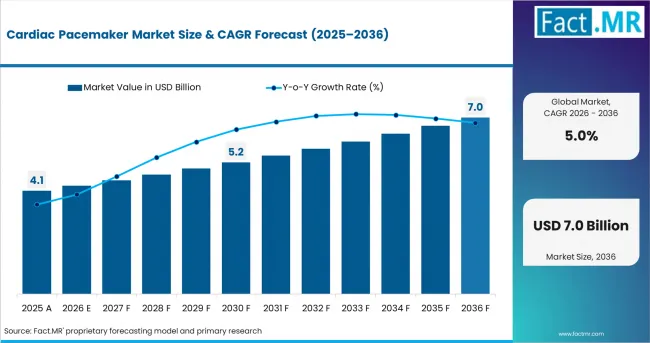
- The cardiac pacemaker market was valued at USD 4.1 billion in 2025.
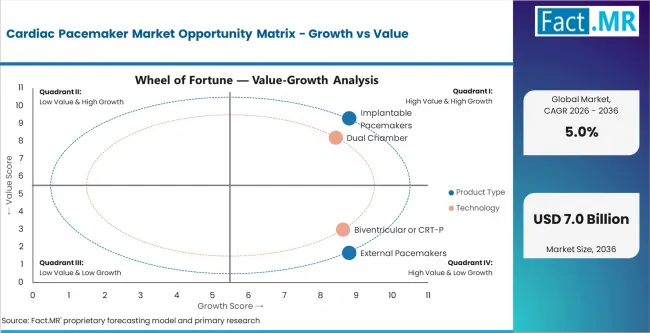
- The market is estimated at USD 4.3 billion in 2026 and is projected to reach USD 7.0 billion by 2036.
- The market is forecast to record 5.0% CAGR from 2026 to 2036 as cardiac rhythm care and device replacement demand support sales.
| Metric | Details |
|---|---|
| Industry Size 2026 | USD 4.3 billion |
| Industry Value 2036 | USD 7.0 billion |
| CAGR 2026 to 2036 | 5.0% |
Summary of the Cardiac Pacemaker Market
- Demand Drivers in the Market
- Cardiac Disease Burden: CDC reported 919,032 cardiovascular disease deaths. This burden supports continued need for cardiac rhythm care. [1]
- Remote Monitoring Need: Cardiologists need devices that support follow-up and patient tracking outside the hospital.
- Aging Patient Base: More age-related rhythm disorders are supporting steady pacemaker demand.
- Key Segments Analyzed
- By Product Type: Implantable pacemakers are expected to hold 80.0% share in 2026 as long-term rhythm correction needs permanent pacing support.
- By Technology: Dual chamber pacemakers lead as physicians need coordinated atrial and ventricular pacing. The segment is forecast to reach 45.0% share in 2026.
- By Pacing Indication: Bradycardia is expected to capture 54.0% share in 2026 as slow heart rhythm remains the main pacing need.
- By End User: Hospitals & cardiac centers are anticipated to lead with 84.0% share in 2026 as most implants require specialist cardiac units.
- By Device Capability: MRI-conditional pacemakers are expected to account for 58.0% share in 2026 as patients often need future imaging access.
- By Geography: India is forecast to grow at 6.0% CAGR through 2036 as cardiac care access improves across major hospitals.
- Analyst Opinion at Fact.MR
- Shambhu Nath Jha, Senior Analyst at Fact.MR, states, “Cardiac pacemaker demand is moving toward safer implantation and easier long-term follow-up. Hospitals are looking for devices that reduce procedural risk and support remote care. Suppliers that combine clinical proof with service depth can protect repeat demand.”
- Strategic Implications
- Clinical Training: Suppliers need physician education as leadless and newer pacing systems require procedural confidence.
- Remote Follow-Up: Hospitals should improve device monitoring workflows to reduce repeated in-person checks.
- Replacement Planning: Cardiac centers need better tracking of battery life and device performance across installed patients.
Cardiac pacemaker demand is rising as hospitals treat more patients with rhythm disorders and age-related heart conditions. Cardiologists need devices with reliable pacing and fewer follow-up challenges. Remote monitoring is becoming more important in long-term cardiac care. Product strategy now focuses on smaller devices and longer battery life.
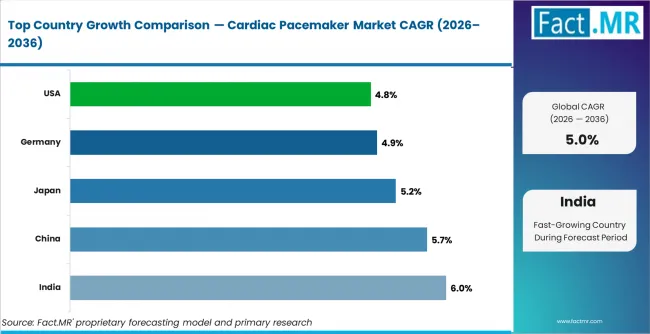
India is forecast to grow at 6.0% CAGR from 2026 to 2036 as cardiac care access improves in private and public hospitals. China is set to rise at 5.7% CAGR through rhythm care expansion and local device availability. Japan is forecast at 5.2% CAGR as aging patients support pacing procedures. Germany is projected to record 4.9% CAGR through hospital-based cardiac care. The United States is likely to post 4.8% CAGR due to rhythm management access.
Segmental Analysis
Cardiac Pacemaker Market Analysis by Product Type
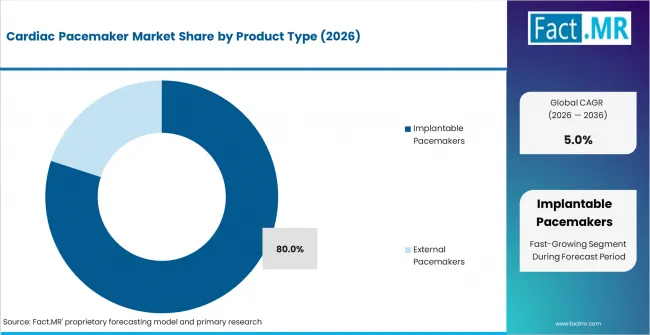
Implantable pacemakers are expected to hold 80.0% share in 2026 as long-term rhythm correction needs permanent pacing support. Implantable pacemakers lead as patients with chronic bradycardia require continuous therapy. Cardiologists use these devices to maintain dependable heart rhythm after diagnosis. Battery life and follow-up support become important after implantation.
- Long-Term Therapy: Implantable pacemakers support continuous rhythm correction. This makes them central to chronic bradycardia care.
- Patient Stability: Permanent pacing improves rhythm control after device placement. This supports hospital treatment planning.
- Follow-Up Need: Implanted patients require regular device checks. Remote monitoring can reduce avoidable clinic visits.
Cardiac Pacemaker Market Analysis by Technology
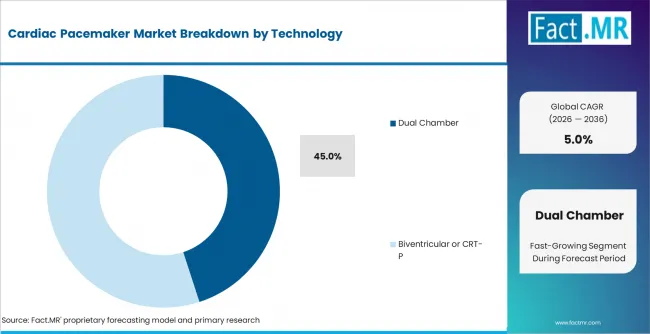
Dual chamber pacemakers lead as physicians need coordinated atrial and ventricular pacing. The segment is anticipated to capture 45.0% share in 2026. Dual chamber pacing supports more natural rhythm control for selected patients. The technology remains important in hospital-based procedures as cardiologists match pacing mode with conduction needs.
- Coordinated Pacing: Dual chamber devices support atrial and ventricular timing. This helps physicians manage rhythm more precisely.
- Clinical Fit: Dual chamber pacing suits patients who need broader rhythm support. This improves therapy selection.
- Procedure Value: Hospitals use dual chamber systems in complex cases. Specialist training supports proper device selection.
Cardiac Pacemaker Market Analysis by Pacing Indication
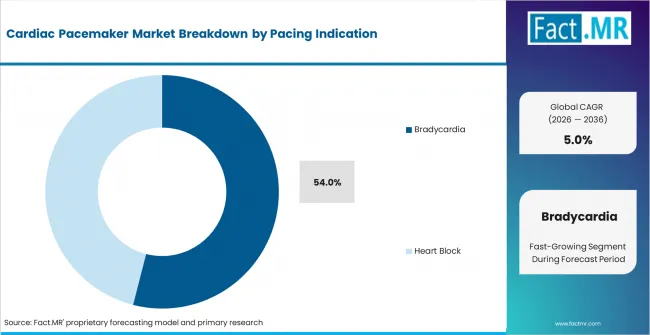
Bradycardia is expected to account for 54.0% share in 2026 as slow heart rhythm remains the main pacing need. Bradycardia leads as pacemakers are commonly used to restore a dependable heartbeat. Diagnosis often moves patients toward permanent pacing once symptoms affect daily function. Device choice becomes important as long-term rhythm support must match patient activity and follow-up needs.
- Slow Rhythm Care: Bradycardia creates the core need for pacing therapy. Pacemakers help maintain a stable heartbeat.
- Symptom Relief: Patients with dizziness or fainting may need rhythm support. Pacing can improve daily function.
- Therapy Matching: Cardiologists match device type with conduction problem. This supports safer long-term care.
Cardiac Pacemaker Market Analysis by End User
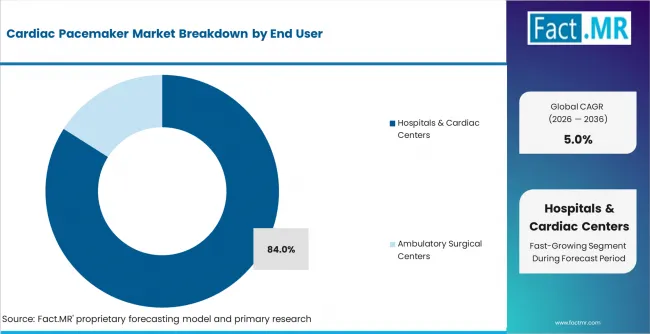
Hospitals & cardiac centers lead as pacemaker procedures need specialist cardiac units. The segment is forecast to account for 84.0% share in 2026. Most implants require trained staff, cardiac monitoring infrastructure and device programming support. Heart Foundation stated in April 2025 that permanent pacemaker insertion takes place in a special operating theatre, with hospital staff attaching patients to heart monitors before the procedure. It also stated that the doctor programs the pacemaker and tests it during insertion. [3] Emergency care access also makes hospitals the preferred setting for pacemaker placement. Post-implant follow-up often depends on hospital-linked rhythm management services.
- Specialist Units: Hospitals provide cardiac labs and trained implant teams. This supports pacemaker procedure volume.
- Device Programming: Cardiac centers manage post-implant device settings. This helps maintain therapy quality.
- Emergency Support: Hospitals can manage complications faster. This improves procedural confidence.
Cardiac Pacemaker Market Analysis by Device Capability
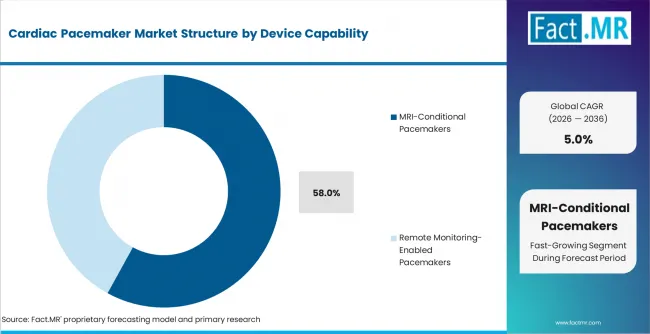
MRI-conditional pacemakers are expected to account for 58.0% share in 2026 as patients often need future imaging access. MRI-conditional devices lead as physicians prefer pacing systems that preserve diagnostic options. Patients with long-term implants may require MRI scans later in life. Compatibility becomes important during device selection because it reduces imaging restrictions after implantation.
- Imaging Access: MRI-conditional devices help patients retain future scan options. This improves long-term care flexibility.
- Clinical Preference: Physicians prefer systems that reduce diagnostic limits. This supports wider hospital adoption.
- Patient Planning: Long device life raises the chance of future imaging needs. MRI access supports safer care planning.
Cardiac Pacemaker Market Drivers, Restraints, and Opportunities
Aging populations and cardiac rhythm disorders support pacemaker demand. Hospitals need devices that improve rhythm correction and reduce follow-up burden.
Device malfunction risk and recall concerns can slow adoption. Hospitals review product performance records before choosing suppliers. Boston Scientific publishes rhythm management product performance data for implanted cardiac devices. [2] This helps hospitals assess device reliability during supplier selection.
Opportunities in the Cardiac Pacemaker Market
- Leadless Pacing: Hospitals can expand leadless pacing use as physician training and clinical confidence improve.
- Remote Monitoring: Device makers can support follow-up through connected care systems and patient monitoring platforms.
- Access Expansion: Suppliers can expand in India and China as hospital cardiac care infrastructure improves.
Regional Analysis
Based on regional analysis, the cardiac pacemaker market is segmented into North America, Latin America, Western Europe, Eastern Europe, East Asia, South Asia and Pacific, and Middle East and Africa.
.webp)
| Country | CAGR 2026 to 2036 |
|---|---|
| India | 6.0% |
| China | 5.7% |
| Japan | 5.2% |
| Germany | 4.9% |
| United States | 4.8% |
Source: Fact.MR analysis and primary research.
South Asia and Pacific Cardiac Pacemaker Market Analysis
South Asia and Pacific demand is led by India. Hospital infrastructure and private cardiac care networks support pacemaker procedures. Device access is improving through specialist cardiac centers. Patient affordability still affects higher-priced device adoption.
- India: India is forecast to grow at 6.0% CAGR by 2036 as cardiac care access improves across major hospitals. Abbott launched AVEIR DR in India in October 2025 and described it as a dual chamber leadless pacemaker system. [4] Private hospitals are adopting leadless rhythm management tools in large cities. Public hospitals are gradually improving access to cardiac procedures. Cost remains a barrier for higher-priced devices. Suppliers that support physician training and service coverage can expand in metro and tier-one care centers.
East Asia Cardiac Pacemaker Market Analysis
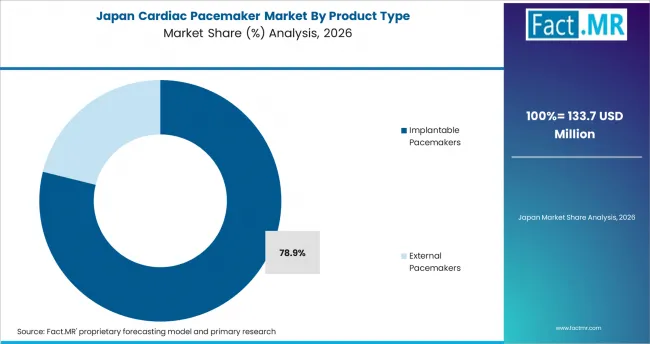
East Asia demand is led by China and Japan. China has a growing rhythm care base and expanding local device production. Japan has an aging population and established hospital cardiac services. Local approval pathways and hospital purchasing processes influence supplier access.
- China: Cardiac rhythm care is expanding across major hospitals in China. The market is forecast to record 5.7% CAGR from 2026 to 2036. MicroPort CRM launched the localized TEN pacemaker family in China in 2025. [5] Local product availability can improve hospital access and reduce reliance on imported devices. Larger urban hospitals are likely to adopt newer pacing systems first. Physician training will affect uptake of newer device types. Suppliers with domestic production and clinical support can gain a better market position.
- Japan: Japan is forecast at 5.2% CAGR over the assessment period as aging patients support pacemaker procedures. Hospitals need devices that support stable rhythm correction and future diagnostic flexibility. MRI-conditional systems fit well with long-term patient care. Japanese clinicians place strong weight on device reliability and documentation. Supplier access depends on post-implant support and remote monitoring workflows. Demand will favor devices with long battery life and strong safety records.
Western Europe Cardiac Pacemaker Market Analysis
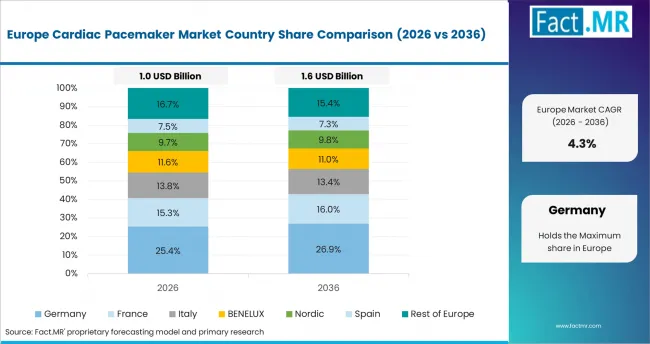
Western Europe demand is supported by specialist cardiac centers and replacement procedures. Germany leads through hospital-based electrophysiology care. Device evaluation focuses on safety records and service support.
- Germany: Germany is projected to record 4.9% CAGR through 2036 as hospital-based cardiac rhythm care supports pacemaker demand. German cardiac centers use specialist implants and follow-up systems for rhythm management. MRI access and remote monitoring are important selection factors for long-term patients. Hospitals review device performance and supplier support before standardizing products. Leadless pacing can gain in selected cases as physician experience improves. Suppliers with reliable training and service programs can protect hospital relationships.
North America Cardiac Pacemaker Market Analysis
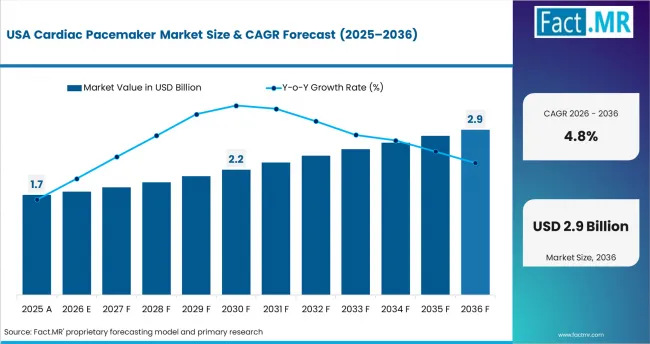
North America demand is led by the United States. The region has cardiac rhythm management infrastructure and strong presence of major device companies. FDA approvals support uptake of leadless pacing systems. Hospitals place high weight on product performance and post-market reporting.
- United States: Rhythm management access is supporting pacemaker demand across the United States. The country is likely to post 4.8% CAGR over the study period. Hospitals evaluate battery life and safety records before selecting devices. Remote monitoring supports long-term patient management and helps clinicians track device performance after implantation.
Competitive Analysis for Market Suppliers
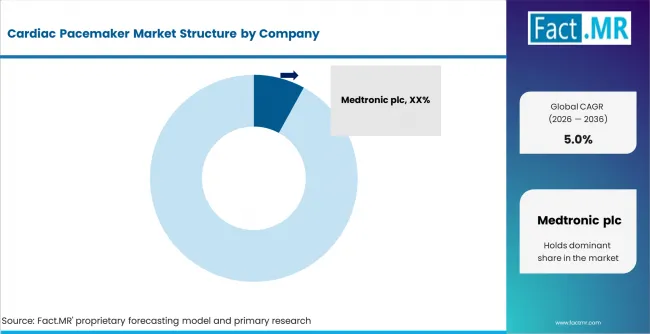
The cardiac pacemaker market includes large cardiac rhythm management firms and specialized pacing companies. Medtronic plc supports demand through leadless and conventional pacemaker systems. Abbott Laboratories expanded its portfolio with AVEIR DR approval and launched the dual-chamber leadless pacemaker in India in 2025. Boston Scientific Corporation supports hospital selection through rhythm management product performance reporting.
Competition depends on device reliability, clinical training and service support. Hospitals need pacemakers with strong performance records and clear follow-up support. Cardiologists also need supplier training because device programming and monitoring affect patient care.
Supplier strength through 2036 will depend on clinical proof and replacement support. Companies with reliable devices, remote monitoring capability and strong hospital service can protect repeat demand.
Key Players in Cardiac Pacemaker Market
- Medtronic plc
- Abbott Laboratories
- Boston Scientific Corporation
- BIOTRONIK SE & Co. KG
- MicroPort Scientific Corporation
- Shree Pacetronix Limited
Bibliography
- [1] Centers for Disease Control and Prevention. (2024, October 24). Heart disease facts. CDC.
- [2] Boston Scientific Corporation. (2025, August 25). Rhythm Management Product Performance Report 2025 Second Edition. Boston Scientific Corporation.
- [3] Heart Foundation. (2025, April 9). Permanent pacemaker (PPM). Heart Foundation.
- [4] Abbott Laboratories. (2025, October 6). Abbott launches AVEIR DR, the world’s first dual-chamber leadless pacemaker in India. Abbott Laboratories.
- [5] MicroPort Scientific Corporation. (2025, March). MicroPort CRM launches localized TEN pacemaker family in China. MicroPort Scientific Corporation.
This Report Addresses
- Strategic intelligence on cardiac pacemaker demand across implantable and external devices.
- Opportunity mapping across India and China plus the United States and Japan.
- Segment analysis by product type and technology plus indication and end user.
- Regional outlook covering leadless pacing and hospital cardiac procedure access.
- Competitive analysis of Medtronic and Abbott plus Boston Scientific and MicroPort.
- Product assessment covering implantable pacemakers and MRI-conditional devices.
- Market forecast built from Fact.MR’s baseline with 2026 to 2036 CAGR.
- Primary interviews and supplier checks support validation.
Cardiac Pacemaker Market Definition
The cardiac pacemaker market covers medical devices that deliver electrical impulses to maintain heart rhythm in patients with slow or irregular heartbeat. The scope includes implantable and external pacemakers used in cardiac rhythm management. These devices are used in hospitals and specialized care facilities.
Cardiac Pacemaker Market Inclusions
The scope includes implantable pacemakers and external pacemakers used for temporary or permanent pacing. Single chamber and leadless pacemakers are included. MRI-conditional devices and remote monitoring-enabled pacemakers are counted when used for cardiac rhythm management.
Cardiac Pacemaker Market Exclusions
The scope excludes implantable cardioverter defibrillators unless sold as part of a pacing-specific system. Standalone cardiac monitors are outside scope. Ablation devices and diagnostic ECG systems are excluded as they do not deliver pacing therapy. General cardiac implants without pacing function are not counted.
Cardiac Pacemaker Market Research Methodology
- Primary Research:
- Primary research includes interviews with electrophysiologists and cardiac device coordinators. Hospital procurement departments were reviewed separately.
- Desk Research:
- Desk research reviews FDA approvals and company cardiac rhythm product sources. Clinical device documentation and product performance reports support supplier validation.
- Market-Sizing and Forecasting:
- Forecasting uses product type demand and technology adoption. Pacing indication and end-user demand support the forecast.
- Data Validation and Update Cycle:
- Forecasts are validated through hospital interviews and supplier checks. Regional assumptions are reviewed with device approvals and cardiac care access.
Scope of the Report

| Attribute | Details |
|---|---|
| Quantitative Units | USD 4.3 billion in 2026 to USD 7.0 billion by 2036 at 5.0% CAGR |
| Market Definition | Devices used to deliver electrical impulses for cardiac rhythm correction. |
| Product Type | Implantable Pacemakers / External Pacemakers |
| Technology | Single Chamber / Dual Chamber / Biventricular or CRT-P / Leadless |
| Pacing Indication | Bradycardia / Heart Block / Heart Failure / Other Rhythm Disorders |
| End User | Hospitals & Cardiac Centers / Ambulatory Surgical Centers / Specialty Cardiology Clinics |
| Device Capability | MRI-Conditional Pacemakers / Remote Monitoring-Enabled Pacemakers / Conventional Pacemakers |
| Regions Covered | North America / Latin America / Western Europe / Eastern Europe / East Asia / South Asia and Pacific / Middle East and Africa |
| Countries Covered | India / China / Japan / Germany / United States / United Kingdom / Brazil |
| Key Companies Profiled | Medtronic plc / Abbott Laboratories / Boston Scientific Corporation / BIOTRONIK SE & Co. KG / MicroPort Scientific Corporation / Shree Pacetronix Limited |
| Forecast Period | 2026 to 2036 |
| Approach | Hybrid top-down and bottom-up approach using product type demand, technology adoption, pacing indication, end-user demand, device capability, and supplier validation. |
Cardiac Pacemaker Market Analysis by Segments
-
By Product Type:
- Implantable Pacemakers
- External Pacemakers
-
By Technology:
- Single Chamber
- Dual Chamber
- Biventricular or CRT-P
- Leadless
-
By Pacing Indication:
- Bradycardia
- Heart Block
- Heart Failure
- Other Rhythm Disorders
-
By End User:
- Hospitals & Cardiac Centers
- Ambulatory Surgical Centers
- Specialty Cardiology Clinics
-
By Device Capability:
- MRI-Conditional Pacemakers
- Remote Monitoring-Enabled Pacemakers
- Conventional Pacemakers
-
Region:
- North America
- United States
- Canada
- Mexico
- Europe
- Germany
- United Kingdom
- France
- Italy
- Spain
- East Asia
- China
- Japan
- South Korea
- South Asia and Pacific
- India
- ASEAN
- Australia and New Zealand
- Latin America
- Brazil
- Mexico
- Argentina
- Middle East and Africa
- GCC Countries
- South Africa
- Turkey
- North America
- Frequently Asked Questions -
What is the cardiac pacemaker market size in 2024?
The global cardiac pacemaker market is estimated at US$ 3.92 billion in 2024.
What is the sales projection for cardiac pacemakers for 2034?
By 2034-end, worldwide sales of cardiac pacemakers are forecasted to reach US$ 6.15 billion.
How fast is the demand for cardiac pacemakers projected to increase?
Demand for cardiac pacemakers is forecasted to rise at 4.6% CAGR from 2024 to 2034.
At what pace is the North American market growing?
The North American market is projected to expand at 4.6% CAGR from 2024 to 2034.
At what rate is the use of cardiac pacemakers projected to increase in hospitals?
Use of cardiac pacemakers in hospitals is forecasted to increase at a CAGR of 4.5% from 2024 to 2034.
Table of Content
- Executive Summary
- Global Market Outlook
- Demand to side Trends
- Supply to side Trends
- Technology Roadmap Analysis
- Analysis and Recommendations
- Market Overview
- Market Coverage / Taxonomy
- Market Definition / Scope / Limitations
- Research Methodology
- Chapter Orientation
- Analytical Lens and Working Hypotheses
- Market Structure, Signals, and Trend Drivers
- Benchmarking and Cross-market Comparability
- Market Sizing, Forecasting, and Opportunity Mapping
- Research Design and Evidence Framework
- Desk Research Programme (Secondary Evidence)
- Company Annual and Sustainability Reports
- Peer-reviewed Journals and Academic Literature
- Corporate Websites, Product Literature, and Technical Notes
- Earnings Decks and Investor Briefings
- Statutory Filings and Regulatory Disclosures
- Technical White Papers and Standards Notes
- Trade Journals, Industry Magazines, and Analyst Briefs
- Conference Proceedings, Webinars, and Seminar Materials
- Government Statistics Portals and Public Data Releases
- Press Releases and Reputable Media Coverage
- Specialist Newsletters and Curated Briefings
- Sector Databases and Reference Repositories
- Fact.MR Internal Proprietary Databases and Historical Market Datasets
- Subscription Datasets and Paid Sources
- Social Channels, Communities, and Digital Listening Inputs
- Additional Desk Sources
- Expert Input and Fieldwork (Primary Evidence)
- Primary Modes
- Qualitative Interviews and Expert Elicitation
- Quantitative Surveys and Structured Data Capture
- Blended Approach
- Why Primary Evidence is Used
- Field Techniques
- Interviews
- Surveys
- Focus Groups
- Observational and In-context Research
- Social and Community Interactions
- Stakeholder Universe Engaged
- C-suite Leaders
- Board Members
- Presidents and Vice Presidents
- R&D and Innovation Heads
- Technical Specialists
- Domain Subject-matter Experts
- Scientists
- Physicians and Other Healthcare Professionals
- Governance, Ethics, and Data Stewardship
- Research Ethics
- Data Integrity and Handling
- Primary Modes
- Tooling, Models, and Reference Databases
- Desk Research Programme (Secondary Evidence)
- Data Engineering and Model Build
- Data Acquisition and Ingestion
- Cleaning, Normalisation, and Verification
- Synthesis, Triangulation, and Analysis
- Quality Assurance and Audit Trail
- Market Background
- Market Dynamics
- Drivers
- Restraints
- Opportunity
- Trends
- Scenario Forecast
- Demand in Optimistic Scenario
- Demand in Likely Scenario
- Demand in Conservative Scenario
- Opportunity Map Analysis
- Product Life Cycle Analysis
- Supply Chain Analysis
- Investment Feasibility Matrix
- Value Chain Analysis
- PESTLE and Porter’s Analysis
- Regulatory Landscape
- Regional Parent Market Outlook
- Production and Consumption Statistics
- Import and Export Statistics
- Market Dynamics
- Global Market Analysis 2021 to 2025 and Forecast, 2026 to 2036
- Historical Market Size Value (USD Million) Analysis, 2021 to 2025
- Current and Future Market Size Value (USD Million) Projections, 2026 to 2036
- Y to o to Y Growth Trend Analysis
- Absolute $ Opportunity Analysis
- Global Market Pricing Analysis 2021 to 2025 and Forecast 2026 to 2036
- Global Market Analysis 2021 to 2025 and Forecast 2026 to 2036, By Product Type
- Introduction / Key Findings
- Historical Market Size Value (USD Million) Analysis By Product Type , 2021 to 2025
- Current and Future Market Size Value (USD Million) Analysis and Forecast By Product Type , 2026 to 2036
- Implantable Pacemakers
- External Pacemakers
- Implantable Pacemakers
- Y to o to Y Growth Trend Analysis By Product Type , 2021 to 2025
- Absolute $ Opportunity Analysis By Product Type , 2026 to 2036
- Global Market Analysis 2021 to 2025 and Forecast 2026 to 2036, By Technology
- Introduction / Key Findings
- Historical Market Size Value (USD Million) Analysis By Technology, 2021 to 2025
- Current and Future Market Size Value (USD Million) Analysis and Forecast By Technology, 2026 to 2036
- Dual Chamber
- Biventricular or CRT-P
- Leadless
- Single Chamber
- Dual Chamber
- Y to o to Y Growth Trend Analysis By Technology, 2021 to 2025
- Absolute $ Opportunity Analysis By Technology, 2026 to 2036
- Global Market Analysis 2021 to 2025 and Forecast 2026 to 2036, By Pacing Indication
- Introduction / Key Findings
- Historical Market Size Value (USD Million) Analysis By Pacing Indication, 2021 to 2025
- Current and Future Market Size Value (USD Million) Analysis and Forecast By Pacing Indication, 2026 to 2036
- Bradycardia
- Heart Block
- Heart Failure
- Other Rhythm Disorders
- Bradycardia
- Y to o to Y Growth Trend Analysis By Pacing Indication, 2021 to 2025
- Absolute $ Opportunity Analysis By Pacing Indication, 2026 to 2036
- Global Market Analysis 2021 to 2025 and Forecast 2026 to 2036, By End User
- Introduction / Key Findings
- Historical Market Size Value (USD Million) Analysis By End User, 2021 to 2025
- Current and Future Market Size Value (USD Million) Analysis and Forecast By End User, 2026 to 2036
- Hospitals & Cardiac Centers
- Ambulatory Surgical Centers
- Specialty Cardiology Clinics
- Hospitals & Cardiac Centers
- Y to o to Y Growth Trend Analysis By End User, 2021 to 2025
- Absolute $ Opportunity Analysis By End User, 2026 to 2036
- Global Market Analysis 2021 to 2025 and Forecast 2026 to 2036, By Device Capability
- Introduction / Key Findings
- Historical Market Size Value (USD Million) Analysis By Device Capability, 2021 to 2025
- Current and Future Market Size Value (USD Million) Analysis and Forecast By Device Capability, 2026 to 2036
- MRI-Conditional Pacemakers
- Remote Monitoring-Enabled Pacemakers
- Conventional Pacemakers
- MRI-Conditional Pacemakers
- Y to o to Y Growth Trend Analysis By Device Capability, 2021 to 2025
- Absolute $ Opportunity Analysis By Device Capability, 2026 to 2036
- Global Market Analysis 2021 to 2025 and Forecast 2026 to 2036, By Region
- Introduction
- Historical Market Size Value (USD Million) Analysis By Region, 2021 to 2025
- Current Market Size Value (USD Million) Analysis and Forecast By Region, 2026 to 2036
- North America
- Latin America
- Western Europe
- Eastern Europe
- East Asia
- South Asia and Pacific
- Middle East & Africa
- Market Attractiveness Analysis By Region
- North America Market Analysis 2021 to 2025 and Forecast 2026 to 2036, By Country
- Historical Market Size Value (USD Million) Trend Analysis By Market Taxonomy, 2021 to 2025
- Market Size Value (USD Million) Forecast By Market Taxonomy, 2026 to 2036
- By Country
- USA
- Canada
- Mexico
- By Product Type
- By Technology
- By Pacing Indication
- By End User
- By Device Capability
- By Country
- Market Attractiveness Analysis
- By Country
- By Product Type
- By Technology
- By Pacing Indication
- By End User
- By Device Capability
- Key Takeaways
- Latin America Market Analysis 2021 to 2025 and Forecast 2026 to 2036, By Country
- Historical Market Size Value (USD Million) Trend Analysis By Market Taxonomy, 2021 to 2025
- Market Size Value (USD Million) Forecast By Market Taxonomy, 2026 to 2036
- By Country
- Brazil
- Chile
- Rest of Latin America
- By Product Type
- By Technology
- By Pacing Indication
- By End User
- By Device Capability
- By Country
- Market Attractiveness Analysis
- By Country
- By Product Type
- By Technology
- By Pacing Indication
- By End User
- By Device Capability
- Key Takeaways
- Western Europe Market Analysis 2021 to 2025 and Forecast 2026 to 2036, By Country
- Historical Market Size Value (USD Million) Trend Analysis By Market Taxonomy, 2021 to 2025
- Market Size Value (USD Million) Forecast By Market Taxonomy, 2026 to 2036
- By Country
- Germany
- UK
- Italy
- Spain
- France
- Nordic
- BENELUX
- Rest of Western Europe
- By Product Type
- By Technology
- By Pacing Indication
- By End User
- By Device Capability
- By Country
- Market Attractiveness Analysis
- By Country
- By Product Type
- By Technology
- By Pacing Indication
- By End User
- By Device Capability
- Key Takeaways
- Eastern Europe Market Analysis 2021 to 2025 and Forecast 2026 to 2036, By Country
- Historical Market Size Value (USD Million) Trend Analysis By Market Taxonomy, 2021 to 2025
- Market Size Value (USD Million) Forecast By Market Taxonomy, 2026 to 2036
- By Country
- Russia
- Poland
- Hungary
- Balkan & Baltic
- Rest of Eastern Europe
- By Product Type
- By Technology
- By Pacing Indication
- By End User
- By Device Capability
- By Country
- Market Attractiveness Analysis
- By Country
- By Product Type
- By Technology
- By Pacing Indication
- By End User
- By Device Capability
- Key Takeaways
- East Asia Market Analysis 2021 to 2025 and Forecast 2026 to 2036, By Country
- Historical Market Size Value (USD Million) Trend Analysis By Market Taxonomy, 2021 to 2025
- Market Size Value (USD Million) Forecast By Market Taxonomy, 2026 to 2036
- By Country
- China
- Japan
- South Korea
- By Product Type
- By Technology
- By Pacing Indication
- By End User
- By Device Capability
- By Country
- Market Attractiveness Analysis
- By Country
- By Product Type
- By Technology
- By Pacing Indication
- By End User
- By Device Capability
- Key Takeaways
- South Asia and Pacific Market Analysis 2021 to 2025 and Forecast 2026 to 2036, By Country
- Historical Market Size Value (USD Million) Trend Analysis By Market Taxonomy, 2021 to 2025
- Market Size Value (USD Million) Forecast By Market Taxonomy, 2026 to 2036
- By Country
- India
- ASEAN
- Australia & New Zealand
- Rest of South Asia and Pacific
- By Product Type
- By Technology
- By Pacing Indication
- By End User
- By Device Capability
- By Country
- Market Attractiveness Analysis
- By Country
- By Product Type
- By Technology
- By Pacing Indication
- By End User
- By Device Capability
- Key Takeaways
- Middle East & Africa Market Analysis 2021 to 2025 and Forecast 2026 to 2036, By Country
- Historical Market Size Value (USD Million) Trend Analysis By Market Taxonomy, 2021 to 2025
- Market Size Value (USD Million) Forecast By Market Taxonomy, 2026 to 2036
- By Country
- Kingdom of Saudi Arabia
- Other GCC Countries
- Turkiye
- South Africa
- Other African Union
- Rest of Middle East & Africa
- By Product Type
- By Technology
- By Pacing Indication
- By End User
- By Device Capability
- By Country
- Market Attractiveness Analysis
- By Country
- By Product Type
- By Technology
- By Pacing Indication
- By End User
- By Device Capability
- Key Takeaways
- Key Countries Market Analysis
- USA
- Pricing Analysis
- Market Share Analysis, 2025
- By Product Type
- By Technology
- By Pacing Indication
- By End User
- By Device Capability
- Canada
- Pricing Analysis
- Market Share Analysis, 2025
- By Product Type
- By Technology
- By Pacing Indication
- By End User
- By Device Capability
- Mexico
- Pricing Analysis
- Market Share Analysis, 2025
- By Product Type
- By Technology
- By Pacing Indication
- By End User
- By Device Capability
- Brazil
- Pricing Analysis
- Market Share Analysis, 2025
- By Product Type
- By Technology
- By Pacing Indication
- By End User
- By Device Capability
- Chile
- Pricing Analysis
- Market Share Analysis, 2025
- By Product Type
- By Technology
- By Pacing Indication
- By End User
- By Device Capability
- Germany
- Pricing Analysis
- Market Share Analysis, 2025
- By Product Type
- By Technology
- By Pacing Indication
- By End User
- By Device Capability
- UK
- Pricing Analysis
- Market Share Analysis, 2025
- By Product Type
- By Technology
- By Pacing Indication
- By End User
- By Device Capability
- Italy
- Pricing Analysis
- Market Share Analysis, 2025
- By Product Type
- By Technology
- By Pacing Indication
- By End User
- By Device Capability
- Spain
- Pricing Analysis
- Market Share Analysis, 2025
- By Product Type
- By Technology
- By Pacing Indication
- By End User
- By Device Capability
- France
- Pricing Analysis
- Market Share Analysis, 2025
- By Product Type
- By Technology
- By Pacing Indication
- By End User
- By Device Capability
- India
- Pricing Analysis
- Market Share Analysis, 2025
- By Product Type
- By Technology
- By Pacing Indication
- By End User
- By Device Capability
- ASEAN
- Pricing Analysis
- Market Share Analysis, 2025
- By Product Type
- By Technology
- By Pacing Indication
- By End User
- By Device Capability
- Australia & New Zealand
- Pricing Analysis
- Market Share Analysis, 2025
- By Product Type
- By Technology
- By Pacing Indication
- By End User
- By Device Capability
- China
- Pricing Analysis
- Market Share Analysis, 2025
- By Product Type
- By Technology
- By Pacing Indication
- By End User
- By Device Capability
- Japan
- Pricing Analysis
- Market Share Analysis, 2025
- By Product Type
- By Technology
- By Pacing Indication
- By End User
- By Device Capability
- South Korea
- Pricing Analysis
- Market Share Analysis, 2025
- By Product Type
- By Technology
- By Pacing Indication
- By End User
- By Device Capability
- Russia
- Pricing Analysis
- Market Share Analysis, 2025
- By Product Type
- By Technology
- By Pacing Indication
- By End User
- By Device Capability
- Poland
- Pricing Analysis
- Market Share Analysis, 2025
- By Product Type
- By Technology
- By Pacing Indication
- By End User
- By Device Capability
- Hungary
- Pricing Analysis
- Market Share Analysis, 2025
- By Product Type
- By Technology
- By Pacing Indication
- By End User
- By Device Capability
- Kingdom of Saudi Arabia
- Pricing Analysis
- Market Share Analysis, 2025
- By Product Type
- By Technology
- By Pacing Indication
- By End User
- By Device Capability
- Turkiye
- Pricing Analysis
- Market Share Analysis, 2025
- By Product Type
- By Technology
- By Pacing Indication
- By End User
- By Device Capability
- South Africa
- Pricing Analysis
- Market Share Analysis, 2025
- By Product Type
- By Technology
- By Pacing Indication
- By End User
- By Device Capability
- USA
- Market Structure Analysis
- Competition Dashboard
- Competition Benchmarking
- Market Share Analysis of Top Players
- By Regional
- By Product Type
- By Technology
- By Pacing Indication
- By End User
- By Device Capability
- Competition Analysis
- Competition Deep Dive
- Medtronic plc
- Overview
- Product Portfolio
- Profitability by Market Segments (Product/Age /Sales Channel/Region)
- Sales Footprint
- Strategy Overview
- Marketing Strategy
- Product Strategy
- Channel Strategy
- Abbott Laboratories
- Boston Scientific Corporation
- BIOTRONIK SE & Co. KG
- MicroPort Scientific Corporation
- Shree Pacetronix Limited
- Medtronic plc
- Competition Deep Dive
- Assumptions & Acronyms Used
List Of Table
- Table 1: Global Market Value (USD Million) Forecast by Region, 2021 to 2036
- Table 2: Global Market Value (USD Million) Forecast by Product Type, 2021 to 2036
- Table 3: Global Market Value (USD Million) Forecast by Technology, 2021 to 2036
- Table 4: Global Market Value (USD Million) Forecast by Pacing Indication, 2021 to 2036
- Table 5: Global Market Value (USD Million) Forecast by End User, 2021 to 2036
- Table 6: Global Market Value (USD Million) Forecast by Device Capability, 2021 to 2036
- Table 7: North America Market Value (USD Million) Forecast by Country, 2021 to 2036
- Table 8: North America Market Value (USD Million) Forecast by Product Type, 2021 to 2036
- Table 9: North America Market Value (USD Million) Forecast by Technology, 2021 to 2036
- Table 10: North America Market Value (USD Million) Forecast by Pacing Indication, 2021 to 2036
- Table 11: North America Market Value (USD Million) Forecast by End User, 2021 to 2036
- Table 12: North America Market Value (USD Million) Forecast by Device Capability, 2021 to 2036
- Table 13: Latin America Market Value (USD Million) Forecast by Country, 2021 to 2036
- Table 14: Latin America Market Value (USD Million) Forecast by Product Type, 2021 to 2036
- Table 15: Latin America Market Value (USD Million) Forecast by Technology, 2021 to 2036
- Table 16: Latin America Market Value (USD Million) Forecast by Pacing Indication, 2021 to 2036
- Table 17: Latin America Market Value (USD Million) Forecast by End User, 2021 to 2036
- Table 18: Latin America Market Value (USD Million) Forecast by Device Capability, 2021 to 2036
- Table 19: Western Europe Market Value (USD Million) Forecast by Country, 2021 to 2036
- Table 20: Western Europe Market Value (USD Million) Forecast by Product Type, 2021 to 2036
- Table 21: Western Europe Market Value (USD Million) Forecast by Technology, 2021 to 2036
- Table 22: Western Europe Market Value (USD Million) Forecast by Pacing Indication, 2021 to 2036
- Table 23: Western Europe Market Value (USD Million) Forecast by End User, 2021 to 2036
- Table 24: Western Europe Market Value (USD Million) Forecast by Device Capability, 2021 to 2036
- Table 25: Eastern Europe Market Value (USD Million) Forecast by Country, 2021 to 2036
- Table 26: Eastern Europe Market Value (USD Million) Forecast by Product Type, 2021 to 2036
- Table 27: Eastern Europe Market Value (USD Million) Forecast by Technology, 2021 to 2036
- Table 28: Eastern Europe Market Value (USD Million) Forecast by Pacing Indication, 2021 to 2036
- Table 29: Eastern Europe Market Value (USD Million) Forecast by End User, 2021 to 2036
- Table 30: Eastern Europe Market Value (USD Million) Forecast by Device Capability, 2021 to 2036
- Table 31: East Asia Market Value (USD Million) Forecast by Country, 2021 to 2036
- Table 32: East Asia Market Value (USD Million) Forecast by Product Type, 2021 to 2036
- Table 33: East Asia Market Value (USD Million) Forecast by Technology, 2021 to 2036
- Table 34: East Asia Market Value (USD Million) Forecast by Pacing Indication, 2021 to 2036
- Table 35: East Asia Market Value (USD Million) Forecast by End User, 2021 to 2036
- Table 36: East Asia Market Value (USD Million) Forecast by Device Capability, 2021 to 2036
- Table 37: South Asia and Pacific Market Value (USD Million) Forecast by Country, 2021 to 2036
- Table 38: South Asia and Pacific Market Value (USD Million) Forecast by Product Type, 2021 to 2036
- Table 39: South Asia and Pacific Market Value (USD Million) Forecast by Technology, 2021 to 2036
- Table 40: South Asia and Pacific Market Value (USD Million) Forecast by Pacing Indication, 2021 to 2036
- Table 41: South Asia and Pacific Market Value (USD Million) Forecast by End User, 2021 to 2036
- Table 42: South Asia and Pacific Market Value (USD Million) Forecast by Device Capability, 2021 to 2036
- Table 43: Middle East & Africa Market Value (USD Million) Forecast by Country, 2021 to 2036
- Table 44: Middle East & Africa Market Value (USD Million) Forecast by Product Type, 2021 to 2036
- Table 45: Middle East & Africa Market Value (USD Million) Forecast by Technology, 2021 to 2036
- Table 46: Middle East & Africa Market Value (USD Million) Forecast by Pacing Indication, 2021 to 2036
- Table 47: Middle East & Africa Market Value (USD Million) Forecast by End User, 2021 to 2036
- Table 48: Middle East & Africa Market Value (USD Million) Forecast by Device Capability, 2021 to 2036
List Of Figures
- Figure 1: Global Market Pricing Analysis
- Figure 2: Global Market Value (USD Million) Forecast 2021 to 2036
- Figure 3: Global Market Value Share and BPS Analysis by Product Type, 2026 and 2036
- Figure 4: Global Market Y-o-Y Growth Comparison by Product Type, 2026 to 2036
- Figure 5: Global Market Attractiveness Analysis by Product Type
- Figure 6: Global Market Value Share and BPS Analysis by Technology, 2026 and 2036
- Figure 7: Global Market Y-o-Y Growth Comparison by Technology, 2026 to 2036
- Figure 8: Global Market Attractiveness Analysis by Technology
- Figure 9: Global Market Value Share and BPS Analysis by Pacing Indication, 2026 and 2036
- Figure 10: Global Market Y-o-Y Growth Comparison by Pacing Indication, 2026 to 2036
- Figure 11: Global Market Attractiveness Analysis by Pacing Indication
- Figure 12: Global Market Value Share and BPS Analysis by End User, 2026 and 2036
- Figure 13: Global Market Y-o-Y Growth Comparison by End User, 2026 to 2036
- Figure 14: Global Market Attractiveness Analysis by End User
- Figure 15: Global Market Value Share and BPS Analysis by Device Capability, 2026 and 2036
- Figure 16: Global Market Y-o-Y Growth Comparison by Device Capability, 2026 to 2036
- Figure 17: Global Market Attractiveness Analysis by Device Capability
- Figure 18: Global Market Value (USD Million) Share and BPS Analysis by Region, 2026 and 2036
- Figure 19: Global Market Y-o-Y Growth Comparison by Region, 2026 to 2036
- Figure 20: Global Market Attractiveness Analysis by Region
- Figure 21: North America Market Incremental Dollar Opportunity, 2026 to 2036
- Figure 22: Latin America Market Incremental Dollar Opportunity, 2026 to 2036
- Figure 23: Western Europe Market Incremental Dollar Opportunity, 2026 to 2036
- Figure 24: Eastern Europe Market Incremental Dollar Opportunity, 2026 to 2036
- Figure 25: East Asia Market Incremental Dollar Opportunity, 2026 to 2036
- Figure 26: South Asia and Pacific Market Incremental Dollar Opportunity, 2026 to 2036
- Figure 27: Middle East & Africa Market Incremental Dollar Opportunity, 2026 to 2036
- Figure 28: North America Market Value Share and BPS Analysis by Country, 2026 and 2036
- Figure 29: North America Market Value Share and BPS Analysis by Product Type, 2026 and 2036
- Figure 30: North America Market Y-o-Y Growth Comparison by Product Type, 2026 to 2036
- Figure 31: North America Market Attractiveness Analysis by Product Type
- Figure 32: North America Market Value Share and BPS Analysis by Technology, 2026 and 2036
- Figure 33: North America Market Y-o-Y Growth Comparison by Technology, 2026 to 2036
- Figure 34: North America Market Attractiveness Analysis by Technology
- Figure 35: North America Market Value Share and BPS Analysis by Pacing Indication, 2026 and 2036
- Figure 36: North America Market Y-o-Y Growth Comparison by Pacing Indication, 2026 to 2036
- Figure 37: North America Market Attractiveness Analysis by Pacing Indication
- Figure 38: North America Market Value Share and BPS Analysis by End User, 2026 and 2036
- Figure 39: North America Market Y-o-Y Growth Comparison by End User, 2026 to 2036
- Figure 40: North America Market Attractiveness Analysis by End User
- Figure 41: North America Market Value Share and BPS Analysis by Device Capability, 2026 and 2036
- Figure 42: North America Market Y-o-Y Growth Comparison by Device Capability, 2026 to 2036
- Figure 43: North America Market Attractiveness Analysis by Device Capability
- Figure 44: Latin America Market Value Share and BPS Analysis by Country, 2026 and 2036
- Figure 45: Latin America Market Value Share and BPS Analysis by Product Type, 2026 and 2036
- Figure 46: Latin America Market Y-o-Y Growth Comparison by Product Type, 2026 to 2036
- Figure 47: Latin America Market Attractiveness Analysis by Product Type
- Figure 48: Latin America Market Value Share and BPS Analysis by Technology, 2026 and 2036
- Figure 49: Latin America Market Y-o-Y Growth Comparison by Technology, 2026 to 2036
- Figure 50: Latin America Market Attractiveness Analysis by Technology
- Figure 51: Latin America Market Value Share and BPS Analysis by Pacing Indication, 2026 and 2036
- Figure 52: Latin America Market Y-o-Y Growth Comparison by Pacing Indication, 2026 to 2036
- Figure 53: Latin America Market Attractiveness Analysis by Pacing Indication
- Figure 54: Latin America Market Value Share and BPS Analysis by End User, 2026 and 2036
- Figure 55: Latin America Market Y-o-Y Growth Comparison by End User, 2026 to 2036
- Figure 56: Latin America Market Attractiveness Analysis by End User
- Figure 57: Latin America Market Value Share and BPS Analysis by Device Capability, 2026 and 2036
- Figure 58: Latin America Market Y-o-Y Growth Comparison by Device Capability, 2026 to 2036
- Figure 59: Latin America Market Attractiveness Analysis by Device Capability
- Figure 60: Western Europe Market Value Share and BPS Analysis by Country, 2026 and 2036
- Figure 61: Western Europe Market Value Share and BPS Analysis by Product Type, 2026 and 2036
- Figure 62: Western Europe Market Y-o-Y Growth Comparison by Product Type, 2026 to 2036
- Figure 63: Western Europe Market Attractiveness Analysis by Product Type
- Figure 64: Western Europe Market Value Share and BPS Analysis by Technology, 2026 and 2036
- Figure 65: Western Europe Market Y-o-Y Growth Comparison by Technology, 2026 to 2036
- Figure 66: Western Europe Market Attractiveness Analysis by Technology
- Figure 67: Western Europe Market Value Share and BPS Analysis by Pacing Indication, 2026 and 2036
- Figure 68: Western Europe Market Y-o-Y Growth Comparison by Pacing Indication, 2026 to 2036
- Figure 69: Western Europe Market Attractiveness Analysis by Pacing Indication
- Figure 70: Western Europe Market Value Share and BPS Analysis by End User, 2026 and 2036
- Figure 71: Western Europe Market Y-o-Y Growth Comparison by End User, 2026 to 2036
- Figure 72: Western Europe Market Attractiveness Analysis by End User
- Figure 73: Western Europe Market Value Share and BPS Analysis by Device Capability, 2026 and 2036
- Figure 74: Western Europe Market Y-o-Y Growth Comparison by Device Capability, 2026 to 2036
- Figure 75: Western Europe Market Attractiveness Analysis by Device Capability
- Figure 76: Eastern Europe Market Value Share and BPS Analysis by Country, 2026 and 2036
- Figure 77: Eastern Europe Market Value Share and BPS Analysis by Product Type, 2026 and 2036
- Figure 78: Eastern Europe Market Y-o-Y Growth Comparison by Product Type, 2026 to 2036
- Figure 79: Eastern Europe Market Attractiveness Analysis by Product Type
- Figure 80: Eastern Europe Market Value Share and BPS Analysis by Technology, 2026 and 2036
- Figure 81: Eastern Europe Market Y-o-Y Growth Comparison by Technology, 2026 to 2036
- Figure 82: Eastern Europe Market Attractiveness Analysis by Technology
- Figure 83: Eastern Europe Market Value Share and BPS Analysis by Pacing Indication, 2026 and 2036
- Figure 84: Eastern Europe Market Y-o-Y Growth Comparison by Pacing Indication, 2026 to 2036
- Figure 85: Eastern Europe Market Attractiveness Analysis by Pacing Indication
- Figure 86: Eastern Europe Market Value Share and BPS Analysis by End User, 2026 and 2036
- Figure 87: Eastern Europe Market Y-o-Y Growth Comparison by End User, 2026 to 2036
- Figure 88: Eastern Europe Market Attractiveness Analysis by End User
- Figure 89: Eastern Europe Market Value Share and BPS Analysis by Device Capability, 2026 and 2036
- Figure 90: Eastern Europe Market Y-o-Y Growth Comparison by Device Capability, 2026 to 2036
- Figure 91: Eastern Europe Market Attractiveness Analysis by Device Capability
- Figure 92: East Asia Market Value Share and BPS Analysis by Country, 2026 and 2036
- Figure 93: East Asia Market Value Share and BPS Analysis by Product Type, 2026 and 2036
- Figure 94: East Asia Market Y-o-Y Growth Comparison by Product Type, 2026 to 2036
- Figure 95: East Asia Market Attractiveness Analysis by Product Type
- Figure 96: East Asia Market Value Share and BPS Analysis by Technology, 2026 and 2036
- Figure 97: East Asia Market Y-o-Y Growth Comparison by Technology, 2026 to 2036
- Figure 98: East Asia Market Attractiveness Analysis by Technology
- Figure 99: East Asia Market Value Share and BPS Analysis by Pacing Indication, 2026 and 2036
- Figure 100: East Asia Market Y-o-Y Growth Comparison by Pacing Indication, 2026 to 2036
- Figure 101: East Asia Market Attractiveness Analysis by Pacing Indication
- Figure 102: East Asia Market Value Share and BPS Analysis by End User, 2026 and 2036
- Figure 103: East Asia Market Y-o-Y Growth Comparison by End User, 2026 to 2036
- Figure 104: East Asia Market Attractiveness Analysis by End User
- Figure 105: East Asia Market Value Share and BPS Analysis by Device Capability, 2026 and 2036
- Figure 106: East Asia Market Y-o-Y Growth Comparison by Device Capability, 2026 to 2036
- Figure 107: East Asia Market Attractiveness Analysis by Device Capability
- Figure 108: South Asia and Pacific Market Value Share and BPS Analysis by Country, 2026 and 2036
- Figure 109: South Asia and Pacific Market Value Share and BPS Analysis by Product Type, 2026 and 2036
- Figure 110: South Asia and Pacific Market Y-o-Y Growth Comparison by Product Type, 2026 to 2036
- Figure 111: South Asia and Pacific Market Attractiveness Analysis by Product Type
- Figure 112: South Asia and Pacific Market Value Share and BPS Analysis by Technology, 2026 and 2036
- Figure 113: South Asia and Pacific Market Y-o-Y Growth Comparison by Technology, 2026 to 2036
- Figure 114: South Asia and Pacific Market Attractiveness Analysis by Technology
- Figure 115: South Asia and Pacific Market Value Share and BPS Analysis by Pacing Indication, 2026 and 2036
- Figure 116: South Asia and Pacific Market Y-o-Y Growth Comparison by Pacing Indication, 2026 to 2036
- Figure 117: South Asia and Pacific Market Attractiveness Analysis by Pacing Indication
- Figure 118: South Asia and Pacific Market Value Share and BPS Analysis by End User, 2026 and 2036
- Figure 119: South Asia and Pacific Market Y-o-Y Growth Comparison by End User, 2026 to 2036
- Figure 120: South Asia and Pacific Market Attractiveness Analysis by End User
- Figure 121: South Asia and Pacific Market Value Share and BPS Analysis by Device Capability, 2026 and 2036
- Figure 122: South Asia and Pacific Market Y-o-Y Growth Comparison by Device Capability, 2026 to 2036
- Figure 123: South Asia and Pacific Market Attractiveness Analysis by Device Capability
- Figure 124: Middle East & Africa Market Value Share and BPS Analysis by Country, 2026 and 2036
- Figure 125: Middle East & Africa Market Value Share and BPS Analysis by Product Type, 2026 and 2036
- Figure 126: Middle East & Africa Market Y-o-Y Growth Comparison by Product Type, 2026 to 2036
- Figure 127: Middle East & Africa Market Attractiveness Analysis by Product Type
- Figure 128: Middle East & Africa Market Value Share and BPS Analysis by Technology, 2026 and 2036
- Figure 129: Middle East & Africa Market Y-o-Y Growth Comparison by Technology, 2026 to 2036
- Figure 130: Middle East & Africa Market Attractiveness Analysis by Technology
- Figure 131: Middle East & Africa Market Value Share and BPS Analysis by Pacing Indication, 2026 and 2036
- Figure 132: Middle East & Africa Market Y-o-Y Growth Comparison by Pacing Indication, 2026 to 2036
- Figure 133: Middle East & Africa Market Attractiveness Analysis by Pacing Indication
- Figure 134: Middle East & Africa Market Value Share and BPS Analysis by End User, 2026 and 2036
- Figure 135: Middle East & Africa Market Y-o-Y Growth Comparison by End User, 2026 to 2036
- Figure 136: Middle East & Africa Market Attractiveness Analysis by End User
- Figure 137: Middle East & Africa Market Value Share and BPS Analysis by Device Capability, 2026 and 2036
- Figure 138: Middle East & Africa Market Y-o-Y Growth Comparison by Device Capability, 2026 to 2036
- Figure 139: Middle East & Africa Market Attractiveness Analysis by Device Capability
- Figure 140: Global Market - Tier Structure Analysis
- Figure 141: Global Market - Company Share Analysis