Cardiac Rehabilitation Devices Market Size, Share, Growth and Forecast (2026 - 2036)

The Cardiac Rehabilitation Devices Market is segmented by Product, End User, Application, Technology, Phase of Rehabilitation, and Region. Forecast for 2026 to 2036.

FACT.MR analysis indicates that the cardiac rehabilitation devices market is characterized by a clear participation–engagement gap. The growing burden of cardiovascular diseases continues to expand the eligible patient population. Programme completion rates remain consistently low. This limits effective device utilization across care settings.

Cardiac Rehabilitation Devices Market Forecast and Outlook by Fact.MR

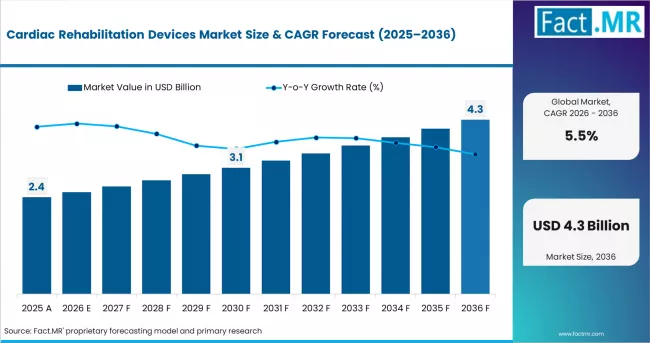
  • In 2025, the cardiac rehabilitation devices market was valued at USD 2.3 billion.
  • Based on Fact.MR analysis, demand for cardiac rehabilitation devices is estimated to grow to USD 2.4 billion in 2026 and USD 4.3 billion by 2036.
  • FACT.MR projects a CAGR of 5.5% during the forecast period.
  • The market is projected to generate approximately USD 1.9 billion in absolute opportunity between 2026 and 2036.
  • Growth remains steady rather than transformational. Rising cardiovascular disease prevalence continues to expand the patient base.
  • An ageing population further supports demand across both institutional and home care settings.
  • Device procurement remains consistent across hospitals, rehabilitation centres, and home-based care models.
Cardiac Rehabilitation Devices Market  Value Analysis

Metric Value
Estimated Value in 2026 USD 2.4 billion
Forecast Value in 2036 USD 4.3 billion
Forecast CAGR (2026 to 2036) 5.5%

Summary of the Cardiac Rehabilitation Devices Market

  • Market Definition
    • Market covers exercise equipment, physiological monitors, and connected tele-rehab platforms used across structured cardiovascular recovery and preventive cardiac care programmes in institutional and home settings globally.
  • Demand Drivers
    • Cardiovascular disease burden remains the primary driver. The World Health Organization estimates 17.9 million deaths annually. This expands the eligible patient pool and increases demand for rehabilitation devices.
    • Reimbursement expansion supports market growth. The Centers for Medicare and Medicaid Services extended coverage to heart failure patients in 2024. This boosts programme enrolment and device procurement in the U.S.
    • Remote monitoring adoption is rising. Home-based and hybrid models are gaining traction. Demand for wearable devices and telehealth platforms is increasing to support continuous patient engagement.
  • Key Segments Analyzed
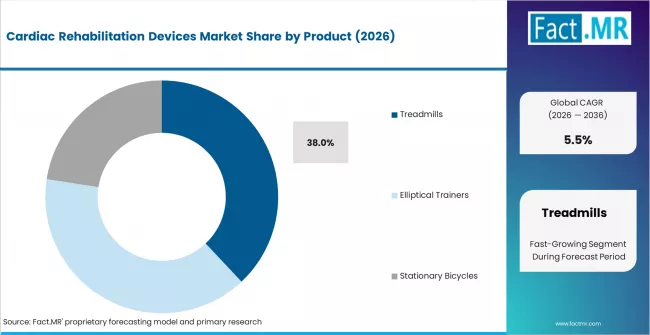
    • By Product: Treadmills lead at approximately 38% share in 2026, driven by consistent prescription in aerobic Phase II outpatient rehabilitation programmes.
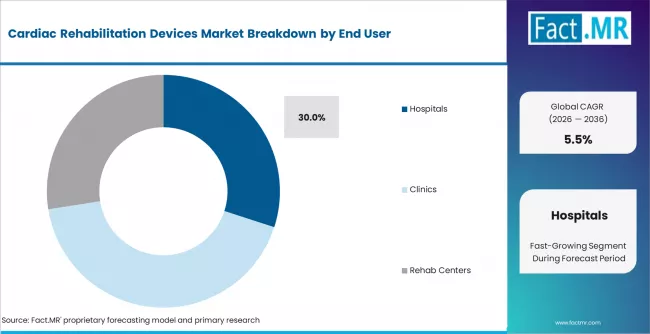
    • By End User: Hospitals hold the largest share, anchored by high-volume Phase I inpatient procurement.
    • By Application: Post-Myocardial Infarction Rehabilitation leads at approximately 35% share in 2026, reflecting guideline-mandated programme referral for MI patients across U.S., European, and Japanese cardiology protocols.
    • By Technology: Connected Devices hold approximately 30% share in 2026, with AI-enabled monitoring and telehealth platforms representing the fastest-growing sub-segments as remote programme delivery expands.
    • By Phase: Phase II Outpatient holds approximately 43% share in 2026, reflecting the largest structured device procurement segment across both hospital-affiliated and independent rehabilitation centres.
    • By Geography: India leads growth at 6.9% CAGR through 2036, supported by Ayushman Bharat hospital capacity expansion and rising institutional cardiac care programme adoption.
  • Analyst Opinion at FACT.MR
    • Shambhu Nath Jha, Principal Consultant at Fact.MR, opines, ‘CXOs will find that the structural opportunity in cardiac rehabilitation devices is shifting beyond equipment supply. The market is moving toward connected programme delivery. Value is increasingly tied to integrated care models rather than standalone devices.’
  • Strategic Implications
    • Develop integrated connected monitoring and telehealth platform bundles targeting Phase II outpatient rehabilitation centres, where reimbursement coverage and clinical protocol requirements create recurring device and software procurement cycles.
    • Prioritise CMS-reimbursement-aligned product portfolios in the United States, focusing on heart failure and post-MI programme device specifications that match updated 2024 coverage criteria for maximum institutional procurement eligibility.
    • Establish distribution partnerships with Ayushman Bharat-empanelled hospitals in India and government community health centres in China to capture first-mover volume in the two fastest-growing national markets.
  • Methodology
    • Market sizing uses device unit shipments by product type, average selling prices by technology tier, and programme enrolment rates validated against CMS, NHS, and national cardiology association data.
    • Analysis incorporates AHA and ESC cardiac rehabilitation guideline updates, CMS reimbursement schedule changes, WHO CVD burden data, and government health infrastructure investment data from 2024 and 2025.
    • Forecasts account for programme enrolment rate trends, connected device adoption timelines, home-based rehabilitation model expansion, and reimbursement policy changes across all covered regions.

However, structural constraints persist. Cardiac rehabilitation programme enrolment remains low in several emerging markets. Reimbursement varies significantly across payer systems. High capital costs for connected monitoring infrastructure limit adoption, particularly in public hospital networks. These factors collectively moderate overall market acceleration.

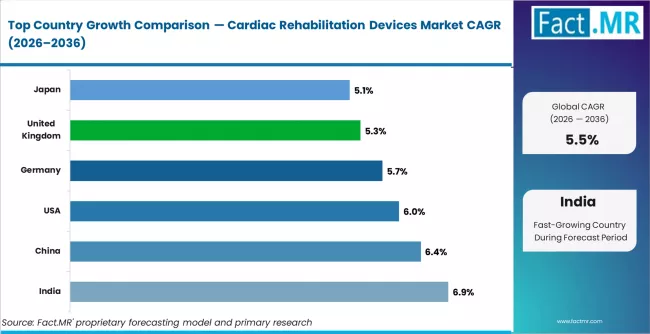
India leads growth with a 6.9% CAGR through 2036. Expansion is driven by improving public hospital cardiac care capacity and rising awareness of structured rehabilitation programmes. China follows at 6.4% CAGR, supported by government investment in community health centres and a large post-myocardial infarction population. The United States grows at 6.0% CAGR, backed by CMS reimbursement support and guideline-driven programme expansion.

Germany records 5.7% CAGR, reflecting strong statutory insurance coverage and increasing procurement across outpatient rehabilitation centres. The United Kingdom grows at 5.3% CAGR, supported by NHS-led rehabilitation service expansion. Japan registers 5.1% CAGR, with demand sustained by an ageing population, though moderated by conservative hospital procurement cycles.

Segmental Analysis

Cardiac Rehabilitation Devices Market Analysis by Product
Cardiac Rehabilitation Devices Market Analysis By Product

Based on FACT.MR analysis, treadmills hold approximately 38% share in 2026. They remain the standard aerobic exercise platform across supervised Phase II outpatient programmes, prescribed within AHA and ESC guideline-aligned exercise protocols.

  • GE HealthCare Monitoring Expansion: GE HealthCare launched its MUSE Cardiac Monitoring platform update in Q3 2024, integrating remote cardiac rehabilitation monitoring capability for outpatient programme management. The company reported increased sales to U.S. hospital-based outpatient rehabilitation programmes following the CMS heart failure reimbursement extension. [1]
  • Philips Telehealth Development: Koninklijke Philips N.V. expanded its cardiac telehealth rehabilitation platform in 2024, adding AI-based exercise intensity guidance and real-time arrhythmia alerts. The platform secured adoption across hospital-affiliated outpatient cardiac programmes in the Netherlands and Germany following ESC guideline endorsement of home-based models. [2]
  • Wearable Device Adoption Trend: The American Heart Association reported in its 2024 Heart Disease and Stroke Statistics Update that wearable cardiac monitor prescription rates in post-MI outpatient programmes rose 18% year-on-year, driven by hybrid rehabilitation model adoption across U.S. health systems responding to CMS reimbursement changes. [4]

Cardiac Rehabilitation Devices Market Analysis by End User
Cardiac Rehabilitation Devices Market Analysis By End User

Based on FACT.MR analysis, hospitals hold the largest end-user share in 2026, driven by inpatient Phase I procurement and outpatient programme device budgets within integrated cardiology departments.

  • Hospital Procurement Scale: Medtronic reported increased cardiac monitoring device placements in U.S. hospital-based outpatient rehabilitation programmes in FY2024, citing the CMS heart failure coverage extension as the primary volume driver. Hospital procurement teams accelerated connected device specifications into multi-year procurement frameworks. [5]
  • Rehab Centre Capacity Growth: Brunswick Corporation's Life Fitness division reported increased institutional treadmill and stationary bicycle procurement from U.S. cardiac rehabilitation centres in 2024, reflecting expanded programme capacity investment by standalone outpatient rehab operators responding to growing post-MI referral volumes. [6]
  • Home Care Channel Development: Core Health & Fitness expanded its clinical-grade home rehabilitation equipment line in early 2025, targeting post-cardiac surgery patients prescribed home-based Phase III maintenance programmes under hybrid models endorsed by updated AHA and ESC guidelines. [7]

Cardiac Rehabilitation Devices Market Analysis by Application
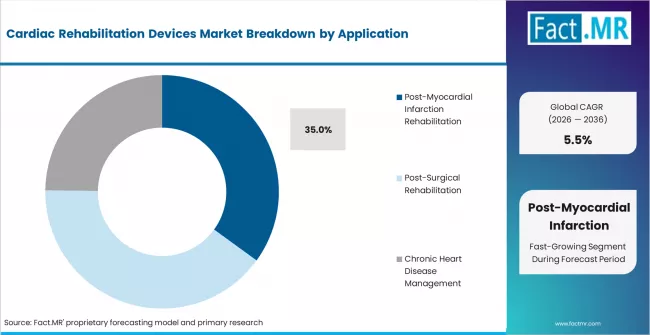
Cardiac Rehabilitation Devices Market Analysis By Application

Based on FACT.MR analysis, post-myocardial infarction rehabilitation holds approximately 35% share in 2026. Guideline-mandated programme referral for MI patients across U.S., European, and Japanese cardiology protocols sustains consistent institutional device demand.

  • Post-MI Protocol Compliance: The American Heart Association's 2024 cardiac rehabilitation performance measures update strengthened hospital accreditation requirements for post-MI rehabilitation programme referral within 90 days of discharge, directly driving device procurement to support expanded programme capacity across U.S. cardiology departments. [4]
  • Chronic Disease Management Growth: Philips N.V. reported growing demand for its chronic heart failure remote monitoring platform from European cardiology outpatient departments in 2024, with programme operators using connected devices to extend structured exercise monitoring across long-term heart disease management pathways beyond the standard Phase II duration. [2]
  • Preventive Care Expansion: Schiller AG launched a preventive cardiac screening and exercise monitoring system in 2024, targeting employer wellness programmes and sports medicine facilities seeking clinical-grade cardiac risk monitoring outside conventional rehabilitation settings, addressing an emerging preventive care device segment. [8]

Cardiac Rehabilitation Devices Market Analysis by Technology
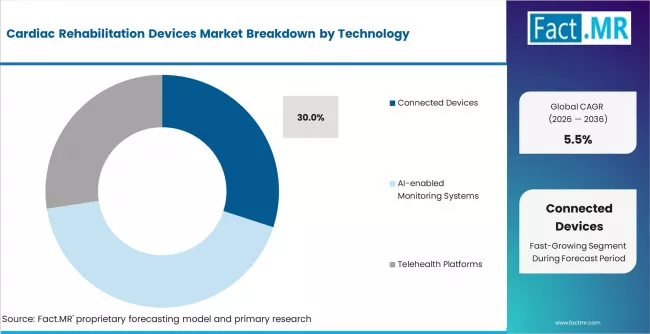
Cardiac Rehabilitation Devices Market Analysis By Technology

Based on FACT.MR analysis, connected devices hold approximately 30% share in 2026. AI-enabled monitoring systems and telehealth platforms are the fastest-growing technology sub-segments, driven by remote and hybrid programme delivery.

  • AI Monitoring Investment: GE HealthCare disclosed investment in AI-driven cardiac monitoring algorithm development in its FY2024 annual report, targeting automated arrhythmia detection and exercise intensity optimisation for outpatient rehabilitation programmes. [1]
  • Telehealth Platform Growth: Koninklijke Philips N.V. reported a 24% increase in telehealth cardiac rehabilitation platform subscriptions across European health systems in 2024. Hybrid programme operators citing patient adherence improvement and reduced per-session cost as the primary adoption drivers relative to fully supervised models. [2]
  • Wearable Integration Trend: Medtronic's Cardiac Rhythm Management division reported expanded wearable-integrated cardiac rehabilitation monitoring deployments in U.S. health systems during FY2024, connecting implantable device telemetry with outpatient programme monitoring platforms to create unified patient data streams across Phase II and III rehabilitation. [5]

Cardiac Rehabilitation Devices Market Analysis by Phase of Rehabilitation
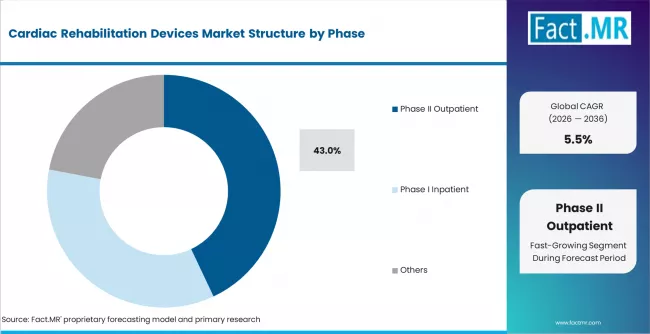
Cardiac Rehabilitation Devices Market Analysis By Phase

Based on FACT.MR analysis, Phase II outpatient rehabilitation holds approximately 43% share in 2026. This phase represents the most device-intensive supervised programme segment, with structured exercise sessions requiring treadmills, stationary bicycles, and continuous ECG monitoring.

  • Phase II Programme Investment: Brunswick Corporation's Life Fitness division reported that Phase II outpatient cardiac rehabilitation represented its largest institutional cardiology channel in North America in 2024, with programme capacity expansion driving multi-unit treadmill and stationary bicycle procurement by hospital-affiliated and independent outpatient operators. [6]
  • Phase I Inpatient Technology: GE HealthCare reported increased Phase I inpatient cardiac monitoring device placements in U.S. hospitals in Q3 2024, with portable monitoring systems enabling earlier ambulation and supervised exercise initiation for post-cardiac surgery patients aligned with updated early mobilisation protocols. [1]
  • Phase III Home Monitoring Expansion: Core Health & Fitness launched a Phase III home maintenance rehabilitation equipment bundle in early 2025, combining clinical-grade stationary bicycle, heart rate monitoring, and telehealth connectivity for long-term post-cardiac event patients prescribed unsupervised maintenance exercise under hybrid programme frameworks. [7]

Drivers, Restraints, and Opportunities
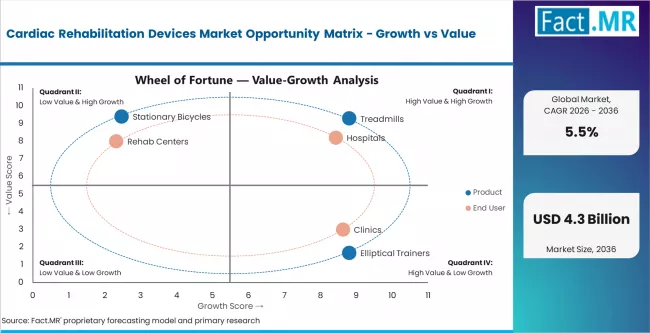
Cardiac Rehabilitation Devices Market Opportunity Matrix Growth Vs Value

FACT.MR analysts observe that the cardiac rehabilitation devices market at USD 2.4 billion in 2026 reflects decades of guideline-driven institutional procurement anchored by cardiovascular disease as the leading global cause of mortality.

The core tension lies between conventional supervised rehabilitation and emerging home-based models. In clinical settings, device utilisation is predictable. However, programme participation rates remain low. At the same time, home-based and hybrid models are gaining traction. These are driven by connected monitoring technologies.

  • CMS Heart Failure Coverage Expansion: The U.S. Centers for Medicare and Medicaid Services extended cardiac rehabilitation reimbursement to heart failure patients in 2024, adding an estimated 6.2 million additional eligible beneficiaries. [1]
  • ESC Guideline Update on Home Rehabilitation: The European Society of Cardiology updated its cardiac rehabilitation guidelines in 2024, formally endorsing home-based and hybrid programme models for stable post-MI patients. Philips N.V. reported increased European demand for its cardiac telehealth monitoring platform following the guideline publication. [2]
  • Asia Pacific Hospital Infrastructure: India's Pradhan Mantri Jan Arogya Yojana expansion in 2024 added cardiac care as a priority intervention category, with empanelled hospitals increasing cardiac department procurement budgets. China's National Health Commission allocated CNY 12 billion. [3]

Regional Analysis

The cardiac rehabilitation devices market is assessed across Asia Pacific, North America, Europe, Latin America, and Middle East and Africa, covering 40+ countries segmented by cardiovascular disease burden, programme enrolment infrastructure, reimbursement coverage, and hospital procurement capacity. The full report offers market attractiveness analysis by region and country.

Top Country Growth Comparison Cardiac Rehabilitation Devices Market Cagr (2026 2036)

Country CAGR (2026 to 2036)
India 6.9%
China 6.4%
United States 6.0%
Germany 5.7%
United Kingdom 5.3%
Japan 5.1%

Source: Fact.MR (FACT.MR) analysis, based on proprietary forecasting model and primary research
Cardiac Rehabilitation Devices Market Cagr Analysis By Country

Asia Pacific Cardiac Rehabilitation Devices Market Analysis
Cardiac Rehabilitation Devices Market Japan Market Share Analysis By Product

Asia Pacific is the volume growth epicentre for cardiac rehabilitation devices. Rising CVD incidence and government health infrastructure investment are the twin structural drivers. GE HealthCare and Philips are expanding regional institutional partnerships.

  • China: Policy-led infrastructure expansion defines the China market. Demand rises at 6.4% CAGR through 2036. The National Health Commission allocated CNY 12 billion under the 14th Five-Year Plan in 2024. Funded community hospitals must deploy rehabilitation and monitoring devices. The Chinese Society of Cardiology updated programme standards in 2024. This formalised device specifications for Phase II outpatient care. GE HealthCare expanded its distributor network into Tier II and Tier III cities. Coverage aligns with community health centre expansion.
  • India: Public health expansion and tele-rehabilitation define the India market. Demand rises at 6.9% CAGR through 2036. Ayushman Bharat PM-JAY expanded cardiac care coverage in 2024. Empanelled hospitals receive funding for rehabilitation equipment. The Indian Heart Rhythm Society issued its first rehabilitation framework in 2024. This promotes structured device-supported outpatient programmes. Philips scaled its telehealth platform across multiple states. Adoption targets post-MI patient pathways.
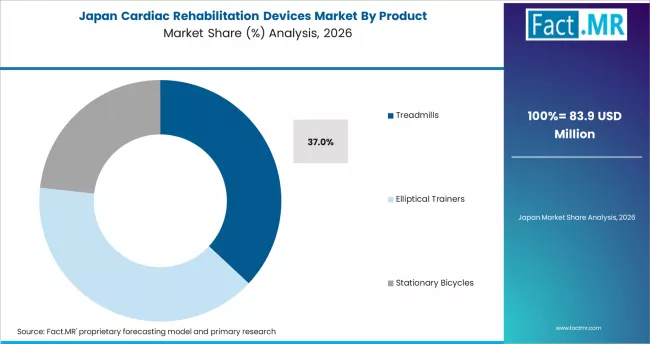
  • Japan: Stability and replacement cycles define the Japan market. Demand rises at 5.1% CAGR through 2036. The Ministry of Health, Labour and Welfare processed over 1.1 million sessions in FY2024. Procurement remains consistent across hospital programmes. Conservative capital cycles limit rapid expansion. Schiller AG reported steady demand from certified centres. Growth is replacement-driven.

FACT.MR’s analysis of the cardiac rehabilitation devices market in Asia Pacific includes China, India, Japan, South Korea, ASEAN, and Australia and New Zealand. Readers can access programme data, procurement trends, and guideline adoption timelines by country.

North America Cardiac Rehabilitation Devices Market Analysis
Cardiac Rehabilitation Devices Market Country Value Analysis

North America leads global revenue. Structured reimbursement and guideline frameworks drive procurement. Institutional demand is supported by CMS coverage and AHA programme mandates.

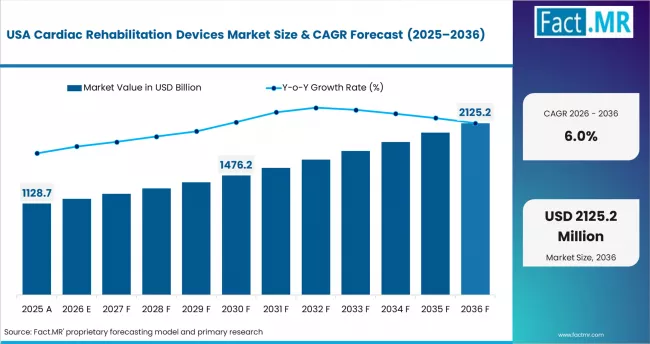
  • United States: Reimbursement-driven expansion defines the U.S. market. Demand rises at 6.0% CAGR through 2036. The Centers for Medicare and Medicaid Services expanded coverage to heart failure patients in 2024. This added over 6 million eligible beneficiaries. The American Heart Association strengthened referral guidelines in 2024. Compliance is increasing device procurement. Brunswick Corporation reported higher sales to rehabilitation programmes. Growth is tied to capacity expansion.

FACT.MR’s analysis of the cardiac rehabilitation devices market in North America includes the United States, Canada, and Mexico. Readers can access reimbursement data, guideline impacts, and device adoption benchmarks.

Europe Cardiac Rehabilitation Devices Market Analysis
Cardiac Rehabilitation Devices Market Europe Country Market Share Analysis, 2026 & 2036

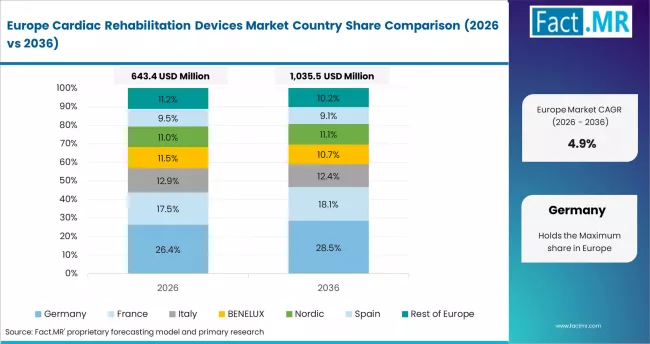
Europe is a reimbursement-driven market. Statutory insurance and national health systems define procurement standards. Guideline updates are accelerating adoption of hybrid rehabilitation models.

  • Germany: Insurance-led compliance defines the Germany market. Demand rises at 5.7% CAGR through 2036. The Gesetzliche Krankenversicherung framework mandates rehabilitation coverage. The GKV Spitzenverband updated device standards in 2024. This includes stricter heart rate monitoring requirements. Philips expanded tele-rehabilitation programmes across outpatient centres. Adoption aligns with ESC hybrid care guidance.
  • United Kingdom: NHS commissioning expansion defines the UK market. Demand rises at 5.3% CAGR through 2036. NHS England expanded outpatient capacity in 2024. The British Heart Foundation reported rising programme participation. Procurement demand is increasing across NHS centres. GE HealthCare secured NHS Supply Chain agreements. Coverage spans multiple rehabilitation settings.

FACT.MR’s analysis of the cardiac rehabilitation devices market in Europe includes Germany, France, the United Kingdom, Italy, Spain, and BENELUX. Readers can access reimbursement data, guideline impacts, and procurement benchmarks.

Competitive Aligners for Market Players
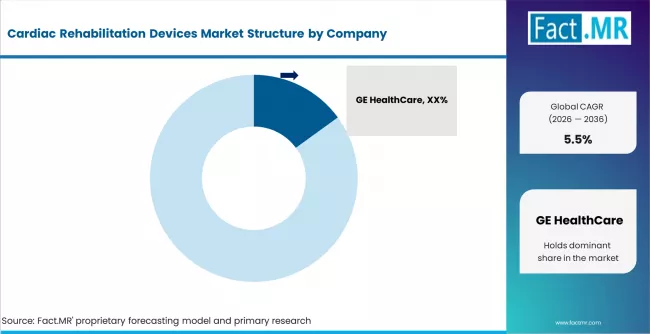
Cardiac Rehabilitation Devices Market Analysis By Company

Competitive aligners in the cardiac rehabilitation devices market are increasingly defined by the shift from standalone equipment supply to integrated, connected care solutions. Market participants are aligning their strategies around digital ecosystems, remote monitoring capabilities, and long-term service contracts with healthcare providers. Traditional differentiation based on exercise equipment quality is becoming less decisive, as treadmills and stationary systems are now commoditized across hospital procurement frameworks.

Leading players such as GE HealthCare, Philips, and Medtronic are focusing on connected monitoring platforms and data-driven rehabilitation models. These companies are integrating wearable cardiac monitoring devices with telehealth platforms to enable continuous patient tracking beyond clinical settings. This approach improves adherence and supports outcome-based care delivery.

Competition is also shaped by reimbursement alignment and regulatory compliance. Companies that tailor solutions to CMS, NHS, and statutory insurance frameworks are gaining stronger institutional footholds. Integration with hospital IT systems and electronic health records is becoming a key requirement for large-scale adoption. Regional players and equipment manufacturers continue to compete on cost efficiency and localized distribution. However, their long-term competitiveness depends on the ability to integrate digital capabilities. Partnerships with hospitals, insurers, and telehealth providers are increasing as companies aim to secure recurring revenue streams.

Key Players

  • GE HealthCare
  • Koninklijke Philips N.V.
  • Medtronic
  • Schiller AG
  • Brunswick Corporation
  • Core Health & Fitness

Bibliography

  • [1] GE HealthCare Technologies Inc. Q3 2024 Earnings Commentary and MUSE Cardiac Monitoring Platform Update: Cardiac Rehabilitation Remote Monitoring Integration and CMS Heart Failure Coverage Impact on U.S. Outpatient Programme Device Orders. October 2024. gehealthcare.com/investor-relations
  • [2] Koninklijke Philips N.V. Annual Report 2024: Cardiac Telehealth Rehabilitation Platform Subscription Growth in European Markets and ESC Hybrid Programme Guideline Adoption Impact on Connected Device Demand. March 2025. philips.com/investor-relations
  • [3] National Health Commission, People's Republic of China. 14th Five-Year Plan Community Hospital Cardiac Care Equipment Allocation Programme: CNY 12 Billion Infrastructure Investment for Cardiac Rehabilitation Device Procurement Across Community Health Centres. 2024. nhc.gov.cn
  • [4] American Heart Association. Heart Disease and Stroke Statistics 2024 Update and Cardiac Rehabilitation Performance Measures: Wearable Monitor Prescription Rate Data and Post-MI Programme Referral Requirement Strengthening. 2024. heart.org/statistics
  • [5] Medtronic plc. FY2024 Annual Report: Cardiac Rhythm Management Division Wearable-Integrated Rehabilitation Monitoring Deployments in U.S. Hospital-Based Outpatient Programmes and CMS Coverage Extension Impact on Device Placements. June 2024. medtronic.com/investor-relations
  • [6] Brunswick Corporation. FY2024 Annual Report: Life Fitness Division Institutional Treadmill and Stationary Bicycle Procurement Growth from U.S. Cardiac Rehabilitation Programme Capacity Expansion Following CMS Heart Failure Reimbursement Change. February 2025. brunswick.com/investor-relations
  • [7] Core Health & Fitness. Press Release: Phase III Home Cardiac Maintenance Rehabilitation Equipment Bundle Launch with Clinical-Grade Stationary Bicycle, Heart Rate Monitoring, and Telehealth Connectivity for Post-Cardiac Event Patients. January 2025. corehandf.com/news
  • [8] Schiller AG. Product Announcement: Preventive Cardiac Screening and Exercise Monitoring System Launch for Employer Wellness Programmes and Sports Medicine Facilities: Clinical-Grade Cardiac Risk Monitoring Outside Conventional Rehabilitation Settings. 2024. schiller.ch/news

This Report Addresses

  • Strategic intelligence on cardiac rehabilitation device demand across exercise equipment, physiological monitoring, and connected tele-rehab platform segments in institutional and home care settings globally.
  • Market forecast from USD 2.4 billion in 2026 to USD 4.3 billion by 2036 at a CAGR of 5.5%.
  • Growth opportunity mapping across India PMJAY cardiac care expansion, China 14th Five-Year Plan community hospital investment, U.S. CMS heart failure reimbursement extension, Germany GKV programme device standard updates, and UK NHS Long Term Plan cardiac commissioning.
  • Segment analysis by product, end user, application, technology, and rehabilitation phase across global and regional markets with share and growth data.
  • Regional outlook covering Asia Pacific hospital capacity-driven volume growth, North America reimbursement-led programme expansion, and Europe statutory insurer and ESC guideline-driven device procurement trends.
  • Competitive analysis of GE HealthCare, Philips, Medtronic, Schiller AG, Brunswick Corporation, and Core Health & Fitness covering monitoring platform depth, hospital supply relationships, and connected programme delivery capabilities.
  • Regulatory analysis covering U.S. CMS cardiac rehabilitation reimbursement criteria, ESC programme guideline updates, NHS England commissioning frameworks, German GKV device standards, and India PMJAY cardiac care procurement guidelines.
  • Report delivered in PDF, Excel datasets, and presentation formats supported by primary interviews, national health ministry data, OEM annual reports, and reimbursement schedule publications.

Cardiac Rehabilitation Devices Market Definition

The cardiac rehabilitation devices market covers exercise equipment, physiological monitoring instruments, and connected technology platforms used to support structured cardiovascular recovery and preventive care programmes.

Cardiac Rehabilitation Devices Market Inclusions

Covers global and regional forecasts from 2026 to 2036 by product, end user, application, technology, and rehabilitation phase. Includes exercise equipment, physiological monitoring devices, and connected tele-rehab platforms. Covers institutional and home care channels across all five geographic regions with reimbursement and procurement benchmarks.

Cardiac Rehabilitation Devices Market Exclusions

Excludes general fitness equipment without clinical monitoring capability. Omits implantable cardiac devices such as pacemakers and ICDs. Excludes cardiac diagnostic imaging systems not used in rehabilitation programme delivery. Focuses strictly on devices and platforms prescribed or procured within structured cardiac rehabilitation programme frameworks.

Cardiac Rehabilitation Devices Market Research Methodology

  • Primary Research
    • Interviews with cardiac rehabilitation programme directors, hospital cardiology procurement managers, outpatient rehab centre operators, and home care device distributors across North America, Europe, Asia Pacific, and Latin America.
  • Desk Research
    • Uses annual reports from GE HealthCare, Koninklijke Philips N.V., Medtronic, and Brunswick Corporation. Includes CMS reimbursement schedule data, AHA programme guidelines, and cardiac device adoption benchmarks from 2024 to 2025.
  • Market-Sizing and Forecasting
    • Hybrid bottom-up model using device unit volumes by product type and end-user segment, average selling prices by technology tier, and programme enrolment rates. Top-down validation against global cardiovascular device market benchmarks.
  • Data Validation and Update Cycle
    • Validated against OEM revenue disclosures, national health ministry procurement data, and cardiac rehabilitation association programme statistics. Updated annually with Q4 earnings data and reimbursement schedule revisions.

Scope of Report

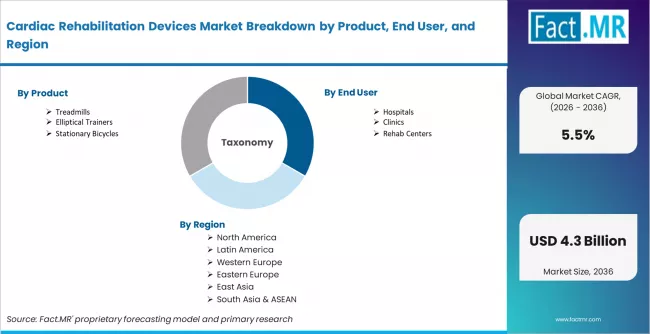
Cardiac Rehabilitation Devices Market Breakdown By Product, End User, And Region

  Details
Quantitative Units USD 2.4 billion (2026) to USD 4.3 billion (2036), at a CAGR of 5.5%
Market Definition Exercise equipment, physiological monitoring instruments, and connected tele-rehab platforms used in structured cardiovascular recovery and preventive cardiac care programmes across hospitals, rehab centres, and home care settings globally.
Product Segmentation Treadmills, Elliptical Trainers, Stationary Bicycles, Blood Pressure Monitors, Heart Rate Monitors, Wearable Cardiac Monitoring Devices, Remote Monitoring & Tele-rehab Systems, Resistance Training Equipment, Others
End User Segmentation Hospitals, Clinics, Rehab Centers, Home Care Settings, Ambulatory Surgical Centers, Sports & Fitness Centers
Application Segmentation Post-Myocardial Infarction Rehabilitation, Post-Surgical Rehabilitation, Chronic Heart Disease Management, Preventive Cardiac Care, Others
Technology Segmentation Connected Devices, AI-enabled Monitoring Systems, Telehealth Platforms, Wearable-integrated Systems
Phase Segmentation Phase I (Inpatient), Phase II (Outpatient), Phase III (Maintenance), Others
Regions Covered North America, Europe, Asia Pacific, Latin America, Middle East and Africa
Countries Covered USA, Canada, Mexico, Germany, UK, France, Italy, Spain, BENELUX, China, Japan, India, South Korea, ASEAN, Australia and New Zealand, Brazil, Argentina, Chile, Saudi Arabia, UAE, Turkey, South Africa, Rest of MEA
Key Companies Profiled GE HealthCare, Koninklijke Philips N.V., Medtronic, Schiller AG, Brunswick Corporation, Core Health & Fitness
Forecast Period 2026 to 2036
Approach Hybrid bottom-up and top-down model using device unit volumes by product type and end-user segment, average selling prices by technology tier, programme enrolment rates, and primary interviews with cardiac rehabilitation programme directors, hospital procurement managers, and outpatient rehab centre operators.

Cardiac Rehabilitation Devices Market by Segments

  • By Product:

    • Treadmills
    • Elliptical Trainers
    • Stationary Bicycles
    • Blood Pressure Monitors
    • Heart Rate Monitors
    • Wearable Cardiac Monitoring Devices
    • Remote Monitoring & Tele-rehab Systems
    • Resistance Training Equipment
    • Others
  • By End User:

    • Hospitals
    • Clinics
    • Rehab Centers
    • Home Care Settings
    • Ambulatory Surgical Centers
    • Sports & Fitness Centers
  • By Application:

    • Post-Myocardial Infarction Rehabilitation
    • Post-Surgical Rehabilitation
    • Chronic Heart Disease Management
    • Preventive Cardiac Care
    • Others
  • By Technology:

    • Connected Devices
    • AI-enabled Monitoring Systems
    • Telehealth Platforms
  • Wearable-integrated Systems
  • By Phase of Rehabilitation:

    • Phase I (Inpatient)
    • Phase II (Outpatient)
    • Phase III (Maintenance)
    • Others
  • By Region:

    • North America
      • United States
      • Canada
      • Mexico
    • Latin America
      • Brazil
      • Argentina
      • Chile
      • Rest of Latin America
    • Western Europe
      • Germany
      • United Kingdom
      • France
      • Italy
      • Spain
      • BENELUX
      • Rest of Western Europe
    • Eastern Europe
      • Russia
      • Poland
      • Hungary
      • Balkan and Baltic
      • Rest of Eastern Europe
    • East Asia
      • China
      • Japan
      • South Korea
    • South Asia and Pacific
      • India
      • ASEAN
      • Australia and New Zealand
      • Rest of South Asia and Pacific
    • Middle East and Africa
      • Kingdom of Saudi Arabia
      • UAE
      • South Africa
      • Turkey
      • Rest of Middle East and Africa

- Frequently Asked Questions -

How large is the global cardiac rehabilitation devices market in 2025?

The global cardiac rehabilitation devices market was valued at USD 2.3 billion in 2025.

What will the market size be in 2026?

Based on Fact.MR analysis, demand for cardiac rehabilitation devices is estimated to grow to USD 2.4 billion in 2026.

What is the projected market size by 2036?

The market is projected to reach USD 4.3 billion by 2036, generating USD 1.9 billion in absolute dollar opportunity over the forecast period.

What is the expected CAGR from 2026 to 2036?

FACT.MR projects a CAGR of 5.5% for the global cardiac rehabilitation devices market during the 2026 to 2036 forecast period.

Which product segment is poised to lead the market?

Treadmills lead with approximately 38% share in 2026, driven by consistent prescription in aerobic Phase II outpatient rehabilitation programmes across hospital and clinic settings.

Which rehabilitation phase holds the largest share?

Phase II Outpatient holds approximately 43% share in 2026, representing the most device-intensive supervised programme segment with structured exercise and continuous ECG monitoring requirements.

Which country shows the fastest growth?

India leads at 6.9% CAGR through 2036, driven by Ayushman Bharat programme expansion, the Indian Heart Rhythm Society's 2024 rehabilitation framework, and Philips platform adoption across hospital-affiliated cardiac care programmes.

Table of Content

  1. Executive Summary
    • Global Market Outlook
    • Demand to side Trends
    • Supply to side Trends
    • Technology Roadmap Analysis
    • Analysis and Recommendations
  2. Market Overview
    • Market Coverage / Taxonomy
    • Market Definition / Scope / Limitations
  3. Research Methodology
    • Chapter Orientation
    • Analytical Lens and Working Hypotheses
      • Market Structure, Signals, and Trend Drivers
      • Benchmarking and Cross-market Comparability
      • Market Sizing, Forecasting, and Opportunity Mapping
    • Research Design and Evidence Framework
      • Desk Research Programme (Secondary Evidence)
        • Company Annual and Sustainability Reports
        • Peer-reviewed Journals and Academic Literature
        • Corporate Websites, Product Literature, and Technical Notes
        • Earnings Decks and Investor Briefings
        • Statutory Filings and Regulatory Disclosures
        • Technical White Papers and Standards Notes
        • Trade Journals, Industry Magazines, and Analyst Briefs
        • Conference Proceedings, Webinars, and Seminar Materials
        • Government Statistics Portals and Public Data Releases
        • Press Releases and Reputable Media Coverage
        • Specialist Newsletters and Curated Briefings
        • Sector Databases and Reference Repositories
        • Fact.MR Internal Proprietary Databases and Historical Market Datasets
        • Subscription Datasets and Paid Sources
        • Social Channels, Communities, and Digital Listening Inputs
        • Additional Desk Sources
      • Expert Input and Fieldwork (Primary Evidence)
        • Primary Modes
          • Qualitative Interviews and Expert Elicitation
          • Quantitative Surveys and Structured Data Capture
          • Blended Approach
        • Why Primary Evidence is Used
        • Field Techniques
          • Interviews
          • Surveys
          • Focus Groups
          • Observational and In-context Research
          • Social and Community Interactions
        • Stakeholder Universe Engaged
          • C-suite Leaders
          • Board Members
          • Presidents and Vice Presidents
          • R&D and Innovation Heads
          • Technical Specialists
          • Domain Subject-matter Experts
          • Scientists
          • Physicians and Other Healthcare Professionals
        • Governance, Ethics, and Data Stewardship
          • Research Ethics
          • Data Integrity and Handling
      • Tooling, Models, and Reference Databases
    • Data Engineering and Model Build
      • Data Acquisition and Ingestion
      • Cleaning, Normalisation, and Verification
      • Synthesis, Triangulation, and Analysis
    • Quality Assurance and Audit Trail
  4. Market Background
    • Market Dynamics
      • Drivers
      • Restraints
      • Opportunity
      • Trends
    • Scenario Forecast
      • Demand in Optimistic Scenario
      • Demand in Likely Scenario
      • Demand in Conservative Scenario
    • Opportunity Map Analysis
    • Product Life Cycle Analysis
    • Supply Chain Analysis
    • Investment Feasibility Matrix
    • Value Chain Analysis
    • PESTLE and Porter’s Analysis
    • Regulatory Landscape
    • Regional Parent Market Outlook
    • Production and Consumption Statistics
    • Import and Export Statistics
  5. Global Market Analysis 2021 to 2025 and Forecast, 2026 to 2036
    • Historical Market Size Value (USD Million) Analysis, 2021 to 2025
    • Current and Future Market Size Value (USD Million) Projections, 2026 to 2036
      • Y to o to Y Growth Trend Analysis
      • Absolute $ Opportunity Analysis
  6. Global Market Pricing Analysis 2021 to 2025 and Forecast 2026 to 2036
  7. Global Market Analysis 2021 to 2025 and Forecast 2026 to 2036, By Product
    • Introduction / Key Findings
    • Historical Market Size Value (USD Million) Analysis By Product , 2021 to 2025
    • Current and Future Market Size Value (USD Million) Analysis and Forecast By Product , 2026 to 2036
      • Flexible Endoscopes
      • Rigid Endoscopes
      • Fibreoptic Endoscopes
    • Y to o to Y Growth Trend Analysis By Product , 2021 to 2025
    • Absolute $ Opportunity Analysis By Product , 2026 to 2036
  8. Global Market Analysis 2021 to 2025 and Forecast 2026 to 2036, By Animal Type
    • Introduction / Key Findings
    • Historical Market Size Value (USD Million) Analysis By Animal Type, 2021 to 2025
    • Current and Future Market Size Value (USD Million) Analysis and Forecast By Animal Type, 2026 to 2036
      • Companion Animals
      • Large Animals
      • Others
    • Y to o to Y Growth Trend Analysis By Animal Type, 2021 to 2025
    • Absolute $ Opportunity Analysis By Animal Type, 2026 to 2036
  9. Global Market Analysis 2021 to 2025 and Forecast 2026 to 2036, By End Use
    • Introduction / Key Findings
    • Historical Market Size Value (USD Million) Analysis By End Use, 2021 to 2025
    • Current and Future Market Size Value (USD Million) Analysis and Forecast By End Use, 2026 to 2036
      • Hospitals & Clinics
      • Academic Institutes
      • Independent Clinics
    • Y to o to Y Growth Trend Analysis By End Use, 2021 to 2025
    • Absolute $ Opportunity Analysis By End Use, 2026 to 2036
  10. Global Market Analysis 2021 to 2025 and Forecast 2026 to 2036, By Procedure
    • Introduction / Key Findings
    • Historical Market Size Value (USD Million) Analysis By Procedure, 2021 to 2025
    • Current and Future Market Size Value (USD Million) Analysis and Forecast By Procedure, 2026 to 2036
      • Diagnostic Procedures
      • Therapeutic Procedures
    • Y to o to Y Growth Trend Analysis By Procedure, 2021 to 2025
    • Absolute $ Opportunity Analysis By Procedure, 2026 to 2036
  11. Global Market Analysis 2021 to 2025 and Forecast 2026 to 2036, By Application
    • Introduction / Key Findings
    • Historical Market Size Value (USD Million) Analysis By Application, 2021 to 2025
    • Current and Future Market Size Value (USD Million) Analysis and Forecast By Application, 2026 to 2036
      • Gastrointestinal (GI)
      • Respiratory & ENT
      • Urogenital
    • Y to o to Y Growth Trend Analysis By Application, 2021 to 2025
    • Absolute $ Opportunity Analysis By Application, 2026 to 2036
  12. Global Market Analysis 2021 to 2025 and Forecast 2026 to 2036, By Region
    • Introduction
    • Historical Market Size Value (USD Million) Analysis By Region, 2021 to 2025
    • Current Market Size Value (USD Million) Analysis and Forecast By Region, 2026 to 2036
      • North America
      • Latin America
      • Western Europe
      • Eastern Europe
      • East Asia
      • South Asia and Pacific
      • Middle East & Africa
    • Market Attractiveness Analysis By Region
  13. North America Market Analysis 2021 to 2025 and Forecast 2026 to 2036, By Country
    • Historical Market Size Value (USD Million) Trend Analysis By Market Taxonomy, 2021 to 2025
    • Market Size Value (USD Million) Forecast By Market Taxonomy, 2026 to 2036
      • By Country
        • USA
        • Canada
        • Mexico
      • By Product
      • By Animal Type
      • By End Use
      • By Procedure
      • By Application
    • Market Attractiveness Analysis
      • By Country
      • By Product
      • By Animal Type
      • By End Use
      • By Procedure
      • By Application
    • Key Takeaways
  14. Latin America Market Analysis 2021 to 2025 and Forecast 2026 to 2036, By Country
    • Historical Market Size Value (USD Million) Trend Analysis By Market Taxonomy, 2021 to 2025
    • Market Size Value (USD Million) Forecast By Market Taxonomy, 2026 to 2036
      • By Country
        • Brazil
        • Chile
        • Rest of Latin America
      • By Product
      • By Animal Type
      • By End Use
      • By Procedure
      • By Application
    • Market Attractiveness Analysis
      • By Country
      • By Product
      • By Animal Type
      • By End Use
      • By Procedure
      • By Application
    • Key Takeaways
  15. Western Europe Market Analysis 2021 to 2025 and Forecast 2026 to 2036, By Country
    • Historical Market Size Value (USD Million) Trend Analysis By Market Taxonomy, 2021 to 2025
    • Market Size Value (USD Million) Forecast By Market Taxonomy, 2026 to 2036
      • By Country
        • Germany
        • UK
        • Italy
        • Spain
        • France
        • Nordic
        • BENELUX
        • Rest of Western Europe
      • By Product
      • By Animal Type
      • By End Use
      • By Procedure
      • By Application
    • Market Attractiveness Analysis
      • By Country
      • By Product
      • By Animal Type
      • By End Use
      • By Procedure
      • By Application
    • Key Takeaways
  16. Eastern Europe Market Analysis 2021 to 2025 and Forecast 2026 to 2036, By Country
    • Historical Market Size Value (USD Million) Trend Analysis By Market Taxonomy, 2021 to 2025
    • Market Size Value (USD Million) Forecast By Market Taxonomy, 2026 to 2036
      • By Country
        • Russia
        • Poland
        • Hungary
        • Balkan & Baltic
        • Rest of Eastern Europe
      • By Product
      • By Animal Type
      • By End Use
      • By Procedure
      • By Application
    • Market Attractiveness Analysis
      • By Country
      • By Product
      • By Animal Type
      • By End Use
      • By Procedure
      • By Application
    • Key Takeaways
  17. East Asia Market Analysis 2021 to 2025 and Forecast 2026 to 2036, By Country
    • Historical Market Size Value (USD Million) Trend Analysis By Market Taxonomy, 2021 to 2025
    • Market Size Value (USD Million) Forecast By Market Taxonomy, 2026 to 2036
      • By Country
        • China
        • Japan
        • South Korea
      • By Product
      • By Animal Type
      • By End Use
      • By Procedure
      • By Application
    • Market Attractiveness Analysis
      • By Country
      • By Product
      • By Animal Type
      • By End Use
      • By Procedure
      • By Application
    • Key Takeaways
  18. South Asia and Pacific Market Analysis 2021 to 2025 and Forecast 2026 to 2036, By Country
    • Historical Market Size Value (USD Million) Trend Analysis By Market Taxonomy, 2021 to 2025
    • Market Size Value (USD Million) Forecast By Market Taxonomy, 2026 to 2036
      • By Country
        • India
        • ASEAN
        • Australia & New Zealand
        • Rest of South Asia and Pacific
      • By Product
      • By Animal Type
      • By End Use
      • By Procedure
      • By Application
    • Market Attractiveness Analysis
      • By Country
      • By Product
      • By Animal Type
      • By End Use
      • By Procedure
      • By Application
    • Key Takeaways
  19. Middle East & Africa Market Analysis 2021 to 2025 and Forecast 2026 to 2036, By Country
    • Historical Market Size Value (USD Million) Trend Analysis By Market Taxonomy, 2021 to 2025
    • Market Size Value (USD Million) Forecast By Market Taxonomy, 2026 to 2036
      • By Country
        • Kingdom of Saudi Arabia
        • Other GCC Countries
        • Turkiye
        • South Africa
        • Other African Union
        • Rest of Middle East & Africa
      • By Product
      • By Animal Type
      • By End Use
      • By Procedure
      • By Application
    • Market Attractiveness Analysis
      • By Country
      • By Product
      • By Animal Type
      • By End Use
      • By Procedure
      • By Application
    • Key Takeaways
  20. Key Countries Market Analysis
    • USA
      • Pricing Analysis
      • Market Share Analysis, 2025
        • By Product
        • By Animal Type
        • By End Use
        • By Procedure
        • By Application
    • Canada
      • Pricing Analysis
      • Market Share Analysis, 2025
        • By Product
        • By Animal Type
        • By End Use
        • By Procedure
        • By Application
    • Mexico
      • Pricing Analysis
      • Market Share Analysis, 2025
        • By Product
        • By Animal Type
        • By End Use
        • By Procedure
        • By Application
    • Brazil
      • Pricing Analysis
      • Market Share Analysis, 2025
        • By Product
        • By Animal Type
        • By End Use
        • By Procedure
        • By Application
    • Chile
      • Pricing Analysis
      • Market Share Analysis, 2025
        • By Product
        • By Animal Type
        • By End Use
        • By Procedure
        • By Application
    • Germany
      • Pricing Analysis
      • Market Share Analysis, 2025
        • By Product
        • By Animal Type
        • By End Use
        • By Procedure
        • By Application
    • UK
      • Pricing Analysis
      • Market Share Analysis, 2025
        • By Product
        • By Animal Type
        • By End Use
        • By Procedure
        • By Application
    • Italy
      • Pricing Analysis
      • Market Share Analysis, 2025
        • By Product
        • By Animal Type
        • By End Use
        • By Procedure
        • By Application
    • Spain
      • Pricing Analysis
      • Market Share Analysis, 2025
        • By Product
        • By Animal Type
        • By End Use
        • By Procedure
        • By Application
    • France
      • Pricing Analysis
      • Market Share Analysis, 2025
        • By Product
        • By Animal Type
        • By End Use
        • By Procedure
        • By Application
    • India
      • Pricing Analysis
      • Market Share Analysis, 2025
        • By Product
        • By Animal Type
        • By End Use
        • By Procedure
        • By Application
    • ASEAN
      • Pricing Analysis
      • Market Share Analysis, 2025
        • By Product
        • By Animal Type
        • By End Use
        • By Procedure
        • By Application
    • Australia & New Zealand
      • Pricing Analysis
      • Market Share Analysis, 2025
        • By Product
        • By Animal Type
        • By End Use
        • By Procedure
        • By Application
    • China
      • Pricing Analysis
      • Market Share Analysis, 2025
        • By Product
        • By Animal Type
        • By End Use
        • By Procedure
        • By Application
    • Japan
      • Pricing Analysis
      • Market Share Analysis, 2025
        • By Product
        • By Animal Type
        • By End Use
        • By Procedure
        • By Application
    • South Korea
      • Pricing Analysis
      • Market Share Analysis, 2025
        • By Product
        • By Animal Type
        • By End Use
        • By Procedure
        • By Application
    • Russia
      • Pricing Analysis
      • Market Share Analysis, 2025
        • By Product
        • By Animal Type
        • By End Use
        • By Procedure
        • By Application
    • Poland
      • Pricing Analysis
      • Market Share Analysis, 2025
        • By Product
        • By Animal Type
        • By End Use
        • By Procedure
        • By Application
    • Hungary
      • Pricing Analysis
      • Market Share Analysis, 2025
        • By Product
        • By Animal Type
        • By End Use
        • By Procedure
        • By Application
    • Kingdom of Saudi Arabia
      • Pricing Analysis
      • Market Share Analysis, 2025
        • By Product
        • By Animal Type
        • By End Use
        • By Procedure
        • By Application
    • Turkiye
      • Pricing Analysis
      • Market Share Analysis, 2025
        • By Product
        • By Animal Type
        • By End Use
        • By Procedure
        • By Application
    • South Africa
      • Pricing Analysis
      • Market Share Analysis, 2025
        • By Product
        • By Animal Type
        • By End Use
        • By Procedure
        • By Application
  21. Market Structure Analysis
    • Competition Dashboard
    • Competition Benchmarking
    • Market Share Analysis of Top Players
      • By Regional
      • By Product
      • By Animal Type
      • By End Use
      • By Procedure
      • By Application
  22. Competition Analysis
    • Competition Deep Dive
      • Karl Storz SE & Co. KG
        • Overview
        • Product Portfolio
        • Profitability by Market Segments (Product/Age /Sales Channel/Region)
        • Sales Footprint
        • Strategy Overview
          • Marketing Strategy
          • Product Strategy
          • Channel Strategy
      • Olympus Corporation
      • Fujifilm Holdings Corporation
      • Stryker Corporation
      • B. Braun Melsungen AG
      • Richard Wolf GmbH
  23. Assumptions & Acronyms Used

List Of Table

  • Table 1: Global Market Value (USD Million) Forecast by Region, 2021 to 2036
  • Table 2: Global Market Value (USD Million) Forecast by Product , 2021 to 2036
  • Table 3: Global Market Value (USD Million) Forecast by Animal Type, 2021 to 2036
  • Table 4: Global Market Value (USD Million) Forecast by End Use, 2021 to 2036
  • Table 5: Global Market Value (USD Million) Forecast by Procedure, 2021 to 2036
  • Table 6: Global Market Value (USD Million) Forecast by Application, 2021 to 2036
  • Table 7: North America Market Value (USD Million) Forecast by Country, 2021 to 2036
  • Table 8: North America Market Value (USD Million) Forecast by Product , 2021 to 2036
  • Table 9: North America Market Value (USD Million) Forecast by Animal Type, 2021 to 2036
  • Table 10: North America Market Value (USD Million) Forecast by End Use, 2021 to 2036
  • Table 11: North America Market Value (USD Million) Forecast by Procedure, 2021 to 2036
  • Table 12: North America Market Value (USD Million) Forecast by Application, 2021 to 2036
  • Table 13: Latin America Market Value (USD Million) Forecast by Country, 2021 to 2036
  • Table 14: Latin America Market Value (USD Million) Forecast by Product , 2021 to 2036
  • Table 15: Latin America Market Value (USD Million) Forecast by Animal Type, 2021 to 2036
  • Table 16: Latin America Market Value (USD Million) Forecast by End Use, 2021 to 2036
  • Table 17: Latin America Market Value (USD Million) Forecast by Procedure, 2021 to 2036
  • Table 18: Latin America Market Value (USD Million) Forecast by Application, 2021 to 2036
  • Table 19: Western Europe Market Value (USD Million) Forecast by Country, 2021 to 2036
  • Table 20: Western Europe Market Value (USD Million) Forecast by Product , 2021 to 2036
  • Table 21: Western Europe Market Value (USD Million) Forecast by Animal Type, 2021 to 2036
  • Table 22: Western Europe Market Value (USD Million) Forecast by End Use, 2021 to 2036
  • Table 23: Western Europe Market Value (USD Million) Forecast by Procedure, 2021 to 2036
  • Table 24: Western Europe Market Value (USD Million) Forecast by Application, 2021 to 2036
  • Table 25: Eastern Europe Market Value (USD Million) Forecast by Country, 2021 to 2036
  • Table 26: Eastern Europe Market Value (USD Million) Forecast by Product , 2021 to 2036
  • Table 27: Eastern Europe Market Value (USD Million) Forecast by Animal Type, 2021 to 2036
  • Table 28: Eastern Europe Market Value (USD Million) Forecast by End Use, 2021 to 2036
  • Table 29: Eastern Europe Market Value (USD Million) Forecast by Procedure, 2021 to 2036
  • Table 30: Eastern Europe Market Value (USD Million) Forecast by Application, 2021 to 2036
  • Table 31: East Asia Market Value (USD Million) Forecast by Country, 2021 to 2036
  • Table 32: East Asia Market Value (USD Million) Forecast by Product , 2021 to 2036
  • Table 33: East Asia Market Value (USD Million) Forecast by Animal Type, 2021 to 2036
  • Table 34: East Asia Market Value (USD Million) Forecast by End Use, 2021 to 2036
  • Table 35: East Asia Market Value (USD Million) Forecast by Procedure, 2021 to 2036
  • Table 36: East Asia Market Value (USD Million) Forecast by Application, 2021 to 2036
  • Table 37: South Asia and Pacific Market Value (USD Million) Forecast by Country, 2021 to 2036
  • Table 38: South Asia and Pacific Market Value (USD Million) Forecast by Product , 2021 to 2036
  • Table 39: South Asia and Pacific Market Value (USD Million) Forecast by Animal Type, 2021 to 2036
  • Table 40: South Asia and Pacific Market Value (USD Million) Forecast by End Use, 2021 to 2036
  • Table 41: South Asia and Pacific Market Value (USD Million) Forecast by Procedure, 2021 to 2036
  • Table 42: South Asia and Pacific Market Value (USD Million) Forecast by Application, 2021 to 2036
  • Table 43: Middle East & Africa Market Value (USD Million) Forecast by Country, 2021 to 2036
  • Table 44: Middle East & Africa Market Value (USD Million) Forecast by Product , 2021 to 2036
  • Table 45: Middle East & Africa Market Value (USD Million) Forecast by Animal Type, 2021 to 2036
  • Table 46: Middle East & Africa Market Value (USD Million) Forecast by End Use, 2021 to 2036
  • Table 47: Middle East & Africa Market Value (USD Million) Forecast by Procedure, 2021 to 2036
  • Table 48: Middle East & Africa Market Value (USD Million) Forecast by Application, 2021 to 2036

List Of Figures

  • Figure 1: Global Market Pricing Analysis
  • Figure 2: Global Market Value (USD Million) Forecast 2021-2036
  • Figure 3: Global Market Value Share and BPS Analysis by Product, 2026 and 2036
  • Figure 4: Global Market Y-o-Y Growth Comparison by Product, 2026 to 2036
  • Figure 5: Global Market Attractiveness Analysis by Product
  • Figure 6: Global Market Value Share and BPS Analysis by Animal Type, 2026 and 2036
  • Figure 7: Global Market Y-o-Y Growth Comparison by Animal Type, 2026 to 2036
  • Figure 8: Global Market Attractiveness Analysis by Animal Type
  • Figure 9: Global Market Value Share and BPS Analysis by End Use, 2026 and 2036
  • Figure 10: Global Market Y-o-Y Growth Comparison by End Use, 2026 to 2036
  • Figure 11: Global Market Attractiveness Analysis by End Use
  • Figure 12: Global Market Value Share and BPS Analysis by Procedure, 2026 and 2036
  • Figure 13: Global Market Y-o-Y Growth Comparison by Procedure, 2026 to 2036
  • Figure 14: Global Market Attractiveness Analysis by Procedure
  • Figure 15: Global Market Value Share and BPS Analysis by Application, 2026 and 2036
  • Figure 16: Global Market Y-o-Y Growth Comparison by Application, 2026 to 2036
  • Figure 17: Global Market Attractiveness Analysis by Application
  • Figure 18: Global Market Value (USD Million) Share and BPS Analysis by Region, 2026 and 2036
  • Figure 19: Global Market Y-o-Y Growth Comparison by Region, 2026 to 2036
  • Figure 20: Global Market Attractiveness Analysis by Region
  • Figure 21: North America Market Incremental Dollar Opportunity, 2026 to 2036
  • Figure 22: Latin America Market Incremental Dollar Opportunity, 2026 to 2036
  • Figure 23: Western Europe Market Incremental Dollar Opportunity, 2026 to 2036
  • Figure 24: Eastern Europe Market Incremental Dollar Opportunity, 2026 to 2036
  • Figure 25: East Asia Market Incremental Dollar Opportunity, 2026 to 2036
  • Figure 26: South Asia and Pacific Market Incremental Dollar Opportunity, 2026 to 2036
  • Figure 27: Middle East & Africa Market Incremental Dollar Opportunity, 2026 to 2036
  • Figure 28: North America Market Value Share and BPS Analysis by Country, 2026 and 2036
  • Figure 29: North America Market Value Share and BPS Analysis by Product, 2026 and 2036
  • Figure 30: North America Market Y-o-Y Growth Comparison by Product, 2026 to 2036
  • Figure 31: North America Market Attractiveness Analysis by Product
  • Figure 32: North America Market Value Share and BPS Analysis by Animal Type, 2026 and 2036
  • Figure 33: North America Market Y-o-Y Growth Comparison by Animal Type, 2026 to 2036
  • Figure 34: North America Market Attractiveness Analysis by Animal Type
  • Figure 35: North America Market Value Share and BPS Analysis by End Use, 2026 and 2036
  • Figure 36: North America Market Y-o-Y Growth Comparison by End Use, 2026 to 2036
  • Figure 37: North America Market Attractiveness Analysis by End Use
  • Figure 38: North America Market Value Share and BPS Analysis by Procedure, 2026 and 2036
  • Figure 39: North America Market Y-o-Y Growth Comparison by Procedure, 2026 to 2036
  • Figure 40: North America Market Attractiveness Analysis by Procedure
  • Figure 41: North America Market Value Share and BPS Analysis by Application, 2026 and 2036
  • Figure 42: North America Market Y-o-Y Growth Comparison by Application, 2026 to 2036
  • Figure 43: North America Market Attractiveness Analysis by Application
  • Figure 44: Latin America Market Value Share and BPS Analysis by Country, 2026 and 2036
  • Figure 45: Latin America Market Value Share and BPS Analysis by Product, 2026 and 2036
  • Figure 46: Latin America Market Y-o-Y Growth Comparison by Product, 2026 to 2036
  • Figure 47: Latin America Market Attractiveness Analysis by Product
  • Figure 48: Latin America Market Value Share and BPS Analysis by Animal Type, 2026 and 2036
  • Figure 49: Latin America Market Y-o-Y Growth Comparison by Animal Type, 2026 to 2036
  • Figure 50: Latin America Market Attractiveness Analysis by Animal Type
  • Figure 51: Latin America Market Value Share and BPS Analysis by End Use, 2026 and 2036
  • Figure 52: Latin America Market Y-o-Y Growth Comparison by End Use, 2026 to 2036
  • Figure 53: Latin America Market Attractiveness Analysis by End Use
  • Figure 54: Latin America Market Value Share and BPS Analysis by Procedure, 2026 and 2036
  • Figure 55: Latin America Market Y-o-Y Growth Comparison by Procedure, 2026 to 2036
  • Figure 56: Latin America Market Attractiveness Analysis by Procedure
  • Figure 57: Latin America Market Value Share and BPS Analysis by Application, 2026 and 2036
  • Figure 58: Latin America Market Y-o-Y Growth Comparison by Application, 2026 to 2036
  • Figure 59: Latin America Market Attractiveness Analysis by Application
  • Figure 60: Western Europe Market Value Share and BPS Analysis by Country, 2026 and 2036
  • Figure 61: Western Europe Market Value Share and BPS Analysis by Product, 2026 and 2036
  • Figure 62: Western Europe Market Y-o-Y Growth Comparison by Product, 2026 to 2036
  • Figure 63: Western Europe Market Attractiveness Analysis by Product
  • Figure 64: Western Europe Market Value Share and BPS Analysis by Animal Type, 2026 and 2036
  • Figure 65: Western Europe Market Y-o-Y Growth Comparison by Animal Type, 2026 to 2036
  • Figure 66: Western Europe Market Attractiveness Analysis by Animal Type
  • Figure 67: Western Europe Market Value Share and BPS Analysis by End Use, 2026 and 2036
  • Figure 68: Western Europe Market Y-o-Y Growth Comparison by End Use, 2026 to 2036
  • Figure 69: Western Europe Market Attractiveness Analysis by End Use
  • Figure 70: Western Europe Market Value Share and BPS Analysis by Procedure, 2026 and 2036
  • Figure 71: Western Europe Market Y-o-Y Growth Comparison by Procedure, 2026 to 2036
  • Figure 72: Western Europe Market Attractiveness Analysis by Procedure
  • Figure 73: Western Europe Market Value Share and BPS Analysis by Application, 2026 and 2036
  • Figure 74: Western Europe Market Y-o-Y Growth Comparison by Application, 2026 to 2036
  • Figure 75: Western Europe Market Attractiveness Analysis by Application
  • Figure 76: Eastern Europe Market Value Share and BPS Analysis by Country, 2026 and 2036
  • Figure 77: Eastern Europe Market Value Share and BPS Analysis by Product, 2026 and 2036
  • Figure 78: Eastern Europe Market Y-o-Y Growth Comparison by Product, 2026 to 2036
  • Figure 79: Eastern Europe Market Attractiveness Analysis by Product
  • Figure 80: Eastern Europe Market Value Share and BPS Analysis by Animal Type, 2026 and 2036
  • Figure 81: Eastern Europe Market Y-o-Y Growth Comparison by Animal Type, 2026 to 2036
  • Figure 82: Eastern Europe Market Attractiveness Analysis by Animal Type
  • Figure 83: Eastern Europe Market Value Share and BPS Analysis by End Use, 2026 and 2036
  • Figure 84: Eastern Europe Market Y-o-Y Growth Comparison by End Use, 2026 to 2036
  • Figure 85: Eastern Europe Market Attractiveness Analysis by End Use
  • Figure 86: Eastern Europe Market Value Share and BPS Analysis by Procedure, 2026 and 2036
  • Figure 87: Eastern Europe Market Y-o-Y Growth Comparison by Procedure, 2026 to 2036
  • Figure 88: Eastern Europe Market Attractiveness Analysis by Procedure
  • Figure 89: Eastern Europe Market Value Share and BPS Analysis by Application, 2026 and 2036
  • Figure 90: Eastern Europe Market Y-o-Y Growth Comparison by Application, 2026 to 2036
  • Figure 91: Eastern Europe Market Attractiveness Analysis by Application
  • Figure 92: East Asia Market Value Share and BPS Analysis by Country, 2026 and 2036
  • Figure 93: East Asia Market Value Share and BPS Analysis by Product, 2026 and 2036
  • Figure 94: East Asia Market Y-o-Y Growth Comparison by Product, 2026 to 2036
  • Figure 95: East Asia Market Attractiveness Analysis by Product
  • Figure 96: East Asia Market Value Share and BPS Analysis by Animal Type, 2026 and 2036
  • Figure 97: East Asia Market Y-o-Y Growth Comparison by Animal Type, 2026 to 2036
  • Figure 98: East Asia Market Attractiveness Analysis by Animal Type
  • Figure 99: East Asia Market Value Share and BPS Analysis by End Use, 2026 and 2036
  • Figure 100: East Asia Market Y-o-Y Growth Comparison by End Use, 2026 to 2036
  • Figure 101: East Asia Market Attractiveness Analysis by End Use
  • Figure 102: East Asia Market Value Share and BPS Analysis by Procedure, 2026 and 2036
  • Figure 103: East Asia Market Y-o-Y Growth Comparison by Procedure, 2026 to 2036
  • Figure 104: East Asia Market Attractiveness Analysis by Procedure
  • Figure 105: East Asia Market Value Share and BPS Analysis by Application, 2026 and 2036
  • Figure 106: East Asia Market Y-o-Y Growth Comparison by Application, 2026 to 2036
  • Figure 107: East Asia Market Attractiveness Analysis by Application
  • Figure 108: South Asia and Pacific Market Value Share and BPS Analysis by Country, 2026 and 2036
  • Figure 109: South Asia and Pacific Market Value Share and BPS Analysis by Product, 2026 and 2036
  • Figure 110: South Asia and Pacific Market Y-o-Y Growth Comparison by Product, 2026 to 2036
  • Figure 111: South Asia and Pacific Market Attractiveness Analysis by Product
  • Figure 112: South Asia and Pacific Market Value Share and BPS Analysis by Animal Type, 2026 and 2036
  • Figure 113: South Asia and Pacific Market Y-o-Y Growth Comparison by Animal Type, 2026 to 2036
  • Figure 114: South Asia and Pacific Market Attractiveness Analysis by Animal Type
  • Figure 115: South Asia and Pacific Market Value Share and BPS Analysis by End Use, 2026 and 2036
  • Figure 116: South Asia and Pacific Market Y-o-Y Growth Comparison by End Use, 2026 to 2036
  • Figure 117: South Asia and Pacific Market Attractiveness Analysis by End Use
  • Figure 118: South Asia and Pacific Market Value Share and BPS Analysis by Procedure, 2026 and 2036
  • Figure 119: South Asia and Pacific Market Y-o-Y Growth Comparison by Procedure, 2026 to 2036
  • Figure 120: South Asia and Pacific Market Attractiveness Analysis by Procedure
  • Figure 121: South Asia and Pacific Market Value Share and BPS Analysis by Application, 2026 and 2036
  • Figure 122: South Asia and Pacific Market Y-o-Y Growth Comparison by Application, 2026 to 2036
  • Figure 123: South Asia and Pacific Market Attractiveness Analysis by Application
  • Figure 124: Middle East & Africa Market Value Share and BPS Analysis by Country, 2026 and 2036
  • Figure 125: Middle East & Africa Market Value Share and BPS Analysis by Product, 2026 and 2036
  • Figure 126: Middle East & Africa Market Y-o-Y Growth Comparison by Product, 2026 to 2036
  • Figure 127: Middle East & Africa Market Attractiveness Analysis by Product
  • Figure 128: Middle East & Africa Market Value Share and BPS Analysis by Animal Type, 2026 and 2036
  • Figure 129: Middle East & Africa Market Y-o-Y Growth Comparison by Animal Type, 2026 to 2036
  • Figure 130: Middle East & Africa Market Attractiveness Analysis by Animal Type
  • Figure 131: Middle East & Africa Market Value Share and BPS Analysis by End Use, 2026 and 2036
  • Figure 132: Middle East & Africa Market Y-o-Y Growth Comparison by End Use, 2026 to 2036
  • Figure 133: Middle East & Africa Market Attractiveness Analysis by End Use
  • Figure 134: Middle East & Africa Market Value Share and BPS Analysis by Procedure, 2026 and 2036
  • Figure 135: Middle East & Africa Market Y-o-Y Growth Comparison by Procedure, 2026 to 2036
  • Figure 136: Middle East & Africa Market Attractiveness Analysis by Procedure
  • Figure 137: Middle East & Africa Market Value Share and BPS Analysis by Application, 2026 and 2036
  • Figure 138: Middle East & Africa Market Y-o-Y Growth Comparison by Application, 2026 to 2036
  • Figure 139: Middle East & Africa Market Attractiveness Analysis by Application
  • Figure 140: Global Market - Tier Structure Analysis
  • Figure 141: Global Market - Company Share Analysis

Cardiac Rehabilitation Devices Market