- Market Value (2025): USD 1,387.4 Bn
- Estimated Value (2026): USD 1,452.6 Bn
- Forecast Value (2036): USD 2,299.4 Bn
- CAGR (2026-2036): 4.7%
What is the Cellular Network Subscription Market forecast to be worth by 2036?
USD 1,452.6 billion in 2026 to USD 2,299.4 billion by 2036 at 4.7% CAGR.
- The cellular network subscription market reached USD 1,387.4 billion in 2025 when mobile operators retained large recurring account bases.
- Demand is projected to increase from USD 1,452.6 billion in 2026 to USD 2,299.4 billion by 2036.
- The market is forecast to record 4.7% CAGR from 2026 to 2036 as operators attach more household and enterprise services to existing accounts.
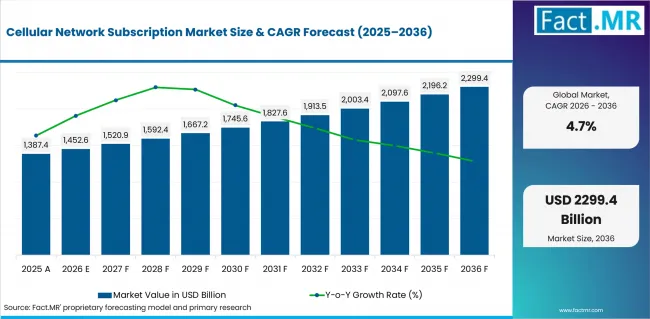
Cellular Network Subscription Market Value Analysis | Source: Fact.MR
What are the defining numbers behind Cellular Network Subscription Market growth?
USD 846.8 billion absolute opportunity is forecast by 2036.
- Demand Drivers in the Market
- Data-heavy smartphone use is expected to lift plan value when customers rely on mobile access for payments and daily apps. The M-Commerce Payment Market shows the same daily dependence on mobile accounts.
- Family plans are likely to protect recurring revenue when device financing and shared billing reduce the need for repeated top-ups.
- Enterprise buyers are expected to add managed lines for field teams and connected assets. The IoT Cloud Platform Market supports this demand where devices need remote control.
- Key Segments Analyzed
- By Network Technology: 4G LTE is expected to hold 46.0% share in 2026 because it remains the broadest compatibility and coverage layer.
- By Subscription Type: Postpaid is projected to account for 58.0% share in 2026 since handset financing and family billing favor recurring accounts.
- By End User: Consumer is anticipated to capture 74.0% share in 2026 with smartphones serving as the main access point for digital services.
- By Service Type: Voice & Data is estimated to represent 61.0% share in 2026 where users still buy communication and data access together.
- By Connection Type: Smartphones are forecast to hold 67.0% share in 2026 given that handset plans remain the main revenue anchor for operators.
- Analyst Opinion at Fact.MR
- Shambhu Nath Jha, Principal Consultant at Fact.MR, states, “Winning operators must connect network investment to simple tariff design and visible service value. Coverage alone cannot protect pricing when switching is easy. Revenue capture is expected to come from core smartphone accounts and added household lines.”
- Strategic Implications
- Operators can build tariff ladders around real service value instead of headline data allowances.
- MVNOs and digital-first brands need clear renewal offers since mature markets make price comparison easier.
- Investors should separate subscriber scale from monetization quality.
South Korea is forecast to record 5.8% CAGR from 2026 to 2036 with premium data use and faster network migration. The USA is expected to record 5.5% CAGR through postpaid depth and fixed wireless account growth. The UK is projected at 5.2% due to active plan comparison and bundle-led retention. Canada is anticipated to reach 4.9% where remote coverage costs shape service planning. Germany is estimated at 4.6% with broad LTE use and 5G plan migration. Australia is forecast at 4.3% through dispersed access needs and business mobility demand. Japan is expected to post 4.0% because renewal gains depend on service differentiation in a mature base.
How does the Cellular Network Subscription Market break down by segment?
4G LTE is expected to lead Network Technology at 46.0% share in 2026. Postpaid is projected to lead Subscription Type at 58.0% share. Consumer accounts represent 74.0% of End User demand.
Why does 4G LTE lead Network Technology?
4G LTE is projected to account for 46.0% share in 2026.
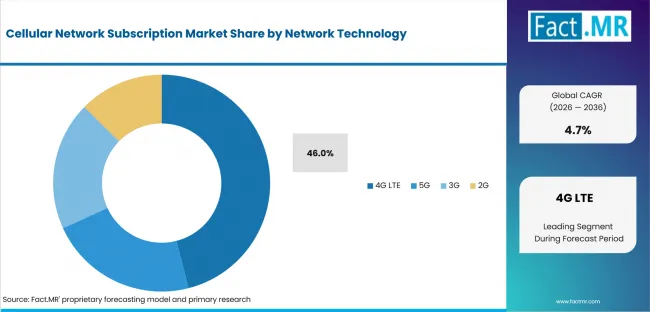
Cellular Network Subscription Market Analysis By Network Technology | Source: Fact.MR
4G LTE remains the commercial workhorse because it offers wide coverage and mature device support. Operators can serve mainstream users without forcing every customer to move to a 5G device.
Why does Postpaid lead Subscription Type?
Postpaid is expected to account for 58.0% share in 2026.
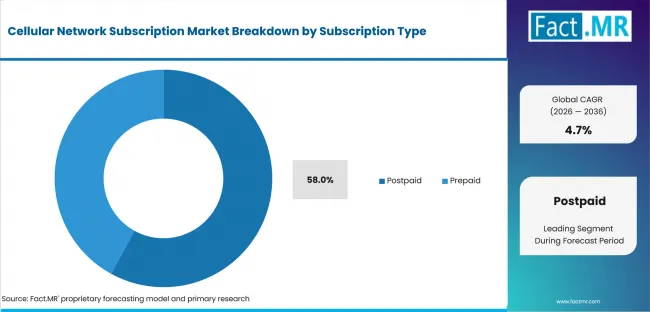
Cellular Network Subscription Market Analysis By Subscription Type | Source: Fact.MR
Postpaid plans fit device installments and family accounts. They give operators a steady monthly billing route and support add-ons for tablets and wearables.
Why does Consumer lead End User?
A 74.0% share is anticipated for Consumer in 2026.
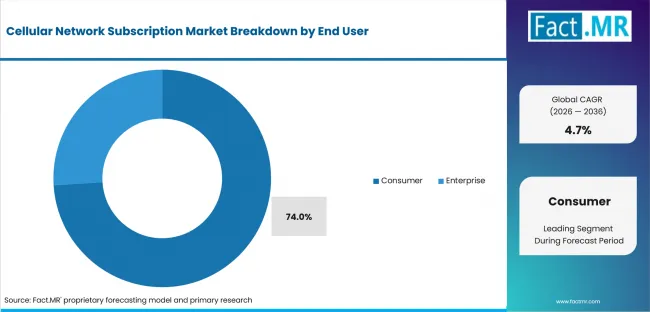
Cellular Network Subscription Market Analysis By End User | Source: Fact.MR
Consumer accounts are forecast to form the largest subscription pool because smartphones carry communication and daily digital services. Family plans multiply connections per household and make churn control central.
What supports Voice & Data within Service Type?
Voice & Data is estimated to represent 61.0% share in 2026.
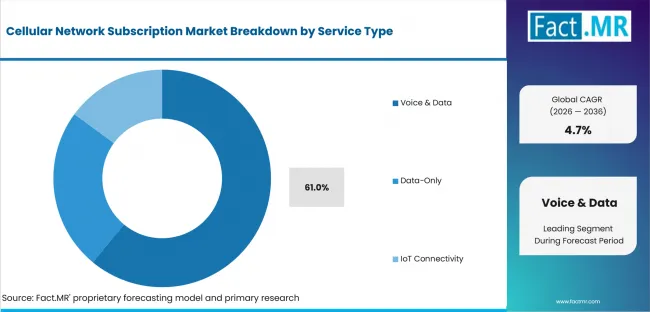
Cellular Network Subscription Market Analysis By Service Type | Source: Fact.MR
Voice & Data remains the default bundle for mainstream users. Voice access and mobile internet are still bought together in primary phone plans. Data-only plans rarely replace the main handset subscription.
Why do Smartphones lead Connection Type?
Smartphones are forecast to hold 67.0% share in 2026.
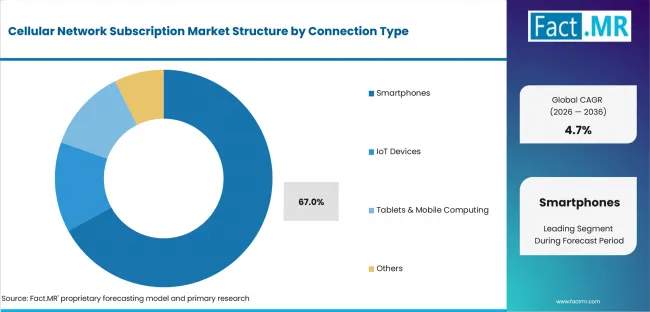
Cellular Network Subscription Market Analysis By Connection Type | Source: Fact.MR
Smartphones remain the main subscription anchor because they connect identity and daily applications. The 5G Services Market can increase plan value where premium access is priced clearly.
What is accelerating Cellular Network Subscription Market adoption, and what is holding it back?
Demand is expected to rise with heavy smartphone data use and bundled mobile plans. Growth may be limited by high prices and network investment costs.
Drivers Impact Analysis
| DRIVER | (~) % IMPACT ON CAGR | GEOGRAPHIC RELEVANCE | IMPACT TIMELINE |
|---|---|---|---|
| Data growth and device additions | +1.4% | USA, UK, South Korea | Short term (<= 2 years) |
| 4G-to-5G tariff migration | +1.0% | USA, Japan, Germany | Medium term (2-4 years) |
| Fixed wireless household accounts | +0.8% | USA, Canada, Australia | Short term (<= 2 years) |
| Enterprise mobility and IoT lines | +0.7% | Germany, Japan, South Korea | Medium term (2-4 years) |
| Satellite-enabled coverage extensions | +0.4% | USA, Canada, Australia | Long term (>= 4 years) |
Source: Fact.MR analysis. Updated Aug 3, 2026
- Data growth and device additions: Heavier app use is expected to lift monthly plan value when households attach more devices to one account.
- 4G-to-5G tariff migration: Operators are expected to move selected users into premium service tiers once coverage and handset readiness are clear.
- Fixed wireless household accounts: Mobile capacity is expected to become home broadband where installation speed matters more than wired network ownership.
Opportunity Impact Analysis
| OPPORTUNITY | (~) % IMPACT ON CAGR | GEOGRAPHIC RELEVANCE | IMPACT TIMELINE |
|---|---|---|---|
| Converged household connectivity | +0.8% | USA, Canada and Australia | Short term (<= 2 years) |
| Enterprise account bundling | +0.7% | Germany and Japan | Medium term (2-4 years) |
| Satellite direct-to-device add-ons | +0.5% | USA and Canada | Long term (>= 4 years) |
| API and security service layers | +0.4% | UK and South Korea | Medium term (2-4 years) |
Source: Fact.MR analysis. Updated Aug 3, 2026
- Converged household connectivity: Fixed wireless and mobile bundles are expected to improve retention when one provider covers phone and home access.
- Enterprise account bundling: Operators that combine mobility and device management can deepen relationships with business customers.
- Satellite direct-to-device add-ons: Coverage backup is expected to improve subscription value where remote-area messaging matters.
Restraints Impact Analysis
| RESTRAINT | (~) % IMPACT ON CAGR | GEOGRAPHIC RELEVANCE | IMPACT TIMELINE |
|---|---|---|---|
| Affordability and switching pressure | -0.9% | USA, UK, Germany | Short term (<= 2 years) |
| SIM-only price transparency | -0.7% | UK and Canada | Short term (<= 2 years) |
| Spectrum and network investment burden | -0.6% | USA, Germany, Japan | Medium term (2-4 years) |
| Churn in mature smartphone bases | -0.5% | Japan and Germany | Medium term (2-4 years) |
Source: Fact.MR analysis. Updated Aug 3, 2026
- Affordability and switching pressure: Customers compare renewal prices against visible service improvement. This limits room for tariff increases.
- SIM-only price transparency: Simple plan comparison can reduce loyalty when handset financing is not tied to the subscription.
- Spectrum and network investment burden: Operators must fund coverage and capacity upgrades before higher service tiers can be priced with confidence.
Which countries are scaling Cellular Network Subscription Market fastest?
The country comparison is defined by South Korea’s lead. The USA, the UK and Canada form the next group. Germany and Australia hold measured positions. Japan remains lower because the smartphone base is mature.
- South Korea leads the list because premium data use and fast network migration support higher-value plans.
- The USA follows through postpaid depth and fixed wireless account growth.
- UK demand is shaped by active plan comparison, so bundle clarity remains central.
- Canada reflects a wider coverage problem where urban capacity and remote service costs move together.
- Germany develops through dependable service needs and enterprise connectivity.
- Australia gains from dispersed access needs across residential and business users.
- Japan remains lower because renewal gains depend on better plan value in a mature smartphone base.
Comparable CAGRs can create different entry conditions across these countries. Deployment timing depends on tariff clarity and local service depth. Country execution connects with the Workload Scheduling Automation Market where reliable scheduling supports service delivery across accounts.
The full report provides country-level CAGR analysis across the main global regions.
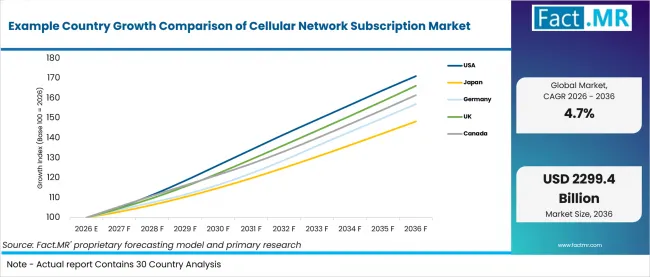
Example Country Growth Comparison Of Cellular Network Subscription Market | Source: Fact.MR
| Country | CAGR (2026-2036) |
|---|---|
| USA | 5.5% |
| Japan | 4.0% |
| Germany | 4.6% |
| UK | 5.2% |
| Canada | 4.9% |
| Australia | 4.3% |
| South Korea | 5.8% |
Source: Fact.MR analysis. Updated Aug 3, 2026
What supports USA adoption?
5.5% CAGR, supported by postpaid depth and fixed wireless account growth.
Large postpaid bases give the USA a higher-value starting point. Operators are expected to use unlimited plans and fixed wireless access to protect recurring accounts. Enterprise mobility adds another route.
How is Japan developing demand?
4.0% CAGR, led by network quality expectations and enterprise digital services.
Japan begins from a mature smartphone base where customers already expect dependable service. Renewal growth is expected to depend on network quality and simple plan differentiation.
What shapes Germany’s outlook?
4.6% CAGR, backed by broad LTE use and expanding 5G plan migration.
Germany’s demand path is shaped by dependable network service and enterprise-grade connectivity. Operators must show that upgrades improve everyday service before customers accept higher tariffs.
How does the UK convert subscription demand?
5.2% CAGR, supported by active plan comparison and bundle-led retention.
UK customers compare SIM-only plans and handset-inclusive offers closely. Operators are expected to defend renewals through clear bundles and visible service gains.
What supports Canada’s growth?
4.9% CAGR, driven by urban capacity needs and remote coverage economics.
Canada’s market must balance dense urban usage with costly remote coverage. Multi-line household accounts and fixed wireless access can improve revenue depth.
How is Australia expanding demand?
4.3% CAGR, supported by dispersed access needs and business mobility demand.
Australia’s growth reflects the need for reliable mobile access across large service areas. Family plans and business mobility offers are expected to protect recurring accounts.
Why does South Korea lead the listed countries?
5.8% CAGR, driven by premium data use and faster network migration.
South Korea leads because advanced network use supports premium subscription behavior. The Private 5G Network Market becomes relevant when enterprise users need controlled cellular service at specific sites.
Who leads the Cellular Network Subscription Market?
China Mobile and China Telecom compete through large subscriber platforms. Reliance Jio and Bharti Airtel bring large mobile account bases. Verizon, AT&T and T-Mobile US emphasize premium postpaid and fixed wireless access. Deutsche Telekom, Vodafone and NTT DOCOMO add multi-market reach.
From 2026 to 2036, competition is expected to depend on tariff clarity and churn control. Account expansion is expected to depend on household bundles and enterprise service attachment.
Which companies are the key providers?
Key companies include China Mobile; Bharti Airtel; Verizon Communications; AT&T Inc.; China Telecom; Deutsche Telekom AG; Vodafone Group Plc; Reliance Jio Infocomm; T-Mobile US, Inc.; NTT DOCOMO, Inc.
- China Mobile
- Bharti Airtel
- Verizon Communications
- AT&T Inc.
- China Telecom
- Deutsche Telekom AG
- Vodafone Group Plc
- Reliance Jio Infocomm
- T-Mobile US, Inc.
- NTT DOCOMO, Inc.
Bibliography
- Office of Communications. (2025, May 8). Connected Nations update: Spring 2025.
- Telecom Regulatory Authority of India. (2025, June 19). The Indian Telecom Services Performance Indicators January – March, 2025.
- AT&T Inc. (2026, January 28). AT&T reports strong fourth-quarter and full-year 2025 financial performance.
- Verizon Communications Inc. (2026, January 30). Verizon delivers on 2025 financial guidance with highest quarterly net adds since 2019.
This Report Answers
- The report provides strategic intelligence on the Cellular Network Subscription Market across technology and subscription choices.
- Segment analysis covers 4G LTE and Postpaid plans as the share leaders within the 2026 market.
- Country outlook evaluates South Korea and the USA alongside the UK and Canada. Germany and Australia complete the view with Japan.
- Competitive analysis profiles China Mobile and Bharti Airtel alongside Verizon Communications and AT&T Inc. China Telecom and other named operators complete the provider set.
- Service assessment covers tariff design and fixed wireless access. Enterprise mobility and consumer retention complete the view.
What does the Cellular Network Subscription Market cover?
Cellular network subscription revenue covers recurring and prepaid access plans sold to consumers and organizations.
The Cellular Network Subscription Market covers 4G LTE and 5G plans. Consumer mobile and enterprise connectivity plans are included. Postpaid and prepaid subscriptions are included.
The market differs from device retail revenue because value comes from service payments. Connected-device lines are included when they are attached to a cellular account.
What is included in the scope?
Cellular network subscriptions are used by consumers and organizations that need recurring mobile access.
The scope includes Network Technology and Subscription Type alongside End User, Service Type and Connection Type. Smartphone plans are included with Android devices and iOS devices. IoT devices and wearables follow the same service-account rule.
What is excluded from the scope?
Downstream handset sales and unrelated connectivity revenue remain outside the scope of this market.
The scope excludes device-only retail sales and accessories. Fixed-only broadband is excluded unless it is sold through a cellular fixed wireless account. Satellite-only subscriptions are excluded when they do not attach to a cellular plan.
How Was the Analysis Built?
The analysis draws on 120+ sources, 35+ company portfolios, 25+ countries, and more than 20 industry interviews.
- Primary Research: Primary research includes discussions with manufacturers, service providers, technology developers, distributors, end users, procurement teams, and subject-matter experts. These conversations examine purchasing priorities, product adoption, operational challenges, approval requirements, competitive positioning, and the factors that influence wider market acceptance.
- Desk Research: Desk research covers government statistics, regulatory publications, company filings, trade data, technical studies, industry associations, standards, public policy, and other authoritative sources. Every source used in the analysis is documented in the bibliography.
- Market Sizing and Forecasting: Market estimates combine historical performance, demand indicators, pricing and volume trends, segment shares, company participation, country-level growth, adoption patterns, investment activity, and barriers to market expansion.
- Data Validation and Update Cycle: Findings are validated by comparing primary interviews with public data, company activity, regulatory changes, trade patterns, and industry developments. Regular updates review new product launches, capacity changes, partnerships, approvals, procurement trends, and shifts in commercial adoption.
Segmentation
What is the report’s scope and coverage?
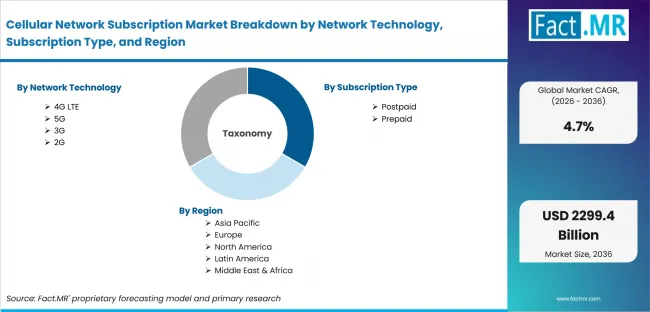
Cellular Network Subscription Market Breakdown By Network Technology, Subscription Type, And Region | Source: Fact.MR
| Attribute | Details |
|---|---|
| Quantitative Units | USD billion |
| Market Definition | Revenue from recurring and prepaid cellular network access plans across the defined segment categories. Device sale revenue and substitute connectivity revenue are excluded. |
| Network Technology | 4G LTE; 5G; Consumer Mobile; Enterprise Connectivity |
| Subscription Type | Postpaid; Individual Plans; Enterprise Plans; Prepaid |
| End User | Consumer; Individual Subscribers; Family Plans; Enterprise |
| Service Type | Voice & Data; Unlimited Plans; Bundled Services; Data-Only |
| Connection Type | Smartphones; Android Devices; iOS Devices; IoT Devices |
| Regions Covered | North America; Latin America; Western Europe; Eastern Europe; East Asia; South Asia and Pacific; Middle East and Africa |
| Countries Covered | USA; Japan; Germany; UK; Canada; Australia; South Korea |
| Key Companies Profiled | China Mobile; Bharti Airtel; Verizon Communications; AT&T Inc.; China Telecom; Deutsche Telekom AG; Vodafone Group Plc; Reliance Jio Infocomm; T-Mobile US, Inc.; NTT DOCOMO, Inc. |
| Forecast Period | 2026 to 2036 |
| Approach | Hybrid top-down and bottom-up approach using operator service revenue; subscription volumes; pricing trends; device connections; enterprise adoption; country patterns; and company portfolio review |
Source: Fact.MR analysis. Updated Aug 3, 2026
How is the market segmented?
-
By Network Technology:
- 4G LTE
- Consumer Mobile
- Enterprise Connectivity
- 5G
- Enhanced Mobile Broadband
- Fixed Wireless Access
- 3G
- Legacy Networks
- Rural Connectivity
- 2G
- M2M Connectivity
- Basic Voice Services
- 4G LTE
-
By Subscription Type:
- Postpaid
- Individual Plans
- Enterprise Plans
- Prepaid
- Consumer Prepaid
- Tourist SIM Plans
- Postpaid
-
By End User:
- Consumer
- Individual Subscribers
- Family Plans
- Enterprise
- Corporate Users
- Government Organizations
- Consumer
-
By Service Type:
- Voice & Data
- Unlimited Plans
- Bundled Services
- Data-Only
- Tablets
- Mobile Broadband
- IoT Connectivity
- M2M Connections
- Smart Devices
- Voice & Data
-
By Connection Type:
- Smartphones
- Android Devices
- iOS Devices
- IoT Devices
- Connected Vehicles
- Industrial IoT
- Tablets & Mobile Computing
- Tablets
- Laptops
- Others
- Wearables
- Feature Phones
- Smartphones
-
By Region:
- North America
- Latin America
- Western Europe
- Eastern Europe
- East Asia
- South Asia and Pacific
- Middle East and Africa
Frequently Asked Questions
Which Network Technology leads the market?
Which Subscription Type leads the market?
Which End User leads the market?
Which Service Type leads the market?
Which Connection Type leads the market?
Which country records the highest listed CAGR?
What is the primary driver in this market?
What is the main restraint?
Why do consumers lead demand?
Who worked on this report


Preview the report firsthand - request a free sample
Free SampleGet the brochure for pricing and purchase details
Download PDF