- Market Value (2025): USD 5.2 Bn
- Estimated Value (2026): USD 5.7 Bn
- Forecast Value (2036): USD 15.6 Bn
- CAGR (2026-2036): 10.6%
What is the Workload Scheduling Automation Market forecast to be worth by 2036?
USD 5.7 billion in 2026 to USD 15.6 billion by 2036 at 10.6% CAGR.
- The workload scheduling automation market crossed a valuation of USD 5.2 Billion in 2025 as enterprises continued replacing isolated scripts with governed scheduling platforms.
- Demand is projected to increase from USD 5.7 Billion in 2026 to USD 15.6 Billion by 2036.
- The market is forecast to record 10.6% CAGR from 2026 to 2036 owing to hybrid estates, job dependency risk and cloud-based operations.
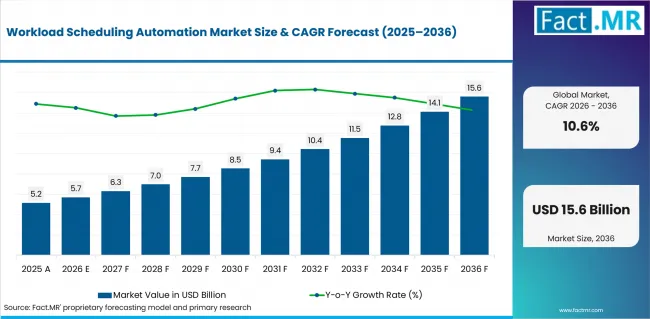
Workload Scheduling Automation Market Value Analysis | Source: Fact.MR
What are the defining numbers behind Workload Scheduling Automation Market growth?
USD 9.9 billion absolute opportunity by 2036.
- Demand Drivers in the Market
- Hybrid workload estates are expected to raise demand for one scheduling layer that controls jobs across mainframes, ERP systems, cloud platforms and file workflows.
- Operations teams need better dependency visibility because missed batch windows can affect reporting, billing, reconciliation and customer-facing services.
- Security teams are expected to favor scheduling tools that protect credentials, record audit trails and apply role-based controls across automated workflows.
- Migration programs are expected to support replacement demand where old scripts and product-specific queues no longer provide enough recovery evidence.
- Key Segments Analyzed
- By Product Type: Enterprise Workload Automation is projected to hold 34.0% share in 2026 because large customers need centralized dependency and policy control.
- By Application: IT Operations is projected to hold 31.0% share in 2026 as technical runbooks, batch jobs and recovery tasks remain the core use case.
- By End User: Large Enterprises are forecast to hold 42.0% share in 2026 due to higher job volume, platform diversity and dedicated operations budgets.
- Analyst Opinion at Fact.MR
- Shambhu Nath Jha, Principal Consultant at Fact.MR, states, “Workload scheduling automation vendors must prove reliability before customers move critical jobs from older schedulers and scripts. The strongest commercial case is expected to come from dependency mapping, secure credential handling and recovery evidence across hybrid environments.”
- Strategic Implications
- Infrastructure leaders should map job dependencies before migration plans influence vendor selection. Application metrics and monitoring tools support this review by showing where failed jobs affect service health and incident response.
- Software providers can improve account confidence by packaging connectors, policy templates and audit exports into the implementation plan. API marketplace activity reinforces the value of governed reusable integrations in enterprise software buying.
- Security reviewers should test credential handling and access controls before production cutover. Zero trust architecture priorities make identity-checked automation a purchase requirement rather than a late compliance review.
Germany is expected to record a 12.2% CAGR from 2026 to 2036. Brazil is projected to record an 11.1% CAGR. The USA is estimated to grow at 10.1%, while the UK is forecast at 9.0%. Japan is anticipated to reach 8.0%. Australia is projected at 9.6% and Canada at 9.3%.
How does the Workload Scheduling Automation Market break down by segment?
Enterprise Workload Automation is expected to lead Product Type at 34.0% share in 2026. IT Operations is projected to lead Application at 31.0% share in 2026.
Why does Enterprise Workload Automation lead Product Type?
Enterprise Workload Automation is projected to account for 34.0% share in 2026.
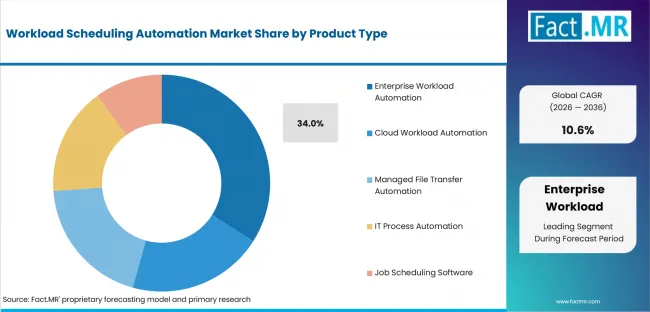
Workload Scheduling Automation Market Analysis By Product Type | Source: Fact.MR
Enterprise Workload Automation leads because large customers rarely schedule one application in isolation. They need a control layer that tracks predecessors, calendars, events, credentials, service deadlines and audit records across mixed systems. Consolidation is expected to reduce duplicate agents and hand-built scripts while improving recovery evidence.
Why does IT Operations lead Application?
IT Operations hold 31.0% share in 2026.
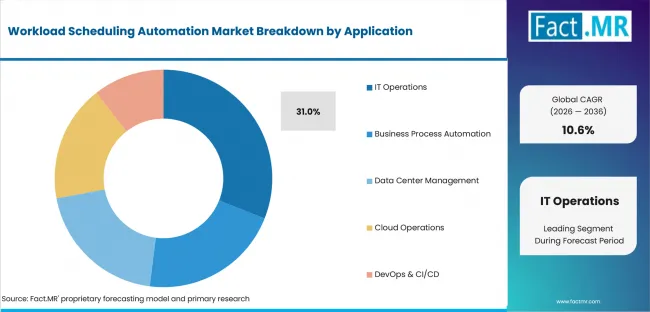
Workload Scheduling Automation Market Analysis By Application | Source: Fact.MR
IT Operations remains the largest application because recurring technical work has clear completion windows. Batch processing, database maintenance, backups, file arrivals and failure recovery all need scheduling discipline. IT infrastructure monitoring adds value when operators connect job status with system health.
Why do Large Enterprises lead End User?
Large Enterprises lead with 42.0% share in 2026.
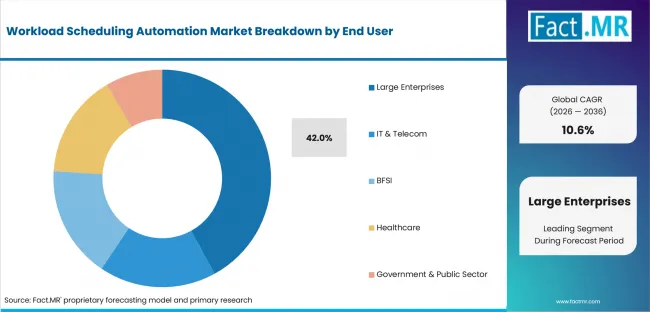
Workload Scheduling Automation Market Analysis By End User | Source: Fact.MR
Large Enterprises lead because job volume and business criticality make consolidation economic. Global organizations operate several data centers, public clouds, ERP instances, mainframes and file exchanges. Cloud managed services also influence demand where companies outsource operation but still need transparent scheduling evidence.
What is accelerating Workload Scheduling Automation Market adoption, and what is holding it back?
Demand is expected to rise through hybrid workload growth and secure orchestration. Growth may be limited by migration risk, integration complexity and production validation requirements.
Drivers Impact Analysis
| DRIVER | (~) % IMPACT ON CAGR | GEOGRAPHIC RELEVANCE | IMPACT TIMELINE |
|---|---|---|---|
| Hybrid workload growth | +2.8% | Germany, USA and Canada | Short term (<= 2 years) |
| Enterprise dependency control | +2.3% | Large enterprise clusters | Short term (<= 2 years) |
| Credential and audit governance | +1.9% | USA, UK and Japan | Medium term (2-4 years) |
| Cloud-based scheduler replacement | +1.6% | Brazil and Australia | Medium term (2-4 years) |
| Event-driven automation | +1.1% | Global enterprise accounts | Long term (>= 4 years) |
Source: Fact.MR analysis. Updated Aug 3, 2026
- Hybrid workload growth: Mixed infrastructure is expected to increase the value of one scheduling layer across mainframe, cloud and distributed jobs.
- Enterprise dependency control: Complex job chains are expected to place more weight on visual dependency mapping and recovery planning.
- Credential and audit governance: Security review is expected to favor tools that protect secrets and record each automated action clearly.
Opportunity Impact Analysis
| OPPORTUNITY | (~) % IMPACT ON CAGR | GEOGRAPHIC RELEVANCE | IMPACT TIMELINE |
|---|---|---|---|
| Policy-driven orchestration | +1.4% | USA and UK | Medium term (2-4 years) |
| AI and agent workflow scheduling | +1.2% | USA, Germany and Japan | Medium term (2-4 years) |
| Managed file and data pipeline control | +1.0% | Brazil and Canada | Long term (>= 4 years) |
| Self-service operations portals | +0.8% | Australia and large enterprises | Long term (>= 4 years) |
Source: Fact.MR analysis. Updated Aug 3, 2026
- Policy-driven orchestration: Customers are expected to value reusable governance templates that reduce manual approval work during workflow change.
- AI and agent workflow scheduling: Agentic orchestration is expected to create new scheduling needs where AI tasks must run inside governed enterprise workflows.
- Managed file and data pipeline control: Data movement and recurring pipeline work are expected to strengthen demand for scheduling tools with transfer visibility.
Restraints Impact Analysis
| RESTRAINT | (~) % IMPACT ON CAGR | GEOGRAPHIC RELEVANCE | IMPACT TIMELINE |
|---|---|---|---|
| Migration risk | -1.4% | USA and Japan | Short term (<= 2 years) |
| Legacy dependency discovery | -1.0% | Germany and Canada | Short term (<= 2 years) |
| Integration and connector gaps | -0.8% | Global enterprise accounts | Medium term (2-4 years) |
| Subscription cost scrutiny | -0.6% | Brazil, UK and Australia | Long term (>= 4 years) |
Source: Fact.MR analysis. Updated Aug 3, 2026
- Migration risk: Customers must prove that existing business services still finish correctly after scheduler replacement.
- Legacy dependency discovery: Older scripts and undocumented calendars are expected to slow project planning before production cutover.
- Integration and connector gaps: Missing connectors can raise implementation effort when enterprise applications use customized operating paths.
Which countries are scaling Workload Scheduling Automation Market fastest?
- Germany leads through complex enterprise environments that require scheduler continuity across SAP, mainframes, distributed servers and cloud services. Brazil follows as regulated buyers prioritize secure modernization and contract continuity.
- The USA grows through large hybrid estates and integration-heavy workflows. Australia and Canada advance through cloud programs, public-sector hosting and reduced manual operations.
- The UK benefits from resilience-led modernization and service-performance goals. Japan expands more steadily as customers favor staged migration and detailed technical validation for mission-critical workloads.
The full report provides country-level CAGR analysis across North America, Latin America, Europe, East Asia, South Asia and Pacific, Oceania, and the Middle East and Africa.
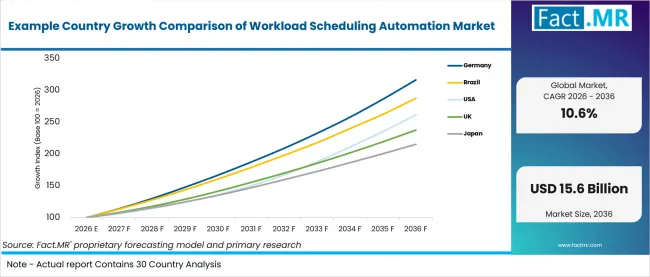
Example Country Growth Comparison Of Workload Scheduling Automation Market | Source: Fact.MR
| COUNTRY | CAGR, 2026 to 2036 |
|---|---|
| Germany | 12.2% |
| Brazil | 11.1% |
| USA | 10.1% |
| UK | 9.0% |
| Japan | 8.0% |
| Australia | 9.6% |
| Canada | 9.3% |
Source: Fact.MR analysis. Updated Aug 3, 2026
What supports Germany adoption?
12.2% CAGR, supported by industrial software estates and controlled cloud migration.
Germany’s growth reflects customers that need one scheduler across SAP, mainframe, distributed and cloud environments. Vendors are expected to win accounts by proving safe migration and strong legacy support.
How is Brazil scaling demand?
11.1% CAGR, driven by public procurement discipline and regulated software modernization.
Brazil’s growth is tied to customers that value contract structure, privacy, continuity and cost evidence. Scheduler replacement is expected to move forward when vendors show clear governance and local support.
What is driving USA growth from 2026 to 2036?
10.1% CAGR, backed by hybrid estates and security review requirements.
The USA’s growth reflects large enterprise estates with data pipelines, regulated operations and high-volume application workflows. Customers are expected to compare automation depth, credential controls and integration coverage before approval. Data center monitoring adds value when scheduling failures must be connected with service reliability evidence.
How does the UK perform?
9.0% CAGR, led by cloud modernization and public-service resilience.
UK growth reflects customers that connect scheduler replacement with service performance and commercial value. Vendors are expected to gain traction when they show migration evidence and support phased replacement.
How is Japan developing demand?
8.0% CAGR, shaped by controlled modernization and detailed technical conformance.
Japan’s growth reflects customers that prefer carefully sequenced production change. Scheduler vendors must show localized support, exact documentation and stable release behavior before wider adoption.
What supports Australia growth?
9.6% CAGR, supported by enterprise cloud programs and managed operations.
Australia’s growth is expected to come from customers that need workload visibility across cloud services and internal IT operations. Mobile application estates add recurring jobs around updates, notifications and back-end services. Scheduling platforms are expected to gain demand when they lower manual handoffs across distributed teams.
What supports Canada growth?
9.3% CAGR, backed by hybrid service delivery and public-sector application hosting.
Canada’s growth reflects public and enterprise customers coordinating hosting choices, legacy applications and service continuity. Providers with strong documentation and support are likely to gain confidence.
Who leads the Workload Scheduling Automation Market?
Competition is organized around hybrid control, integration depth and operational credibility.
BMC Software, Broadcom, IBM and HCL Technologies compete through broad enterprise orchestration. Stonebranch, and Redwood Software emphasize event-driven and cloud-oriented automation.
From 2026 to 2036, competition is expected to depend on migration safety, connector breadth, credential governance and recovery evidence. Providers that connect scheduling outputs with observability and incident response are expected to strengthen renewal confidence.
Which companies are the key providers?
Technologies; and HCL Technologies.
- BMC Software
- Broadcom
- IBM
- Stonebranch
- Fortra
- Redwood Software
- SMA Technologies
- HCL Technologies
Bibliography
- Eurostat. (2025, January 23). Usage of AI technologies increasing in EU enterprises.
- U.S. Government Accountability Office. (2025, March 24). Cloud computing: Private sector leading practices in acquisition, cybersecurity, and workforce development (GAO-25-106369).
- BMC Software, Inc. (2026, March 18). BMC advances trusted AI orchestration with new Control-M capabilities.
- Redwood Software. (2025, May 9). Redwood Software now an SAP endorsed app available on SAP Store.
This Report Answers
- The report provides strategic intelligence on the Workload Scheduling Automation Market across Product Type and Application choices that shape enterprise scheduling programs.
- Segment analysis covers Enterprise Workload Automation and IT Operations as the share leaders within the 2026 market.
- Country outlook evaluates Germany and Brazil alongside the USA, UK and Japan. Australia and Canada complete the growth comparison across the profiled markets.
- Competitive analysis profiles BMC Software and Broadcom alongside IBM and Stonebranch. Fortra, Redwood Software, SMA Technologies, HCL Technologies and ActiveBatch complete the company view.
- Deployment assessment covers Cloud-Based and On-Premises approaches. Public Cloud and Hybrid Cloud complete the deployment view alongside direct and channel-led sales routes.
What does the Workload Scheduling Automation Market cover?
Workload scheduling automation platforms are used to schedule and govern unattended enterprise jobs where timing, dependencies and recovery evidence decide service reliability.
The Workload Scheduling Automation Market covers software and services used for enterprise, mainframe, distributed and cloud workload automation. Coverage extends to IT operations, batch processing, system administration and business process automation.
What is included in the scope?
Workload scheduling automation is used across large enterprises, global enterprises, multinational corporations and IT and telecom customers. Direct and channel-led sales routes are included where revenue belongs to scheduling automation platforms.
The scope includes Product Type and Application alongside End User, Distribution Channel and Deployment. Implementation services are included only when tied to scheduling automation inside the defined revenue boundary.
What is excluded from the scope?
Underlying cloud infrastructure and unrelated automation software remain outside the scope of this market.
The scope excludes compute consumption, storage, networking, downstream application revenue and general IT consulting not sold as workload scheduling automation. Basic calendar scheduling and task-list tools are also excluded.
How Was the Analysis Built?
The analysis draws on 120+ sources, 35+ company portfolios, 25+ countries, and more than 20 industry interviews.
- Primary Research: Primary research includes discussions with software providers, integration partners, managed service companies, enterprise operations teams, procurement teams and subject-matter experts.
- Desk Research: Desk research covers government publications, company announcements, product documentation, technical notes, release records, standards references and other authoritative sources.
- Market Sizing and Forecasting: Market estimates combine vendor revenue within scope, subscription economics, segment shares, country growth, deployment patterns, adoption signals and market barriers.
- Data Validation and Update Cycle: Findings are validated by comparing interviews with public information, company activity, product releases, customer adoption and country-level operating conditions.
Segmentation
What is the report’s scope and coverage?
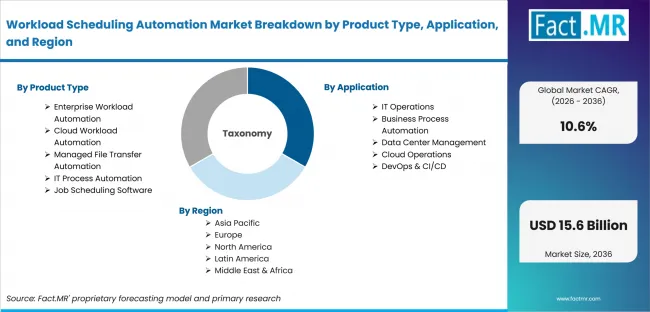
Workload Scheduling Automation Market Breakdown By Product Type, Application, And Region | Source: Fact.MR
| Attribute | Details |
|---|---|
| Quantitative Units | USD billion |
| Market Definition | Revenue from software licenses, subscriptions, SaaS fees, maintenance, support and market-specific implementation services for platforms that schedule, trigger, monitor, govern and orchestrate unattended jobs and workflows within the stated segmentation universe. |
| Regions Covered | North America, Latin America, Western Europe, Eastern Europe, East Asia, South Asia and Pacific, Oceania, and Middle East and Africa |
| Countries Covered | Germany, Brazil, USA, UK, Japan, Australia, Canada, and more than twenty-five additional countries in the full report |
| Forecast Period | 2026 to 2036 |
| Approach | Hybrid bottom-up and top-down sizing that reconciles vendor revenue, deployment economics, customer adoption and segment-level demand within the defined revenue boundary. |
Source: Fact.MR analysis. Updated Aug 3, 2026
How is the market segmented?
-
By Product Type:
- Enterprise Workload Automation
- Mainframe Workload Automation
- Distributed Workload Automation
- Cloud Workload Automation
- Public Cloud Scheduling
- Hybrid Cloud Scheduling
- Managed File Transfer Automation
- Secure File Transfer
- Batch File Automation
- IT Process Automation
- Infrastructure Automation
- Application Automation
- Job Scheduling Software
- Event-Driven Scheduling
- Time-Based Scheduling
- Enterprise Workload Automation
-
By Application:
- IT Operations
- Batch Processing
- System Administration
- Business Process Automation
- Financial Operations
- HR Operations
- Data Center Management
- Server Scheduling
- Resource Optimization
- Cloud Operations
- Multi-Cloud Orchestration
- Container Workloads
- DevOps & CI/CD
- Build Automation
- Release Automation
- IT Operations
-
By End User:
- Large Enterprises
- Global Enterprises
- Multinational Corporations
- IT & Telecom
- Cloud Service Providers
- Telecommunication Companies
- BFSI
- Banks
- Insurance Companies
- Healthcare
- Hospitals
- Pharmaceutical Companies
- Government & Public Sector
- Central Government
- Local Government
- Large Enterprises
-
By Distribution Channel:
- Direct Sales
- Enterprise Sales Team
- Key Account Management
- Channel Partners
- Value Added Resellers
- System Integrators
- Cloud Marketplace
- Public Cloud Marketplace
- Private Marketplace
- Managed Service Providers
- IT Service Providers
- Cloud Managed Service Providers
- Online Sales
- Vendor Website
- Digital Software Marketplace
- Direct Sales
-
By Deployment:
- Cloud-Based
- Public Cloud
- Hybrid Cloud
- On-Premises
- Dedicated Infrastructure
- Private Data Centers
- Hybrid Deployment
- Cloud Integrated
- On-Premises Integrated
- Multi-Cloud Deployment
- Cross-Cloud Management
- Cloud Orchestration
- Edge Deployment
- Edge Computing
- Remote Infrastructure
- Cloud-Based
-
By Region:
- North America
- Latin America
- Western Europe
- Eastern Europe
- East Asia
- South Asia and Pacific
- Oceania
- Middle East and Africa
Frequently Asked Questions
Which Product Type leads the market?
Which Application leads the market?
Which End User leads the market?
Which country records the highest listed CAGR?
What is the primary driver in this market?
What is the main restraint?
Why do Large Enterprises lead demand?
Who worked on this report


Preview the report firsthand - request a free sample
Free SampleGet the brochure for pricing and purchase details
Download PDF