- Market Value (2025): USD 469.4 Mn
- Estimated Value (2026): USD 552.0 Mn
- Forecast Value (2036): USD 2780.0 Mn
- CAGR (2026-2036): 17.6%
What is the Digital Clinical Nutrition Platforms Market forecast to be worth by 2036?
USD 552.0 million in 2026 to USD 2,780.0 million by 2036 at 17.6% CAGR.
- The digital clinical nutrition platforms market surpassed a value of USD 469.4 million in 2025.
- Demand is projected to rise from USD 552.0 million in 2026 to USD 2,780.0 million by 2036.
- The market is forecast to record 17.6% CAGR from 2026 to 2036 through stronger payer review and care documentation.
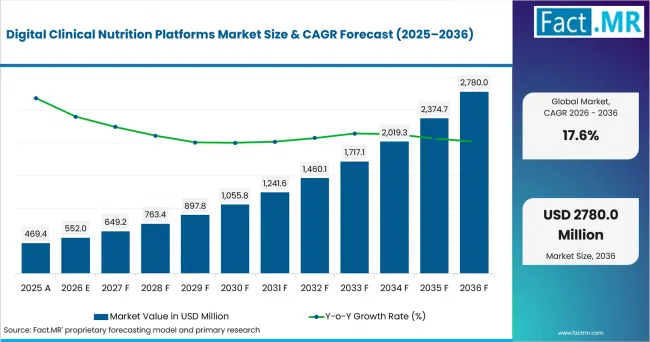
Digital Clinical Nutrition Platforms Market Value Analysis | Source: Fact.MR
What are the defining numbers behind Digital Clinical Nutrition Platforms Market growth?
USD 2,228.0 million absolute opportunity by 2036 is led by Medical nutrition therapy and Diabetes & metabolic pathways alongside Insurance-covered MNT and Health plans.
- Demand Drivers in the Market
- Chronic-disease care pathways are expected to create recurring nutrition needs since diabetes care and renal care require repeat counseling alongside oncology and gastrointestinal care.
- Virtual dietetics is expected to reduce missed visits and helps dietitians document care between appointments through telemedicine services and shared care plans.
- Food-as-medicine programs are expected to move the use case beyond counseling into produce prescription coordination and medically tailored meal support.
- Health plans are expected to prefer workflows that close referrals and show when licensed professionals remain responsible for care.
- Key Segments Analyzed
- By Service Type: Medical nutrition therapy is expected to hold 42.6% share in 2026 as clinical pathways and reimbursement rules give it the clearest care role.
- By Clinical Indication: Diabetes & metabolic is projected to account for 34.9% share in 2026 since metabolic care requires repeat counseling and measurable outcomes.
- By Reimbursement: Insurance-covered MNT is anticipated to capture 27.8% share in 2026 as coverage lowers direct patient cost and supports referral-based use.
- By End User: Health plans are estimated to represent 55.2% share in 2026 due to their role in population contracts and claims-aware care management.
- Analyst Opinion at Fact.MR
- Shambhu Nath Jha, Senior Analyst at Fact.MR, states, “Digital clinical nutrition platforms are expected to prove strongest when they connect dietitian care with referral records, food support and payer evidence. Health plans are expected to value platforms that show licensed oversight and measurable follow-up instead of engagement volume alone.”
- Strategic Implications
- Health plans benefit from contracts that define the service boundary before scale-up. A program connected with food-as-medicine prescription services needs to show when counseling and benefit navigation move into meal fulfillment.
- Platform companies need to show how dietitian notes move into payer and provider systems. This proof is useful when healthcare transformation budgets require auditable nutrition records.
- Care teams benefit from specialty modules that match clinical risk. A renal or oncology pathway needs different screening and meal guidance than a general wellness program.
The USA is expected to record a 17.1% CAGR from 2026 to 2036 through employer and health-plan purchasing. Germany is projected to record a 16.7% CAGR as evidence review and digital-health procurement shape platform entry. The UK is anticipated to grow at 16.4% through defined clinical pathways and NHS digital access. Australia is estimated to post a 16.1% CAGR because remote-care need strengthens the access case. The Netherlands is forecast at 15.6% through primary-care coordination and dietitian referral pathways.
How does the Digital Clinical Nutrition Platforms Market break down by segment?
Medical nutrition therapy is expected to lead Service Type at 42.6% share in 2026. Diabetes & metabolic is projected to lead Clinical Indication at 34.9% share in 2026.
Which service type dominates?
Medical nutrition therapy is projected to account for 42.6% share in 2026.
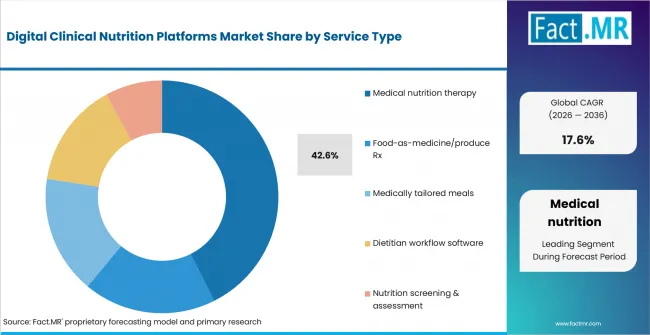
Digital Clinical Nutrition Platforms Market Analysis By Service Type | Source: Fact.MR
MNT has the clearest clinical anchor because it is tied to dietitian-led care and reimbursement documentation. Its role is closest to reimbursable oral clinical nutrition pathways where follow-up is reviewed. Food-as-medicine/produce Rx and medically tailored meals remain part of the service mix. Dietitian workflow software and nutrition screening support care documentation around those services.
What leads the Clinical Indication segment?
Diabetes & metabolic is expected to hold 34.9% share in 2026.
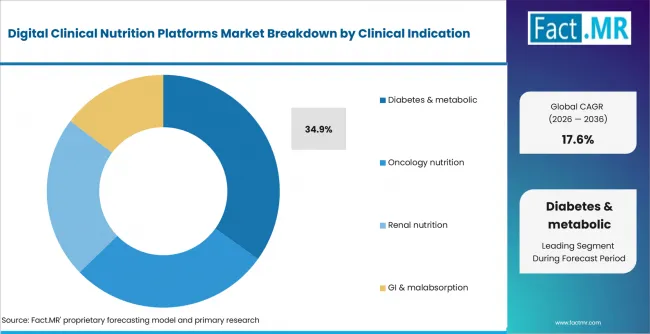
Digital Clinical Nutrition Platforms Market Analysis By Clinical Indication | Source: Fact.MR
Diabetes and metabolic care generate repeat nutrition decisions with measurable outcomes. Oncology nutrition and renal nutrition remain useful where treatment side effects change food tolerance. GI & malabsorption pathways are included because diet needs often change through diagnosis and follow-up. The segment lead reflects repeat use and clearer measurement.
How does Reimbursement shape demand?
Insurance-covered MNT is anticipated to lead with 27.8% share in 2026.
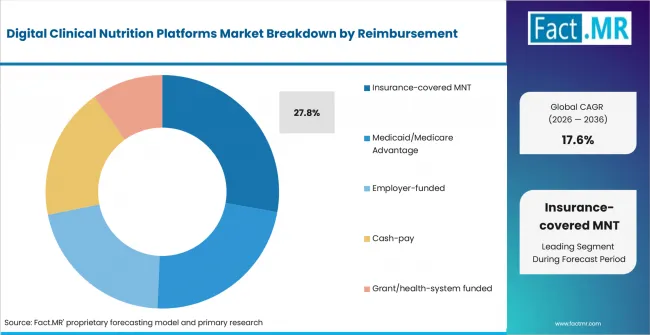
Digital Clinical Nutrition Platforms Market Analysis By Reimbursement | Source: Fact.MR
Coverage lowers direct patient cost and gives providers a clearer route to referral-based delivery. Medicaid/Medicare Advantage and employer-funded routes keep the reimbursement mix broad. Cash-pay and grant-funded routes remain relevant where coverage is narrow. Platforms that document eligibility and visits are expected to fit this segment best.
What supports Health plans within End User?
Health plans are estimated to represent 55.2% share in 2026.
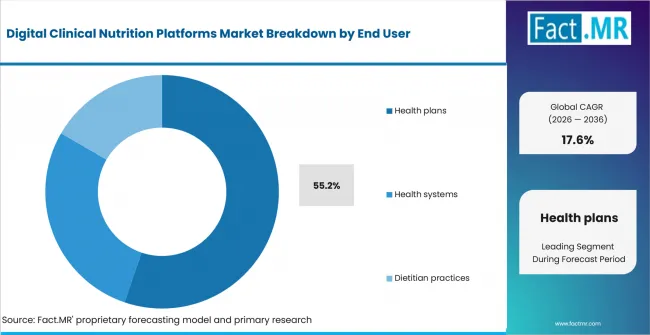
Digital Clinical Nutrition Platforms Market Analysis By End User | Source: Fact.MR
Health plans hold the largest position since they contract across covered populations and compare nutrition support with claims review. Health systems and dietitian practices remain important where care delivery begins closer to the patient. Connections with home healthcare become useful when nutrition support is delivered beyond facility settings.
What is accelerating Digital Clinical Nutrition Platforms Market adoption, and what is holding it back?
Demand is expected to be driven by chronic-care nutrition needs and virtual dietetics. Adoption is expected to be held back by narrow coverage rules and integration work inside clinical systems.
Drivers Impact Analysis
| DRIVER | (~) % IMPACT ON CAGR | GEOGRAPHIC RELEVANCE | IMPACT TIMELINE |
|---|---|---|---|
| Chronic-disease nutrition need | +4.4% | Global | Short term (<= 2 years) |
| Expansion of virtual dietetics | +3.8% | USA, UK, Australia | Short term (<= 2 years) |
| Food-as-medicine benefit integration | +2.7% | USA and enterprise markets | Medium term (2-4 years) |
| Reimbursement documentation | +2.1% | USA, Germany, Netherlands | Medium term (2-4 years) |
| Outcomes reporting | +1.4% | Payer-funded markets | Long term (>= 4 years) |
Source: Fact.MR analysis. Updated Jul 25, 2026
- Chronic-disease nutrition need: Repeat counseling is expected to raise platform value when care plans need dietitian follow-up after each referral. Diabetes, renal disease, oncology, and gastrointestinal conditions create recurring nutrition decisions that require documented adjustments rather than one-time dietary advice.
- Expansion of virtual dietetics: Video and messaging workflows are expected to help nutrition care fit inside telehealth therapy services. Remote consultations can improve access for patients who face travel barriers while allowing dietitians to review progress, update meal guidance, and record follow-up between appointments.
- Food-as-medicine benefit integration: Platforms that coordinate counseling and produce benefits are expected to gain more value in payer-funded programs. Integration with produce prescriptions and medically tailored meals allows health plans to connect clinical advice with practical food support for eligible members.
- Reimbursement documentation: Covered MNT requires eligibility checks and visit records. This turns documentation into a purchase condition for health plans. Platforms that record diagnosis, referral status, clinician credentials, visit completion, and treatment progress are expected to fit reimbursement workflows more effectively.
Opportunity Impact Analysis
| OPPORTUNITY | (~) % IMPACT ON CAGR | GEOGRAPHIC RELEVANCE | IMPACT TIMELINE |
|---|---|---|---|
| Integrated food benefits | +1.8% | USA and health-plan markets | Short term (<= 2 years) |
| Dietitian workflow tools | +1.4% | USA, Germany, UK | Medium term (2-4 years) |
| Specialty nutrition pathways | +1.1% | Global | Medium term (2-4 years) |
| Payer referral closure | +0.9% | Enterprise markets | Long term (>= 4 years) |
Source: Fact.MR analysis. Updated Jul 25, 2026
- Integrated food benefits: Platforms are expected to connect assessment with counseling and fulfillment so eligible patients receive support beyond advice. Benefit coordination can help users access produce credits, meal deliveries, grocery support, or condition-specific food programs through one care pathway.
- Dietitian workflow tools: Scheduling and outcome capture are expected to raise care capacity without separating nutrition notes from the care plan. Automated intake, appointment management, patient messaging, progress tracking, and report generation can reduce administrative work for dietitian practices and health systems.
- Specialty nutrition pathways: Renal and oncology modules are expected to address needs that general wellness apps do not cover. Condition-specific tools can support nutrient restrictions, treatment-related appetite changes, malabsorption risks, and other clinical requirements that need closer professional supervision.
- Payer referral closure: Health plans are expected to value tools that show whether a referred member completed counseling and received follow-up. Platforms can strengthen this process by tracking referral acceptance, appointment completion, missed visits, care-plan updates, and the need for further intervention.
Restraints Impact Analysis
| RESTRAINT | (~) % IMPACT ON CAGR | GEOGRAPHIC RELEVANCE | IMPACT TIMELINE |
|---|---|---|---|
| Narrow coverage rules | -1.6% | Global | Short term (<= 2 years) |
| Food access beyond counseling | -1.2% | Payer-funded markets | Short term (<= 2 years) |
| Clinical integration burden | -0.9% | Global | Medium term (2-4 years) |
| Credentialing and licensing variation | -0.7% | USA and regulated markets | Long term (>= 4 years) |
Source: Fact.MR analysis. Updated Jul 25, 2026
- Narrow coverage rules: Benefits are often limited by diagnosis and visit count. This is expected to slow rollout even when nutrition need is clear. Patients may lose access when they do not meet eligibility criteria or when covered counseling sessions end before long-term behavior change is established.
- Food access beyond counseling: Education alone does not solve price or transport barriers. Programs need a route to food support. Adoption may remain limited when patients understand dietary recommendations but cannot afford suitable products, reach participating stores, or receive reliable meal delivery.
- Clinical integration burden: Dietitians need medication and care-plan context without duplicate entry across electronic health records and platform tools. Weak interoperability can increase administrative work, delay referrals, fragment patient records, and make outcome reporting more difficult for providers and payers.
- Credentialing and licensing variation: Platform expansion is expected to require checks on who is allowed to deliver reimbursable nutrition care. Different state and national requirements can complicate clinician onboarding, cross-border consultations, payer contracting, and the delivery of standardized services across multiple markets.
Which countries are scaling Digital Clinical Nutrition Platforms Market fastest?
The country comparison is defined more by reimbursement pathways and service localization than by the small spread between listed CAGRs. The total spread between the USA and Netherlands is only 1.50 percentage points. The USA forms the upper point. Germany and the UK remain close behind through formal digital-health and payer pathways. Australia is separate because geography strengthens the remote-care case. The Netherlands records the lowest listed CAGR, but coordinated primary care keeps a clear referral route for dietitian-led platforms.
- The USA shows a leading position because employer and health-plan purchasing is expected to move covered MNT into larger digital contracts.
- Germany remains close to the USA but follows a different path through evidence review and formal care integration.
- The UK gains from NHS digital access and evidence expectations that favor services built around defined care pathways.
- Australia has a practical access case because remote nutrition counseling reduces travel pressure for dispersed populations.
- The Netherlands records the smallest listed CAGR, yet primary-care coordination gives platforms a clear referral and follow-up route.
Comparable CAGRs therefore create different market entry conditions across these countries. Deployment timing depends on coverage design and local clinical rules. Smooth movement of dietitian records into payer review shapes rollout speed.
The full report provides country-level CAGR analysis across North America, Latin America, Europe, East Asia, South Asia, Oceania and the Middle East and Africa.
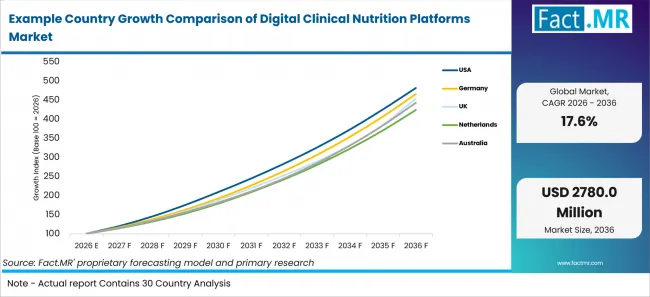
Example Country Growth Comparison Of Digital Clinical Nutrition Platforms Market | Source: Fact.MR
| Country | CAGR (2026-2036) |
|---|---|
| USA | 17.1% |
| Germany | 16.7% |
| UK | 16.4% |
| Australia | 16.1% |
| Netherlands | 15.6% |
Source: Fact.MR analysis. Updated Jul 25, 2026
What supports USA adoption?
17.1% CAGR, supported by employer and health-plan purchasing.
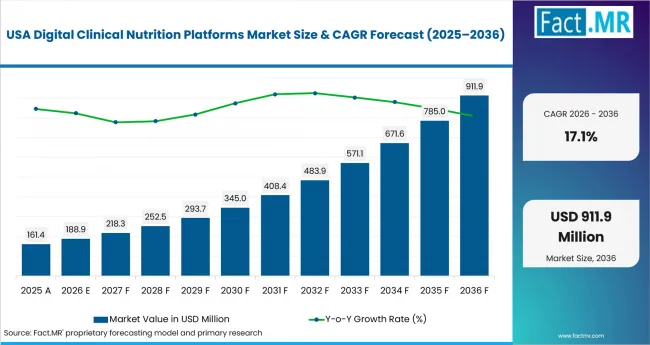
Digital Clinical Nutrition Platforms Market Country Value Analysis | Source: Fact.MR
The USA's growth reflects a market where covered MNT and food-benefit navigation are purchased through large health-plan contracts. Platforms are expected to compete on referral closure and licensed professional coverage. Adoption depends on proof that nutrition care fits claims review without adding manual work for providers.
How is Germany scaling demand?
16.7% CAGR, driven by evidence review and disciplined digital-health procurement.
Germany's growth is tied to formal evaluation and information-security expectations. Platform companies need to show that nutrition pathways are clinically defined and safe for sensitive patient information. Procurement is expected to move steadily where evidence and professional responsibility are clear before wider rollout.
What is driving UK growth from 2026 to 2036?
16.4% CAGR, backed by NHS digital access and pathway-based care.
UK demand is expected to favor services that fit defined clinical pathways and maintain access for patients who need non-digital support. NHS-style evaluation places weight on care outcomes and patient safety. Platforms that document dietitian oversight are expected to have stronger acceptance than tools built only for engagement.
How is Australia developing demand?
16.1% CAGR, supported by remote-care need and professional oversight.
Australia's growth is shaped by geography and the need to reach patients outside major cities. Virtual nutrition counseling is expected to help providers deliver follow-up without long travel gaps. Health systems and insurers are likely to compare platforms by clinical governance and dietitian access.
How does the Netherlands perform?
15.6% CAGR, led by primary-care coordination and dietitian referral pathways.
The Netherlands records the lowest listed CAGR among the profiled countries. Its coordinated primary-care base still gives clinical nutrition referrals a clear route. Platforms are expected to fit best when they support existing care relationships and simple follow-up records.
Who leads the Digital Clinical Nutrition Platforms Market?
Season Health, Nourish, and Foodsmart show the strongest relevance, while Culina Health, Fay Nutrition, broaden the competitive landscape.
Season Health supports clinically guided nutrition programs that connect dietitian care with food assistance and payer requirements. Nourish and Foodsmart strengthen the market through virtual consultations, insurance-supported nutrition services, and food-benefit navigation. Culina Health and Fay Nutrition expand access to digital dietitian care.
From 2026 to 2036, competition is expected to depend on reimbursement readiness, referral completion, licensed dietitian availability, and the quality of clinical documentation. Health plans and health systems are likely to compare providers by their ability to integrate nutrition records, track patient progress, coordinate food benefits, and support condition-specific care. Providers that demonstrate measurable outcomes while reducing administrative work may gain stronger demand across payer-funded and clinical nutrition programs.
Which companies are the key providers?
Key companies include Season Health, Nourish, Foodsmart, Culina Health, Fay Nutrition.
- Season Health
- Nourish
- Foodsmart
- Culina Health
- Fay Nutrition
Bibliography
- Australian Institute of Health and Welfare. (2026, May 27). Diabetes: Australian facts-Primary health care. Australian Government.
- Centers for Disease Control and Prevention. (2026, January 21). National Diabetes Statistics Report.
- Centers for Medicare & Medicaid Services. (2026, April 16). Preventive services coverage.
- Federal Statistical Office of Germany. (2026, June 2). The average person in Germany is 1.73 meters tall and weighs 78.3 kilograms.
- World Health Organization Regional Office for Europe. (2025, July 18). Nutrition for a healthy life—WHO recommendations.
This Report Answers
- The report provides strategic intelligence on the Digital Clinical Nutrition Platforms Market across Service Type and Clinical Indication choices that shape clinical nutrition delivery.
- Segment analysis covers Medical nutrition therapy and Diabetes & metabolic care as the leading 2026 categories within the market.
- Country outlook evaluates the USA and Germany alongside the UK and Australia. The Netherlands completes the growth comparison across the profiled markets.
- Competitive analysis profiles Season Health and Nourish alongside Foodsmart and Culina Health. Fay Nutrition completes the provider set.
- Workflow assessment covers Insurance-covered MNT and Health plans. The section connects nutrition care with mHealth services when patient follow-up moves through mobile tools.
What does the Digital Clinical Nutrition Platforms Market cover?
Digital clinical nutrition platforms deliver or enable clinical nutrition care where dietitian oversight and care documentation are part of a defined health pathway.
The Digital Clinical Nutrition Platforms Market covers medical nutrition therapy, food-as-medicine/produce Rx, medically tailored meals, dietitian workflow software, and nutrition screening. Coverage extends to diabetes and metabolic care alongside oncology, renal and gastrointestinal nutrition. The market includes reimbursed and employer-funded routes where nutrition care connects with clinical review.
The market differs from general wellness apps because commercial value comes from clinical oversight and documented care. Recipe browsing and general calorie tracking remain outside the boundary. Consumer-only meal delivery is excluded unless it supports a clinical nutrition pathway or food-as-medicine program.
What is included in the scope?
Digital clinical nutrition platforms are used by health plans, health systems and dietitian practices that manage nutrition care for defined patient groups.
The scope includes Service Type and Clinical Indication alongside Reimbursement and End User. Coverage spans MNT and produce prescriptions along with medically tailored meals and workflow tools. It includes diabetes and metabolic care plus oncology nutrition, renal nutrition and GI or malabsorption pathways. Health plans, health systems, and dietitian practices follow the same clinical-use rule.
What is excluded from the scope?
General food apps and consumer wellness tools remain outside the scope of this market.
The scope excludes apps that only track calories or sell meal plans without clinical oversight. General grocery delivery and consumer meal kits are excluded unless they are part of a clinically directed nutrition program. Broader digital therapeutics remain adjacent when software treatment claims fall outside nutrition documentation. Company activity without a clear connection to dietitian-led care or food-as-medicine delivery is excluded.
How Was the Analysis Built?
The analysis draws on 120+ sources, 35+ company portfolios, 25+ countries, and more than 20 industry interviews.
- Primary Research: Primary research includes discussions with manufacturers, service providers, technology developers, distributors, end users, procurement teams, and subject-matter experts. These conversations examine purchasing priorities, product adoption, operational challenges, approval requirements, competitive positioning, and the factors that influence wider market acceptance.
- Desk Research: Desk research covers government statistics, regulatory publications, company filings, trade data, technical studies, industry associations, standards, public policy, and other authoritative sources. Every source used in the analysis is documented in the bibliography.
- Market Sizing and Forecasting: Market estimates combine historical performance, demand indicators, pricing and volume trends, segment shares, company participation, country-level growth, adoption patterns, investment activity, and barriers to market expansion.
- Data Validation and Update Cycle: Findings are validated by comparing primary interviews with public data, company activity, regulatory changes, trade patterns, and industry developments. Regular updates review new product launches, capacity changes, partnerships, approvals, procurement trends, and shifts in commercial adoption.
Segmentation
What is the report's scope and coverage?
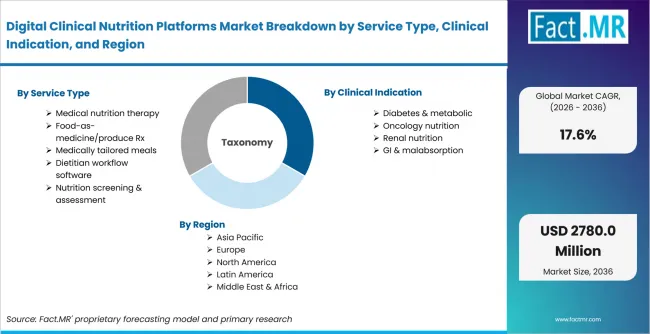
Digital Clinical Nutrition Platforms Market Breakdown By Service Type, Clinical Indication, And Region | Source: Fact.MR
| Attribute | Details |
|---|---|
| Quantitative Units | USD million in 2026 to USD million by 2036 at CAGR |
| Market Definition | Digital services that deliver or enable clinical nutrition care. Coverage includes medical nutrition therapy, food-as-medicine programs, medically tailored meals, dietitian workflow software, and nutrition screening. The scope focuses on clinically directed care instead of general recipe or calorie-tracking applications. |
| Service Type | Medical nutrition therapy, Food-as-medicine/produce Rx, Medically tailored meals, Dietitian workflow software, Nutrition screening & assessment |
| Clinical Indication | Diabetes & metabolic, Oncology nutrition, Renal nutrition, GI & malabsorption |
| Reimbursement | Insurance-covered MNT, Medicaid/Medicare Advantage, Employer-funded, Cash-pay, Grant/health-system funded |
| End User | Health plans, Health systems, Dietitian practices |
| Regions Covered | North America, Latin America, Europe, East Asia, South Asia and Pacific, Oceania, Middle East and Africa |
| Countries Covered | USA, Germany, UK, Australia, Netherlands |
| Key Companies Profiled | Season Health, Nourish, Foodsmart, Culina Health, Fay Nutrition |
| Forecast Period | 2026 to 2036 |
| Approach | Hybrid top-down and bottom-up approach using the approved market series, service-type demand, clinical indication mix, reimbursement pathways, health-plan purchasing, virtual dietetics adoption, food-benefit integration, country adoption patterns, and company portfolio review |
Source: Fact.MR analysis. Updated Jul 25, 2026
How is the market segmented?
-
By Service Type:
- Medical nutrition therapy
- Food-as-medicine/produce Rx
- Medically tailored meals
- Dietitian workflow software
- Nutrition screening & assessment
-
By Clinical Indication:
- Diabetes & metabolic
- Oncology nutrition
- Renal nutrition
- GI & malabsorption
-
By Reimbursement:
- Insurance-covered MNT
- Medicaid/Medicare Advantage
- Employer-funded
- Cash-pay
- Grant/health-system funded
-
By End User:
- Health plans
- Health systems
- Dietitian practices
-
By Region:
- North America
- Europe
- UK
Frequently Asked Questions
Which Service Type leads the market?
Which Clinical Indication leads the market?
Diabetes & metabolic is projected to lead clinical indication with 34.9% share in 2026.
Which Reimbursement category leads the market?
Which End User leads the market?
Which country records the highest listed CAGR?
What is the primary driver in this market?
What is the main restraint?
Why do health plans lead demand?
Who worked on this report


Preview the report firsthand - request a free sample
Free SampleGet the brochure for pricing and purchase details
Download PDF