- Market Value (2025): USD 8.7 Bn
- Estimated Value (2026): USD 9.6 Bn
- Forecast Value (2036): USD 25.8 Bn
- CAGR (2026-2036): 10.4%
What is the Digital Workplace in Energy and Utilities Market forecast to be worth by 2036?
USD 9.6 billion in 2026 to USD 25.8 billion by 2036 at 10.4% CAGR.
- The digital workplace in energy and utilities market reached USD 8.7 billion in 2025 as utilities widened adoption of collaboration and work management systems.
- Demand is projected to increase from USD 9.6 billion in 2026 to USD 25.8 billion by 2036.
- The market is forecast to record 10.4% CAGR from 2026 to 2036.
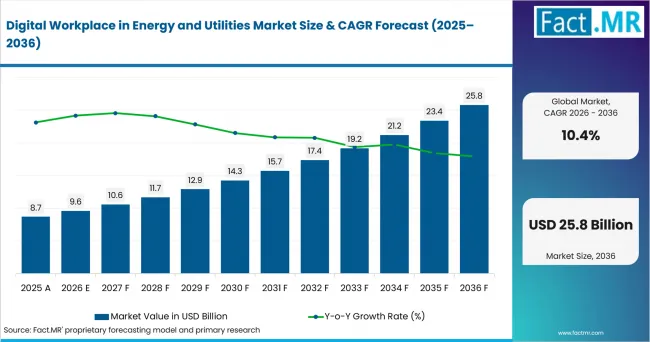
Digital Workplace In Energy And Utilities Market Value Analysis | Source: Fact.MR
What are the defining numbers behind Digital Workplace in Energy and Utilities Market growth?
A USD 16.2 billion absolute opportunity is expected by 2036.
- Demand Drivers in the Market
- Energy teams use sustainability energy management software to track bills and metering. Digital workplace tools are expected to keep consumption and carbon work visible to task approvers.
- Utilities are expected to use digital transformation technologies when manual handoffs slow field response. Shared workplace records help teams confirm who owns the next action.
- Renewable energy work and smart grid programs are expected to increase document flow. Utilities need task records that stay clear when asset alerts move between teams.
- Key Segments Analyzed
- By Solution Type: Workplace Collaboration Suite is expected to hold 38.0% share in 2026 because utilities need secure communication across field and office teams.
- By Business Function: Operations Management is projected to account for 41.0% share in 2026 as outage response and work scheduling need closer coordination.
- By End-use Utility: Electric Utilities are anticipated to capture 43.0% share in 2026 due to grid activity and compliance-heavy field operations.
- By Organization Type: Large Utility Enterprises are estimated to represent 40.0% share in 2026 because larger utilities carry wider user bases and complex work processes.
- By Deployment Architecture: Cloud-based Digital Workplace is forecast to hold 39.0% share in 2026 as utilities seek flexible access across mobile and remote operating environments.
- Analyst Opinion at Fact.MR
- Shambhu Nath Jha, Principal Consultant at Fact.MR, states, “Digital workplace platforms must connect utility field activity with office coordination without weakening security or compliance control. Buyer acceptance is expected to depend on workflow clarity, reliable task records and integration quality across operational teams rather than broad collaboration features alone.”
- Strategic Implications
- Brand owners should position platforms around utility workflow. Clear use-case evidence is expected to shorten review cycles and support higher-value sales.
- Providers can improve retention by documenting security controls and service outcomes in simple customer-facing materials. This lowers review friction for compliance teams.
- Implementation partners should align service packages with field coordination use cases. Migration work, training and integration planning are expected to decide repeat adoption.
The USA leads at 11.3% CAGR through utility cloud programs and field workforce modernization. Germany follows at 10.8% as energy transition work raises documentation needs. The UK reaches 10.2% through regulated modernization. Canada posts 9.7%, Japan records 9.2%, Australia reaches 8.8%, and India expands at 8.4%.
How does the Digital Workplace in Energy and Utilities Market break down by segment?
Workplace Collaboration Suite is expected to lead Solution Type at 38.0% share in 2026. Operations Management is projected to lead Business Function at 41.0%.
Which solution type dominates?
Workplace collaboration suite is projected to account for 38.0% share in 2026.
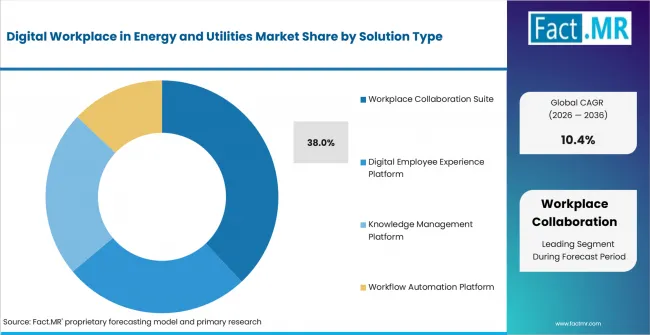
Digital Workplace In Energy And Utilities Market Analysis By Solution Type | Source: Fact.MR
Its lead reflects the need for one shared environment across field, office and customer-service teams. Centralized communication keeps updates consistent, while searchable records make operational activity easier to review during audits.
What leads the business function segment?
Operations management is expected to hold 41.0% share in 2026.
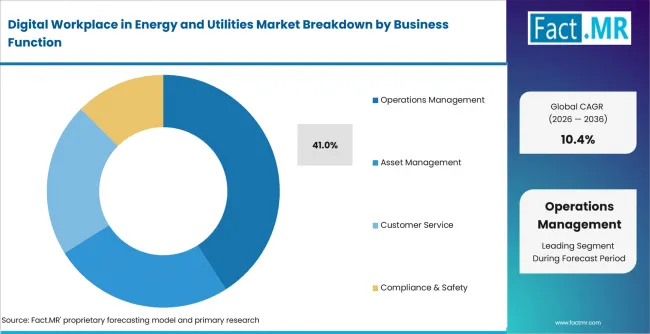
Digital Workplace In Energy And Utilities Market Analysis By Business Function | Source: Fact.MR
Outage response, work scheduling and customer commitments place this function at the center of utility activity. Digital workplace tools help task owners act on current asset information and coordinate decisions with asset performance management systems.
Why do electric utilities lead end-use utility?
Electric utilities are anticipated to account for 43.0% share in 2026.
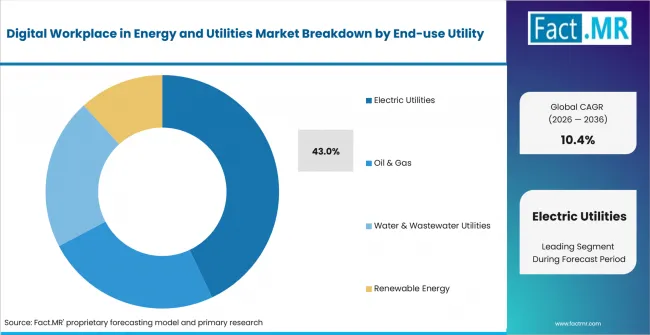
Digital Workplace In Energy And Utilities Market Analysis By End Use Utility | Source: Fact.MR
Grid operations involve continuous coordination between control rooms, field crews and customer teams. Shared platforms help meter data, service alerts and work instructions move between these groups without delay. Advanced metering infrastructure programs further increase the value of connected workflows.
What supports large utility enterprises within organization type?
Large utility enterprises are estimated to represent 40.0% share in 2026.
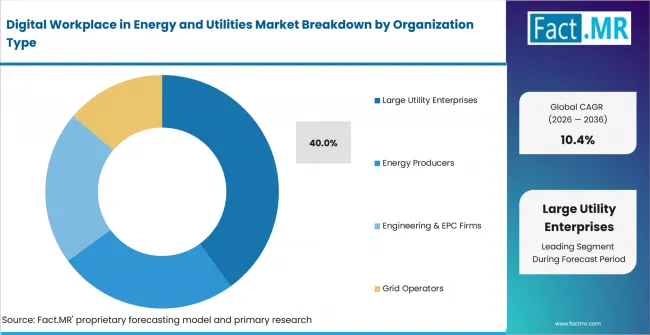
Digital Workplace In Energy And Utilities Market Analysis By Organization Type | Source: Fact.MR
Broader workforces and more complex governance create stronger demand for standardized digital processes. These organizations use common approval routes, task ownership rules and documentation practices to keep several departments aligned.
How does cloud-based digital workplace shape deployment demand?
Cloud-based digital workplace is forecast to hold 39.0% share in 2026.
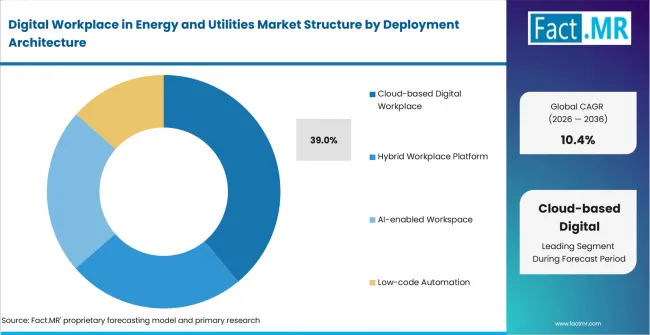
Digital Workplace In Energy And Utilities Market Analysis By Deployment Architecture | Source: Fact.MR
Distributed teams benefit from secure access across offices, field locations and mobile devices. Cloud delivery also simplifies software updates and user expansion. Hybrid architecture remains important where sensitive operational data or energy intelligence systems require partial local control.
What is accelerating Digital Workplace in Energy and Utilities Market adoption, and what is holding it back?
Demand is expected to rise as utilities connect people, assets and compliance work across digital channels. Adoption may be limited by rollout cost and integration checks.
Drivers Impact Analysis
| DRIVER | (~) % IMPACT ON CAGR | GEOGRAPHIC RELEVANCE | IMPACT TIMELINE |
|---|---|---|---|
| Adoption and integration | +1.6% | Global | Short term (<= 2 years) |
| Regulatory and compliance support | +1.4% | USA; Germany; UK | Short term (<= 2 years) |
| Channel and access expansion | +1.1% | Global | Medium term (2-4 years) |
| Clear specification and documentation | +0.9% | USA; UK; Canada | Medium term (2-4 years) |
| Cost and efficiency gains | +0.6% | Global | Long term (>= 4 years) |
- Adoption and integration: Utilities are expected to prioritize tools that connect collaboration with field execution. The commercial benefit comes from fewer handoffs during urgent work.
- Regulatory and compliance support: Compliance-heavy utilities need clear task history and document control. This makes audit readiness a purchase condition.
- Channel and access expansion: Implementation partners are expected to improve adoption where they combine platform setup with training and utility-specific workflow design.
Opportunity Impact Analysis
| OPPORTUNITY | (~) % IMPACT ON CAGR | GEOGRAPHIC RELEVANCE | IMPACT TIMELINE |
|---|---|---|---|
| Emerging application expansion | +1.0% | Global | Medium term (2-4 years) |
| Premium and specialist positioning | +0.8% | USA; UK; Germany | Medium term (2-4 years) |
| Channel and partner expansion | +0.7% | Global | Long term (>= 4 years) |
| Standards and compliance alignment | +0.5% | USA; Canada; Singapore | Long term (>= 4 years) |
- Emerging application expansion: Platforms that connect workforce coordination with utility analytics are expected to gain use in outage response and asset planning.
- Premium and specialist positioning: Vendors that show utility templates and compliance trails are expected to defend price. Generic tools face more review questions.
- Channel and partner expansion: Partner-led deployments are expected to grow when software migration and digital decarbonization solutions need one delivery plan.
Restraints Impact Analysis
| RESTRAINT | (~) % IMPACT ON CAGR | GEOGRAPHIC RELEVANCE | IMPACT TIMELINE |
|---|---|---|---|
| Cost and complexity | -1.1% | Global | Short term (<= 2 years) |
| Specification and compliance checks | -0.9% | USA; UK; Germany | Short term (<= 2 years) |
| Substitution by lower-cost alternatives | -0.7% | Import-dependent markets | Medium term (2-4 years) |
| Supply chain and pricing pressure | -0.5% | Global | Long term (>= 4 years) |
- Cost and complexity: Platform rollouts can require process redesign and employee training. Utilities may delay approval until the operating case is clear.
- Specification and compliance checks: Utilities often need evidence on security and access control. Data handling proof becomes necessary before operational users are added.
- Substitution by lower-cost alternatives: Some organizations may extend existing collaboration tools. Specialist platforms then need clearer proof of utility workflow value.
Which countries are scaling Digital Workplace in Energy and Utilities Market fastest?
- The country comparison spans 2.9 percentage points and forms three practical growth bands across the forecast period.
- The USA remains 0.5 percentage point above Germany through utility cloud programs and enterprise software depth.
- Germany remains 0.6 percentage point above the UK as energy transition work raises documentation needs.
- The UK remains 0.5 percentage point above Canada through regulated modernization and customer-service workflow updates.
- Canada remains 0.5 percentage point above Japan through broad service territories and remote workforce coordination.
- Japan remains 0.4 percentage point above Australia through disciplined utility operations and careful enterprise software selection.
- Australia remains 0.4 percentage point above India through faster cloud readiness and utility workforce digitization.
Comparable CAGRs can create different entry conditions due to cloud policy, field-service maturity and regulatory review. Full report coverage includes North America, Latin America, Europe, East Asia, South Asia and Pacific, Middle East and Africa.
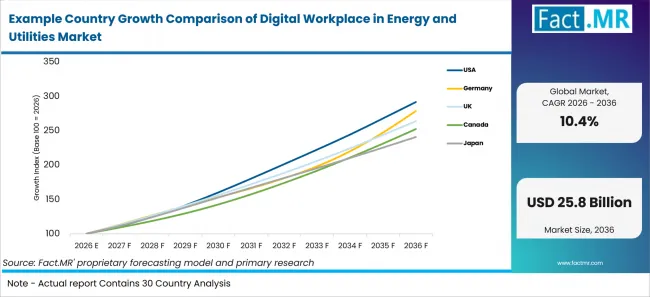
Example Country Growth Comparison Of Digital Workplace In Energy And Utilities Market | Source: Fact.MR
| Country | CAGR (2026-2036) |
|---|---|
| USA | 11.3% |
| Germany | 10.8% |
| UK | 10.2% |
| Canada | 9.7% |
| Japan | 9.2% |
| Australia | 8.8% |
| India | 8.4% |
What supports USA adoption?
11.3% CAGR, supported by utility cloud programs and cross-functional field coordination.
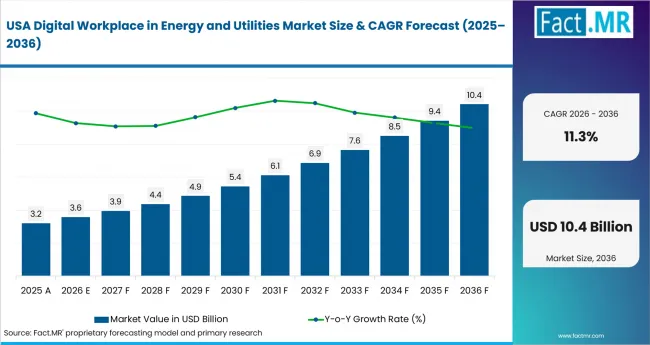
Digital Workplace In Energy And Utilities Market Country Value Analysis | Source: Fact.MR
Large utility workforces create demand for platforms that connect field crews, office teams and customer-service functions. Broader deployment is likely when vendors demonstrate secure access, dependable integration and clear workflow ownership across existing utility systems.
How is Germany scaling demand?
10.8% CAGR, backed by energy transition execution and structured utility documentation.
Germany’s market benefits from grid modernization and renewable energy integration. Buyers place strong emphasis on responsibility records, task history and compliance-ready documentation. Platforms that make these records easy to review can move through procurement more efficiently.
What is driving the UK’s growth from 2026 to 2036?
10.2% CAGR, supported by regulated utility modernization and customer-service workflow updates.
The UK’s regulated environment requires close coordination between customer contact, field response and operational reporting. Digital workplace providers gain relevance when their systems make workflow controls, approvals and service records visible during review.
How is Canada developing demand?
9.7% CAGR, driven by broad service territories and remote workforce coordination.
Canada’s utilities operate across large and often dispersed regions, making remote access central to daily work. Mobile collaboration and shared task records help field teams stay connected when they are far from offices and control centers.
How does Japan perform?
9.2% CAGR, led by process discipline and careful enterprise technology selection.
Japanese utilities tend to favor controlled implementation and consistent documentation. Security validation and system reliability carry significant weight before wider rollout. Adoption may therefore progress steadily rather than rapidly as buyers complete detailed platform reviews.
What supports Australia’s growth?
8.8% CAGR, backed by cloud readiness and utility workforce digitization.
Remote assets and field-service requirements give Australia a strong use case for cloud-based workplace tools. Implementation partners influence adoption by supporting migration, training and workflow setup across geographically separated teams.
How is India scaling adoption?
8.4% CAGR, supported by gradual utility digitization and larger enterprise modernization programs.
India’s demand is emerging across power, water and renewable energy organizations. Buyers are likely to favor phased deployment that controls cost while improving coordination. Flexible implementation plans can help utilities expand usage after early operational benefits become visible.
Who leads the Digital Workplace in Energy and Utilities Market?
Microsoft and IBM show relevance through enterprise collaboration, asset intelligence and utility workflow support, while Oracle and SAP strengthen operational data and business-process integration.
Cisco adds secure communication infrastructure for distributed teams. Accenture contributes implementation and transformation expertise. Salesforce and ServiceNow support customer workflows, case management and task automation. Schneider Electric–AVEVA extends the field through industrial software, grid operations and asset information platforms that connect office coordination with field execution across energy and utility organizations.
Which companies are the key providers?
Key companies include Microsoft Corporation, IBM Corporation, Oracle Corporation, SAP SE, Cisco Systems, Inc., Accenture plc, Salesforce, Inc., ServiceNow, Inc., Schneider Electric SE – AVEVA.
- Microsoft Corporation
- IBM Corporation
- Oracle Corporation
- SAP SE
- Cisco Systems, Inc.
- Accenture plc
- Salesforce, Inc.
- ServiceNow, Inc.
- Schneider Electric SE – AVEVA
Bibliography
- Accenture. (2025, February 25). AI is reshaping utilities: From automation to autonomy.
- AVEVA Group Limited. (2025, October 23). AVEVA unveils key industrial digital twin solutions at Schneider Innovation Summit Copenhagen.
- IBM Corporation. (2026, June 22). What is utility asset management?
- International Energy Agency. (2026, July 23). Global electricity demand growth set to accelerate as power systems adjust to recent shocks.
- Oracle Corporation. (2025, March 3). Oracle helps utilities transform raw data into intelligence.
This Report Answers
- The report provides strategic intelligence on the Digital Workplace in Energy and Utilities Market across the covered solution and deployment choices.
- Segment analysis covers Workplace Collaboration Suite and Operations Management as 2026 share leaders.
- Country outlook evaluates the USA and Germany alongside the UK and Canada. Japan, Australia and India complete the comparison.
- Competitive analysis profiles the listed workplace software and utility technology providers.
- Deployment assessment covers Cloud-based Digital Workplace and Hybrid Workplace Platform. AI-enabled Workspace completes the view with Low-code Automation.
What does the Digital Workplace in Energy and Utilities Market cover?
Digital workplace in energy and utilities platforms are used to connect collaboration, workflow and operational tasks across utility organizations.
The Digital Workplace in Energy and Utilities Market covers tools used by electric utilities and large utility enterprises. Oil and gas, water and renewable energy users are included when the software supports workplace coordination.
What is included in the scope?
Digital workplace in energy and utilities platforms are assessed across solution and function. Utility type, organization type and deployment architecture complete the scope.
The scope includes Workplace Collaboration Suite and Digital Employee Experience Platform. Knowledge Management Platform and Workflow Automation Platform complete the solution view.
What is excluded from the scope?
General enterprise software outside utility workplace use remains outside the market definition.
Products outside digital workplace use in energy and utilities are excluded. Standalone hardware, unrelated industrial equipment and company share estimates are outside the definition.
How Was the Analysis Built?
The analysis draws on 120+ sources, 35+ company portfolios, 25+ countries, and more than 20 industry interviews.
- Primary Research: Primary research includes discussions with manufacturers, service providers, technology developers, distributors, end users, procurement teams, and subject-matter experts. These conversations examine purchasing priorities, product adoption, operational challenges, approval requirements, competitive positioning, and the factors that influence wider market acceptance.
- Desk Research: Desk research covers government statistics, regulatory publications, company filings, trade data, technical studies, industry associations, standards, public policy, and other authoritative sources. Every source used in the analysis is documented in the bibliography.
- Market Sizing and Forecasting: Market estimates combine historical performance, demand indicators, pricing and volume trends, segment shares, company participation, country-level growth, adoption patterns, investment activity, and barriers to market expansion.
- Data Validation and Update Cycle: Findings are validated by comparing primary interviews with public data, company activity, regulatory changes, trade patterns, and industry developments. Regular updates review new product launches, capacity changes, partnerships, approvals, procurement trends, and shifts in commercial adoption.
What is the report’s scope and coverage?
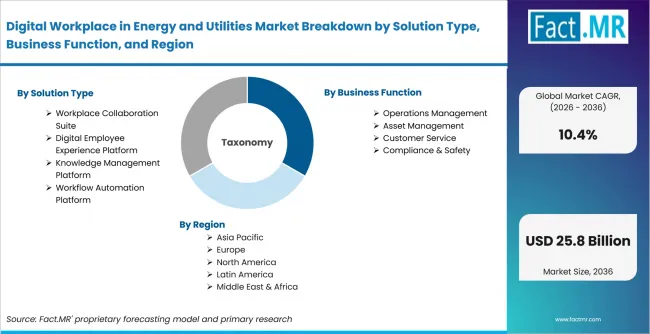
Digital Workplace In Energy And Utilities Market Breakdown By Solution Type, Business Function, And Region | Source: Fact.MR
| Attribute | Details |
|---|---|
| Quantitative Units | USD billion in 2026 to USD billion by 2036 at CAGR |
| Market Definition | Digital workplace platforms used by energy and utilities organizations to coordinate field, office, operational and compliance work |
| Solution Type | Workplace Collaboration Suite; Digital Employee Experience Platform; Knowledge Management Platform; Workflow Automation Platform |
| Business Function | Operations Management; Asset Management; Customer Service; Compliance & Safety |
| End-use Utility | Electric Utilities; Oil & Gas; Water & Wastewater Utilities; Renewable Energy |
| Organization Type | Large Utility Enterprises; Energy Producers; Engineering & EPC Firms; Grid Operators |
| Deployment Architecture | Cloud-based Digital Workplace; Hybrid Workplace Platform; AI-enabled Workspace; Low-code Automation |
| Regions Covered | North America; Latin America; Europe; East Asia; South Asia and Pacific; Middle East and Africa |
| Countries Covered | USA; Germany; UK; Canada; Japan; Australia; India |
| Key Companies Profiled | Microsoft Corporation; IBM Corporation; Oracle Corporation; SAP SE; Cisco Systems, Inc.; Accenture plc; Salesforce, Inc.; ServiceNow, Inc.; Schneider Electric SE – AVEVA |
| Forecast Period | 2026 to 2036 |
| Approach | Hybrid top-down and bottom-up approach using utility software demand; enterprise workplace adoption; segment share; country growth; cloud deployment; application integration; procurement behavior and company portfolio review |
How is the market segmented?
-
By Solution Type
- Workplace Collaboration Suite
- Digital Employee Experience Platform
- Knowledge Management Platform
- Workflow Automation Platform
-
By Business Function
- Operations Management
- Asset Management
- Customer Service
- Compliance & Safety
-
By End-use Utility
- Electric Utilities
- Oil & Gas
- Water & Wastewater Utilities
- Renewable Energy
-
By Organization Type
- Large Utility Enterprises
- Energy Producers
- Engineering & EPC Firms
- Grid Operators
-
By Deployment Architecture
- Cloud-based Digital Workplace
- Hybrid Workplace Platform
- AI-enabled Workspace
- Low-code Automation
-
By Region
- North America
- Latin America
- Europe
- East Asia
- South Asia and Oceania
- Middle East and Africa