- Market Value (2025): USD 933.6 Mn
- Estimated Value (2026): USD 990.0 Mn
- Forecast Value (2036): USD 1780.0 Mn
- CAGR (2026-2036): 6.0%
What is the Digital Poster Displays Market forecast to be worth by 2036?
USD 990.0 million in 2026 to USD 1,780.0 million by 2036 at 6.0% CAGR.
- The digital poster displays market reached USD 933.6 million in 2025 as event buyers increased spending on live schedule updates and reusable sponsor panels.
- Demand is projected to increase from USD 990.0 million in 2026 to USD 1,780.0 million by 2036.
- The market is forecast to record 6.0% CAGR from 2026 to 2036 owing to real-time schedule updates and central content management.
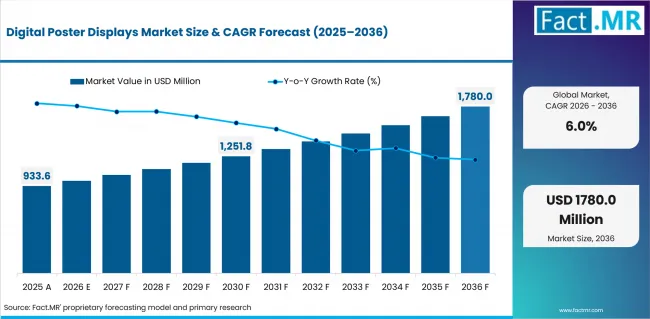
Digital Poster Displays Market Value Analysis | Source: Fact.MR
What are the defining numbers behind Digital Poster Displays Market growth?
USD 790.0 million absolute opportunity by 2036, led by Freestanding posters and Cloud CMS alongside Event schedules and Venue operators.
- Demand Drivers in the Market
- Real-time schedule updates are expected to support demand because venues need agenda edits to appear before visitors reach the wrong place. Providers can make the buying case clearer by assigning update ownership before each event day.
- Sponsor inventory expansion is projected to support posters that rotate paid messages around agenda boards and wayfinding points. The same screen can serve different sponsors during the day so venues can sell inventory without adding print work.
- Reduced print replacement is anticipated to make digital poster displays easier to justify during budget review. Buyers compare lifetime setup work with repeated poster printing and late rework before they approve a rollout.
- Central content management is estimated to matter most for venues that run shows with different organizers. A clear CMS workflow reduces manual copying and keeps approved messages consistent across the poster network.
- Key Segments Analyzed
- By Display Form: Freestanding posters are expected to hold 35.0% share in 2026 because they solve placement and visibility needs without permanent installation.
- By Screen Size: <32 inch is anticipated to capture 13.0% share in 2026 as smaller posters fit registration desks and conference-room entrances.
- By Content Function: Event schedules are forecast to represent 26.0% share in 2026 because agenda changes remain the highest-frequency event use case.
- By Connectivity: Cloud CMS is estimated to command 33.0% share in 2026 since multi-screen updates require remote publishing and content approval.
- By Buyer Type: Venue operators are projected to hold 28.0% share in 2026 because they control repeat setup across halls and recurring events.
- Analyst Opinion at Fact.MR
- Shambhu Nath Jha, Sr. Consultant at Fact.MR, states, “Digital poster displays are bought when venues need live content control and clear reading in crowded event areas. Purchase approval is expected to depend on update discipline, fallback content and repeatable setup. Hardware alone is not enough to prove the value case.”
- Strategic Implications
- Event buyers can define minimum type size and assign update ownership before the first setup. This makes live poster control part of the operating plan rather than a last-minute site decision.
- Display providers can strengthen proposals by packaging portrait displays with media players and content controls. Each proposal needs to clarify responsibility for publishing and recovery during the event.
- Venue and agency teams benefit from testing poster readability along the actual traffic path before wider rollout. A post-event review can then identify halls suited to freestanding units and entrances better served by smaller displays.
UAE is expected to record a 6.7% CAGR from 2026 to 2036. USA is forecast to record a 6.0% CAGR from 2026 to 2036. Japan is anticipated to record a 5.9% CAGR from 2026 to 2036. UK is estimated to record a 5.7% CAGR from 2026 to 2036. Germany is projected to record a 5.4% CAGR from 2026 to 2036.
How does the Digital Poster Displays Market break down by segment?
Freestanding posters are expected to lead Display Form at 35.0% share in 2026. Cloud CMS is projected to lead Connectivity at 33.0% share in 2026.
Which display form dominates?
Freestanding posters are projected to account for 35.0% share in 2026.
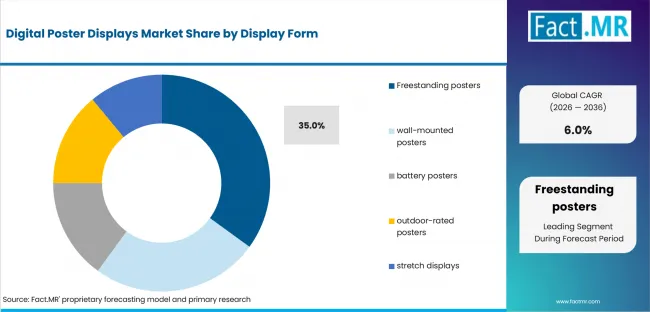
Digital Poster Displays Market Analysis By Display Form | Source: Fact.MR
Freestanding units give venues a flexible option for entrances, sponsor zones, and temporary wayfinding points. Their main advantage is mobility, since staff can reposition screens when traffic patterns or floor plans change. Rental companies also gain value from standardizing height, power access, and cable routing across events. Unlike interactive displays, these units focus on visibility and rapid deployment rather than touch-based engagement or deeper visitor interaction.
What leads the Screen Size segment?
<32 inch is expected to hold 13.0% share in 2026.
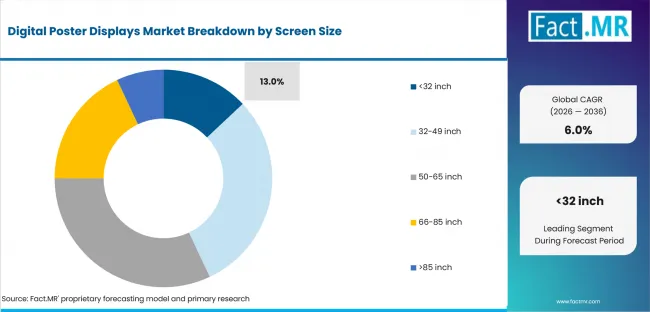
Digital Poster Displays Market Analysis By Screen Size | Source: Fact.MR
Screens below 32 inches suit registration desks, meeting-room entrances, and compact information points where visitors view content from a short distance. Their smaller footprint helps preserve open walkways and simplifies mounting or counter placement. This category also supports lower power use and frequent content refreshes during short events. Larger displays remain important in lobbies and main halls, but they demand wider sightlines and more careful positioning.
How does Content Function shape demand?
Event schedules are anticipated to lead with 26.0% share in 2026.
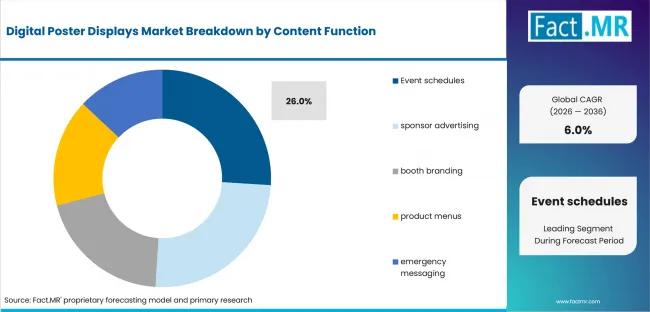
Digital Poster Displays Market Analysis By Content Function | Source: Fact.MR
Schedules form the core content function because room changes, delayed sessions, and speaker updates affect the entire visitor journey. Digital posters let organizers revise information without printing replacement signs or sending staff across the venue. Clear timing also improves movement between halls and reduces confusion during peak transitions. Sponsor messaging becomes more effective once the schedule system is dependable, accurate, and easy to update throughout the event day.
What supports Cloud CMS within Connectivity?
Cloud CMS is estimated to represent 33.0% share in 2026.
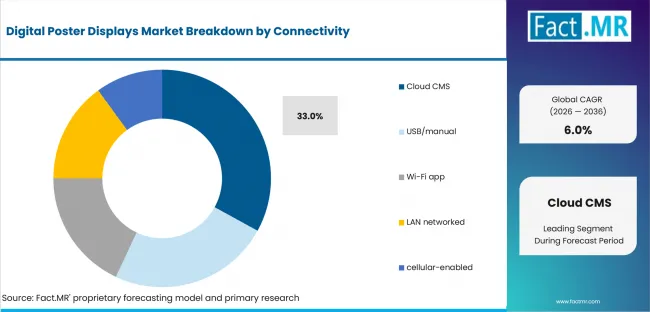
Digital Poster Displays Market Analysis By Connectivity | Source: Fact.MR
Cloud-based control gives organizers one publishing point for multiple poster screens across the venue. This reduces manual updates and helps staff keep schedules, sponsor content, and emergency notices consistent. Approval workflows can also limit accidental changes before material goes live. The model becomes especially valuable when several halls operate at once, because remote access allows one team to manage corrections quickly without visiting every display location.
Why do Venue operators lead Buyer Type?
Venue operators are forecast to hold 28.0% share in 2026.
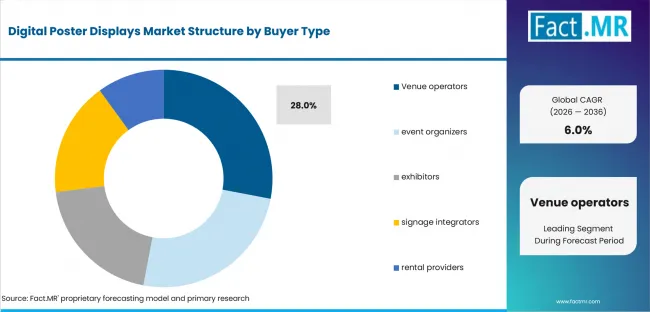
Digital Poster Displays Market Analysis By Buyer Type | Source: Fact.MR
Venue operators lead because they manage recurring event spaces and understand where signage problems appear most often. Their investment case centers on faster setup, fewer printed replacements, and smoother content changes between events. Permanent familiarity with entrances, halls, and traffic routes also helps them choose the right display mix. Large LED walls may support headline messaging, while poster screens handle closer viewing, room guidance, and frequent schedule revisions.
What is accelerating Digital Poster Displays Market adoption, and what is holding it back?
Demand is expected to be driven by live schedule control and sponsor-screen use. Adoption is expected to be held back by glare and network dependence when setup planning is weak.
Drivers Impact Analysis
| DRIVER | (~) % IMPACT ON CAGR | GEOGRAPHIC RELEVANCE | IMPACT TIMELINE |
|---|---|---|---|
| Real-time schedule updates | +1.6% | China and UAE | Short term (<=2 years) |
| Sponsor inventory expansion | +1.3% | Mature exhibition markets | Short term (<=2 years) |
| Reduced print replacement | +1.0% | Global | Medium term (2-4 years) |
| Central content management | +0.7% | North America and Europe | Medium term (2-4 years) |
Source: Fact.MR analysis. Updated Jul 27, 2026
- Real-time schedule updates: Live agenda control is expected to strengthen demand once it becomes part of the event specification. Providers must show how room changes and timing updates appear without confusing visitors.
- Sponsor inventory expansion: Paid message rotation is projected to support additional display use in venues that sell sponsor placements. The use case works best when sponsor content does not interrupt schedule readability.
- Reduced print replacement: Reusable poster fleets are expected to reduce repeated printing and late physical changes. Buyers still check whether setup work and content approval remain manageable for each event.
- Central content management: CMS control is anticipated to move purchases forward where several organizers use the same venue. The value is clearest when one approved workflow controls all poster screens.
Opportunity Impact Analysis
| OPPORTUNITY | (~) % IMPACT ON CAGR | GEOGRAPHIC RELEVANCE | IMPACT TIMELINE |
|---|---|---|---|
| Battery-operated poster fleets | +1.1% | China and UAE | Short term (<=2 years) |
| Location-aware content rotation | +0.8% | USA and UK | Medium term (2-4 years) |
| Emergency-message integration | +0.5% | Germany and Japan | Medium term (2-4 years) |
Source: Fact.MR analysis. Updated Jul 27, 2026
- Battery-operated poster fleets: Battery units are expected to widen placement options where power access slows setup. Buyers still need charging routines and safe storage plans before wider use.
- Location-aware content rotation: Zone-level content is projected to add value when organizers match messages to halls and visitor routes. This opportunity requires clean screen mapping and simple approval steps.
- Emergency-message integration: Emergency messaging is anticipated to expand the use case after routine schedule updates are stable. It remains a support feature and should not weaken day-to-day poster management.
- Sensor-based placement review: Venue teams are expected to use traffic sensing only when it improves poster placement decisions. PIR sensor data can guide viewing zones without becoming the main purchase reason.
Restraints Impact Analysis
| RESTRAINT | (~) % IMPACT ON CAGR | GEOGRAPHIC RELEVANCE | IMPACT TIMELINE |
|---|---|---|---|
| Screen glare and viewing angle | -1.1% | Global | Short term (<=2 years) |
| Network dependence | -0.8% | Cost-sensitive regional markets | Medium term (2-4 years) |
| Content governance across organizers and sponsors | -0.6% | Highly regulated venues | Short term (<=2 years) |
Source: Fact.MR analysis. Updated Jul 27, 2026
- Screen glare and viewing angle: Poster displays lose value when visitors cannot read content from the normal walking path. Providers need site testing before recommending screen size and placement.
- Network dependence: Cloud updates depend on stable connectivity during setup and show hours. Offline fallback content is expected to remain a basic requirement for venues with crowded networks.
- Content governance across organizers and sponsors: Approval control can slow updates when many parties provide messages. Venues need a clear publishing owner so schedule changes do not conflict with sponsor content.
Which countries are scaling Digital Poster Displays Market fastest?
The country comparison is defined less by the overall CAGR range and more by the spacing between the markets. China and the UAE form a compact upper cluster while the USA and Japan remain closely aligned around the global rate. The UK and Germany occupy a more measured lower group. The total range between China and Germany is 1.8 percentage points. A notable step-down appears between the UAE and the USA which separates high-turnover event markets from more evidence-led buying environments. These differences reflect venue operating models and content-control requirements rather than present market size.
- China holds a notable position because multi-city exhibitions create repeated demand for movable displays and rapid schedule changes.
- The UAE remains close to China in CAGR terms but depends more on short event reset cycles and battery-supported placement across large venues.
- USA growth aligns with the global rate as buyers place greater emphasis on sponsor inventory returns and dependable content approval.
- Japan sits only 0.1 percentage points from the USA yet follows a different route through compact venues and stricter readability requirements.
- The UK is closely spaced with Japan but relies more on recurring exhibitions and rental-friendly poster fleets that reduce repeated print work.
- Germany occupies a measured position because product documentation and glare testing can extend approval before wider venue deployment.
Comparable CAGRs can therefore create different market entry conditions. Deployment timing depends on venue turnover and publishing ownership while commercial approval varies with readability proof and service support.
The full report provides country-level CAGR analysis across North America, Latin America, Europe, East Asia, South Asia, Oceania and the Middle East and Africa.
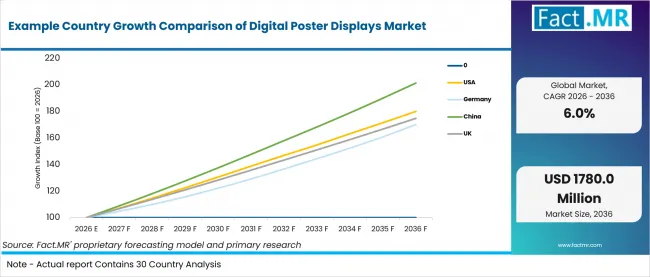
Example Country Growth Comparison Of Digital Poster Displays Market | Source: Fact.MR
| Country | CAGR (2026-2036) |
|---|---|
| UAE | 6.7% |
| USA | 6.0% |
| Japan | 5.9% |
| UK | 5.7% |
| Germany | 5.4% |
Source: Fact.MR analysis. Updated Jul 27, 2026
How is the UAE scaling demand?
6.7% CAGR, backed by high-throughput venues and frequent event resets.
The UAE’s growth is shaped by large exhibition venues that host business events with short turnaround windows. Poster displays are useful when organizers need clear wayfinding and fast agenda changes during the event day. Buyers are expected to value battery options and CMS control because venue teams must reset content quickly between shows.
What is driving USA growth from 2026 to 2036?
6.0% CAGR, driven by sponsor inventory and event communication needs.
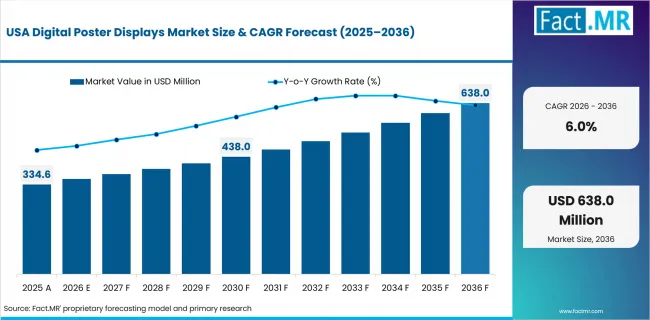
Digital Poster Displays Market Country Value Analysis | Source: Fact.MR
The USA market is expected to grow around the global pace as convention centers and agencies measure the return from sponsor-screen inventory. Digital posters support paid placements when they do not weaken schedule readability. Providers need to prove simple content approval and reliable recovery because show networks can become crowded during major events.
How is Japan developing demand?
5.9% CAGR, supported by compact venues and smaller poster formats.
Japan’s growth reflects a market where space discipline and reading distance shape purchase decisions. Smaller poster displays fit entrances and meeting-room points where visitors need quick information. Providers are expected to win approval when they can show low glare and clean mounting choices inside compact venue layouts.
How does the UK perform?
5.7% CAGR, led by recurring shows and rental-friendly display use.
The UK market is expected to grow through recurring exhibitions and agency-led event services. Freestanding and battery-operated poster displays help organizers avoid repeated print work across similar show formats. Buyers are likely to compare rental flexibility and content handover steps before they approve wider fleet use.
What supports Germany’s growth?
5.4% CAGR, backed by documentation-led buying and controlled venue use.
Germany’s growth is expected to remain measured because venue customers often require clear product evidence before rollout. Digital poster displays need to prove readability and content control under strict setup planning. Providers that document viewing angles and publishing responsibilities are expected to face fewer approval delays.
Who leads the Digital Poster Displays Market?
Samsung and LG have the clearest direct fit through commercial ePaper displays and CMS support. PPDS – Philips Professional Displays and Sharp strengthen the ePaper poster field. ViewSonic completes the provider set where buyers compare freestanding poster formats.
Samsung supports poster replacement through Color E-Paper signage and VXT content management. LG contributes LG E-paper Display and SuperSign CMS. PPDS – Philips Professional Displays and Sharp extend the field through ePaper products designed as alternatives to printed posters. ViewSonic remains in the provider comparison for freestanding poster formats. The wider hardware field overlaps with OLED display formats when the screen is configured for poster-style commercial use.
Competition through 2036 will focus on clear portrait screens and dependable content software. Easy installation will also influence buying decisions. Venues may compare battery life and offline backup before selecting a provider. Companies that show clear content responsibility and proven screen visibility are more likely to attract event organizers.
Which companies are the key providers?
Key companies include Samsung, LG, PPDS – Philips Professional Displays, Sharp, and ViewSonic.
- Samsung
- LG
- PPDS – Philips Professional Displays
- Sharp
- ViewSonic
Bibliography
- Dubai World Trade Centre. (2026, April 7). DWTC welcomes nearly 3 million participants in 2025.
- LG Electronics. (2026, May 28). LG Electronics launches ultra-low-power “LG E-paper Display” for commercial spaces.
- Samsung Electronics. (2025, June 5). Samsung launches Color E-Paper, delivering high-impact, energy-efficient digital signage for businesses.
- PPDS – Philips Professional Displays. Philips Tableaux ePaper displays.
- Sharp. ePoster and ePaper digital signage solutions.
- ViewSonic. ePoster digital signage display solutions.
- National Bureau of Statistics of China. (2026, January 31). Business revenue of enterprises above the designated size engaged in culture and related industries in 2025.
This Report Answers
- The report provides strategic intelligence on the Digital Poster Displays Market across Display Form and Screen Size choices that shape event poster programs.
- Segment analysis covers Freestanding posters and <32 inch screens as the share leaders within the 2026 market.
- Country outlook evaluates China and the UAE alongside the USA and Japan. The UK and Germany complete the growth comparison across the profiled markets.
- Competitive analysis profiles Samsung and LG alongside PPDS – Philips Professional Displays and Sharp. ViewSonic completes the provider set for freestanding ePoster systems.
- Connectivity assessment covers Cloud CMS and USB or SD playback. LAN or Wi-Fi media players and integrated SoC displays complete the view alongside API-connected venue systems.
What does the Digital Poster Displays Market cover?
Digital poster displays are portrait-oriented screens used for event schedules and sponsor messages. They support wayfinding prompts and other poster-style venue content.
The Digital Poster Displays Market covers freestanding and mounted poster screens used in event venues and commercial public spaces. Coverage extends to outdoor weather-rated posters and battery-operated fleets when they serve poster-style communication. The market includes hardware and content controls that support schedule updates and sponsor rotation.
The market differs from broad signage spending because value comes from replacing printed poster workflows with controlled screen updates. Video walls and large lobby media are excluded unless the unit works as a poster-style display.
What is included in the scope?
The scope includes poster-style commercial displays used by venue operators and event organizers. Retail operators, hospitality sites and rental providers are included when poster-style use is clear.
Coverage includes Display Form and Screen Size alongside Content Function, Connectivity and Buyer Type. The display form scope spans freestanding posters and wall-mounted slim posters. Hanging aisle posters and outdoor weather-rated posters are included when they serve event communication. Battery-operated poster fleets are included when they replace printed signs across temporary or recurring event spaces. Cloud CMS and playback-based systems follow the same poster-use rule.
What is excluded from the scope?
General digital signage systems and unrelated commercial screens remain outside the scope when they do not function as poster-style event displays.
The scope excludes large video walls used mainly for brand media and entertainment. Touch kiosks are excluded when transactions or self-service are the main function. Consumer televisions and office presentation screens are excluded. General software subscriptions are excluded unless they control the content of poster displays. Company revenue without a clear connection to poster-style displays remains excluded.
How Was the Analysis Built?
The analysis draws on 120+ sources, 35+ company portfolios, 25+ countries, and more than 20 industry interviews.
- Primary Research: Primary research includes discussions with manufacturers, service providers, technology developers, distributors, end users, procurement teams, and subject-matter experts. These conversations examine purchasing priorities, product adoption, operational challenges, approval requirements, competitive positioning, and the factors that influence wider market acceptance.
- Desk Research: Desk research covers government statistics, regulatory publications, company filings, trade data, technical studies, industry associations, standards, public policy, and other authoritative sources. Every source used in the analysis is documented in the bibliography.
- Market Sizing and Forecasting: Market estimates combine historical performance, demand indicators, pricing and volume trends, segment shares, company participation, country-level growth, adoption patterns, investment activity, and barriers to market expansion.
- Data Validation and Update Cycle: Findings are validated by comparing primary interviews with public data, company activity, regulatory changes, trade patterns, and industry developments. Regular updates review new product launches, capacity changes, partnerships, approvals, procurement trends, and shifts in commercial adoption.
Segmentation
What is the report’s scope and coverage?
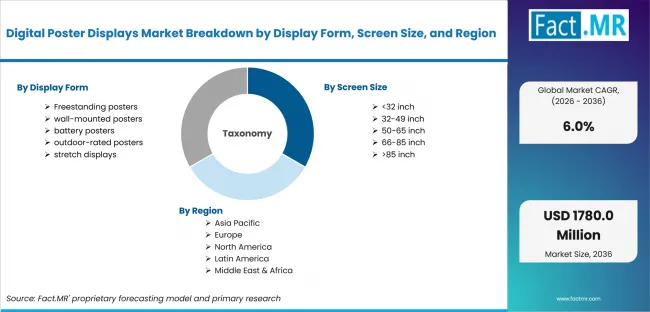
Digital Poster Displays Market Breakdown By Display Form, Screen Size, And Region | Source: Fact.MR
| Attribute | Details |
|---|---|
| Quantitative Units | USD 990.0 million in 2026 to USD 1,780.0 million by 2036 at 6.0% CAGR |
| Market Definition | Portrait-oriented commercial screens used as event poster boards and schedule displays where readable content, update control and repeat setup determine buyer approval |
| Display Form | Freestanding posters; Wall-mounted slim posters; Hanging aisle posters; Outdoor weather-rated posters; Battery-operated poster fleets |
| Screen Size | <32 inch; 32-43 inch; 44-55 inch; 56-75 inch; >75 inch |
| Content Function | Event schedules; Promotions and sponsors; Wayfinding and floor plans; Menu and product boards; Emergency and compliance notices |
| Connectivity | Cloud CMS; USB or SD playback; LAN or Wi-Fi media players; Integrated SoC displays; API-connected venue systems |
| Buyer Type | Venue operators; Event organizers; Retail and mall operators; Hospitality and convention centers; Rental and staging providers |
| Regions Covered | North America; Latin America; Europe; East Asia; South Asia and Pacific; Middle East and Africa |
| Countries Covered | China; UAE; USA; Japan; UK; Germany |
| Key Companies Profiled | Samsung; LG; PPDS – Philips Professional Displays; Sharp; ViewSonic |
| Forecast Period | 2026 to 2036 |
| Approach | Hybrid top-down and bottom-up approach using digital signage demand; event venue requirements; poster replacement activity; venue content workflows; display form usage; screen size requirements; content function needs; connectivity preferences; buyer type behavior; country adoption patterns and company portfolio review |
Source: Fact.MR analysis. Updated Jul 27, 2026
How is the market segmented?
-
By Display Form:
- Freestanding posters
- Wall-mounted slim posters
- Hanging aisle posters
- Outdoor weather-rated posters
- Battery-operated poster fleets
-
By Screen Size:
- <32 inch
- 32-43 inch
- 44-55 inch
- 56-75 inch
- >75 inch
-
By Content Function:
- Event schedules
- Promotions and sponsors
- Wayfinding and floor plans
- Menu and product boards
- Emergency and compliance notices
-
By Connectivity:
- Cloud CMS
- USB or SD playback
- LAN or Wi-Fi media players
- Integrated SoC displays
- API-connected venue systems
-
By Buyer Type:
- Venue operators
- Event organizers
- Retail and mall operators
- Hospitality and convention centers
- Rental and staging providers
-
By Region:
- North America
- USA
- Canada
- Latin America
- Brazil
- Mexico
- Rest of Latin America
- Europe
- Germany
- U.K.
- France
- Italy
- Spain
- Rest of Europe
- East Asia
- South Korea
- Japan
- China
- South Asia & Oceania
- India
- Australia & New Zealand
- Rest of South Asia & Oceania
- Middle East & Africa
- GCC Countries
- South Africa
- UAE
- Rest of Middle East & Africa
- North America
Frequently Asked Questions
Which Display Form leads the market?
Which Screen Size leads the market?
Which Content Function category leads the market?
Which Connectivity category leads the market?
Which Buyer Type leads the market?
Which country records the highest listed CAGR?
What is the primary driver in this market?
What is the main restraint?
Why do venue operators lead demand?
Who worked on this report


Preview the report firsthand - request a free sample
Free SampleGet the brochure for pricing and purchase details
Download PDF