- Market Value (2025): USD 8.7 Bn
- Estimated Value (2026): USD 9.6 Bn
- Forecast Value (2036): USD 24.9 Bn
- CAGR (2026-2036): 10.0%
What is the E-Commerce Enterprise Resource Planning Integration Market forecast to be worth by 2036?
USD 9.6 billion in 2026 to USD 24.9 billion by 2036 at a 10.0% CAGR.
- The e-commerce enterprise resource planning integration market reached an estimated USD 8.7 billion in 2025, calculated from the 2026 value and stated CAGR.
- Demand is projected to increase from USD 9.6 billion in 2026 to USD 24.9 billion by 2036.10.0% CAGR
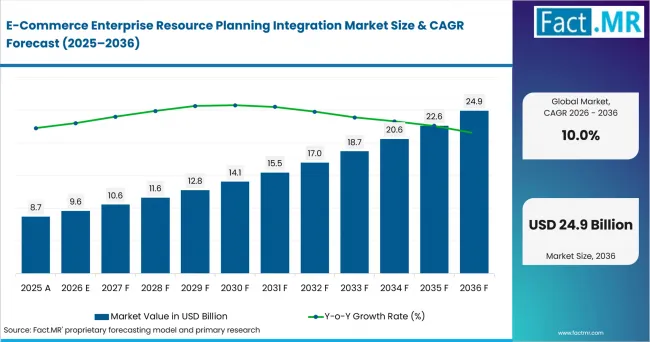
E Commerce Enterprise Resource Planning Integration Market Value Analysis | Source: Fact.MR
What are the defining numbers behind E-Commerce Enterprise Resource Planning Integration Market growth?
An absolute opportunity of USD 15.2 billion is expected between 2026 and 2036.
- Demand Drivers in the Market
- Enterprise resource planning is the integrated management of main business processes, often in real time and mediated by software, using a suite of integrated applications to collect, store, manage and interpret data from many business activities.
- The finance module provides the system of record for the organisation, giving complete visibility to enterprises.
- E-commerce growth is driving integration of online storefronts with ERP systems for order, inventory and financial data synchronization.
- Key Segments Analyzed
- By Integration Solution: iPaaS Integration Platform 40.0% share in 2026.
- By Business Function: Order Management Integration accounts for 42.0% share in 2026.
- By End-use Industry: Retail & E-commerce accounts for 45.0% share in 2026.
- By Organization Type: Large Enterprises accounts for 41.0% share in 2026.
- By Deployment Model: Cloud-based Integration accounts for 43.0% share in 2026.
- Analyst Opinion at Fact.MR
- Shambhu Nath Jha, Principal Consultant at Fact.MR, states, “E-Commerce Enterprise Resource Planning Integration companies need to show how the product fits each use case. Leading positioning supports premium demand, but repeat sales are expected to depend on consistent quality, clear documentation and a measurable outcome.”
- Strategic Implications
- Brands should position offerings by application fit. Clearer articulation of the specific use case and the supporting evidence is expected to shorten the buying decision and strengthen pricing power.
- Suppliers can strengthen retention by documenting performance in simple customer-facing materials. Transparent documentation reduces evaluation friction and supports repeat purchasing.
- Distributors should plan channel strategies around the leading segment and the fastest-growing use cases. Aligning inventory with the share leaders is expected to improve margin capture.
- Pricing strategy should reflect the value of documented outcomes rather than raw capacity.
How does the E-Commerce Enterprise Resource Planning Integration Market break down by segment?
The E-Commerce Enterprise Resource Planning Integration Market is segmented by Integration Solution, Business Function, End-use Industry, Organization Type, and Deployment Model. By Integration Solution, the market includes iPaaS Integration Platform, Middleware Integration, Data Synchronization Platform, and Workflow Automation Suite. By Business Function, the market is divided into Order Management Integration, Financial Management, Customer Relationship Management, and Supply Chain Management. By End-use Industry, the market covers Retail & E-commerce, Manufacturing, Healthcare, and Food & Beverage. By Organization Type, the market includes Large Enterprises, Small & Medium Enterprises, System Integrators, and Logistics Providers. By Deployment Model, the market is segmented into Cloud-based Integration, Hybrid Deployment, AI-enabled Integration Platform, and Low-code Integration Platform.
Why does iPaaS Integration Platform lead Integration Solution?
iPaaS Integration Platform is projected to account for 40.0% share in 2026.
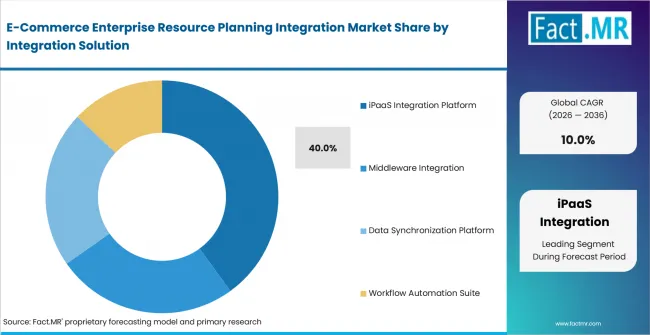
E Commerce Enterprise Resource Planning Integration Market Analysis By Integration Solution | Source: Fact.MR
iPaaS Integration Platform holds significant share within Integration Solution. Its position reflects customer interest in proven, well-documented options that fit the primary use case. The segment benefits from a clearer value proposition and stronger integration with core workflows. Other options continue to serve buyers that give price and availability more weight than feature depth.
Why does Order Management Integration lead Business Function?
Order Management Integration is projected to account for 42.0% share in 2026.
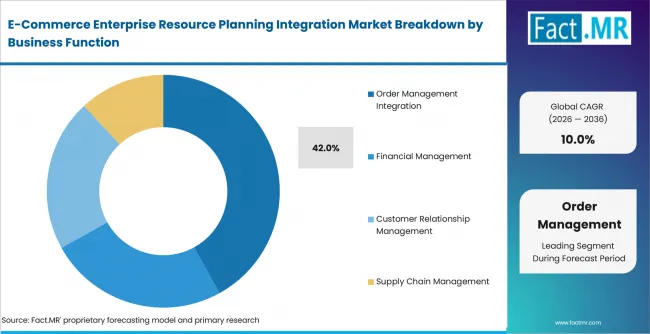
E Commerce Enterprise Resource Planning Integration Market Analysis By Business Function | Source: Fact.MR
Order Management Integration holds significant share within Business Function. OECD research notes that major e-commerce providers have improved delivery times by optimising logistics and supply-chain fulfilment processes. This strengthens demand for systems that connect order capture with warehouse and delivery operations instead of managing each activity separately. These operational links give Order Management Integration a broader and more immediate use case than integrations focused on a single supporting function. Financial Management, Customer Relationship Management and Supply Chain Management integrations remain important, but order integration often acts as the transaction-level connection through which inventory, fulfilment and financial workflows are initiated.
Why does Retail & E-commerce lead End-use Industry?
Retail & E-commerce is projected to account for 45.0% share in 2026.
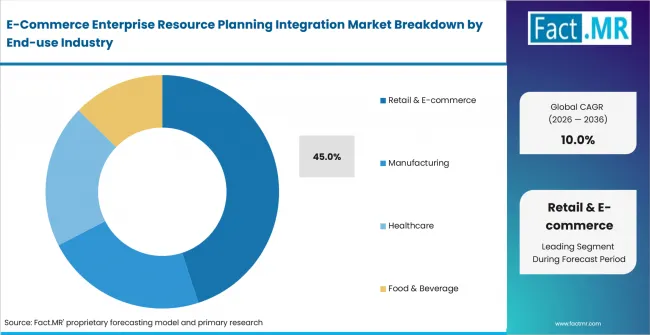
E Commerce Enterprise Resource Planning Integration Market Analysis By End Use Industry | Source: Fact.MR
Retail & E-commerce continues to gain traction. Its position reflects customer interest in proven, well-documented options that fit the primary use case. The segment benefits from a clearer value proposition and stronger integration with core workflows. Other options continue to serve buyers that give price and availability more weight than feature depth. The commercial scale of online retail strengthens this requirement. The U.S. Census Bureau estimated seasonally adjusted retail e-commerce sales of USD 326.7 billion during the first quarter of 2026. Online sales increased 9.7% year over year, compared with 4.0% growth in total retail sales, and represented 16.8% of all U.S. retail sales during the quarter. This means that a growing share of retail transactions originates through digital channels and must be connected with companies’ operational systems. A similar pattern is visible in Europe. Eurostat reports that e-sales generated 19.49% of total enterprise turnover in the European Union in 2024. These figures show that e-commerce has become a material revenue channel rather than a peripheral sales activity for many businesses.
Why does Large Enterprises lead Organization Type?
Large Enterprises is projected to account for 41.0% share in 2026.
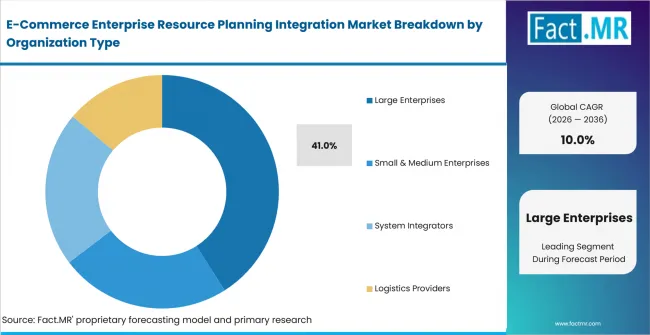
E Commerce Enterprise Resource Planning Integration Market Analysis By Organization Type | Source: Fact.MR
Large enterprises are better placed to absorb the cost and organizational effort involved in integration projects. Such implementations may require data mapping, legacy-system connections, cybersecurity reviews and employee training. The OECD notes that firms generally adopt ERP systems after reaching a scale that enables them to manage the complexity and considerable financial, time and reskilling requirements involved. It also identifies business-process integration through ERP, CRM and supply-chain systems as one of the largest digital adoption gaps between SMEs and larger firms.
Why does Cloud-based Integration lead Deployment Model?
Cloud-based Integration is projected to account for 43.0% share in 2026.
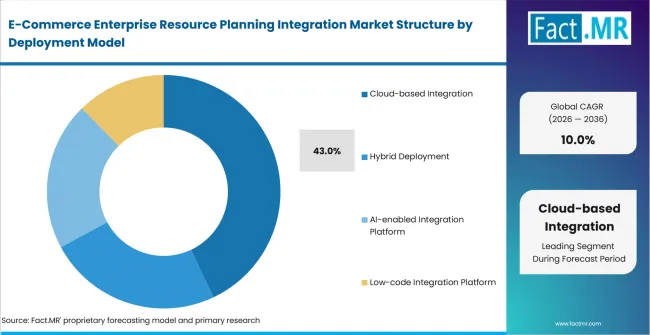
E Commerce Enterprise Resource Planning Integration Market Analysis By Deployment Model | Source: Fact.MR
The wider adoption of cloud services provides a large installed base for this deployment model. Eurostat reported that 52.74% of EU enterprises used paid cloud computing services in 2025, up from 45.32% in 2023. Among large enterprises, cloud adoption reached 84.67% in 2025. These figures indicate that cloud platforms have become part of the normal technology environment in which many ERP and e-commerce integrations are deployed.
What is accelerating E-Commerce Enterprise Resource Planning Integration Market adoption, and what is holding it back?
Drivers Impact Analysis
| Driver | (~) % Impact on CAGR | Geographic Relevance | Impact Timeline |
|---|---|---|---|
| Adoption and integration | +1.6% | Global | Short term (≤ 2 years) |
| Regulatory and compliance support | +1.4% | USA, Germany and UK | Short term (≤ 2 years) |
| Channel and access expansion | +1.1% | Global | Medium term (2–4 years) |
| Clear specification and documentation | +0.9% | USA, UK and Canada | Medium term (2–4 years) |
| Cost and efficiency gains | +0.6% | Global | Long term (≥ 4 years) |
Source: Fact.MR analysis. Updated Aug 6, 2026
Opportunity Impact Analysis
| Opportunity | (~) % Impact on CAGR | Geographic Relevance | Impact Timeline |
|---|---|---|---|
| Emerging application expansion | +1.0% | Global | Medium term (2–4 years) |
| Premium and specialist positioning | +0.8% | USA, UK and Germany | Medium term (2–4 years) |
| Channel and partner expansion | +0.7% | Global | Long term (≥ 4 years) |
| Standards and compliance alignment | +0.5% | USA, Canada and Singapore | Long term (≥ 4 years) |
Source: Fact.MR analysis. Updated Aug 6, 2026
Restraints Impact Analysis
| Restraint | (~) % Impact on CAGR | Geographic Relevance | Impact Timeline |
|---|---|---|---|
| Cost and complexity | -1.1% | Global | Short term (≤ 2 years) |
| Specification and compliance checks | -0.9% | USA, UK and Germany | Short term (≤ 2 years) |
| Substitution by lower-cost alternatives | -0.7% | Import-dependent markets | Medium term (2–4 years) |
| Supply chain and pricing pressure | -0.5% | Global | Long term (≥ 4 years) |
Source: Fact.MR analysis. Updated Aug 6, 2026
Which countries are scaling the E-Commerce Enterprise Resource Planning Integration Market fastest?
- U.S. retail e-commerce sales reached USD 326.7 billion in the first quarter of 2026 and represented 16.8% of total retail sales. The scale of digitally generated transactions increases demand for ERP integration that can synchronize orders with inventory, fulfilment and financial records across large retail operations.
- Around 83% of German internet users purchased goods or services online, indicating that digital commerce is firmly embedded in the country’s retail environment. Retailers therefore require dependable ERP connections that maintain data accuracy across storefronts, inventory systems and fulfilment operations.
- Online spending in Great Britain increased 9.8% in the three months to May 2026 compared with the same period a year earlier. Rising transaction volumes increase pressure on retailers to automate order transfers and maintain consistent inventory information across digital and physical channels.
- The ONDC network had processed more than 326 million cumulative orders by October 2025, including 18.2 million orders during that month. The expansion of interoperable commerce across different buyer and seller applications creates a direct requirement for integration layers that can connect orders with ERP, catalogue and fulfilment systems.
- Canadian retail e-commerce sales reached CAD 4.0 billion in November 2025 and represented 5.7% of total retail trade. Although the online share is lower than in some larger markets, the recurring transaction base supports investment in cloud integrations that improve order processing and inventory visibility.
- Singapore’s digital economy accounted for 18.6% of GDP, showing the depth of digital technology use across the wider business environment. This supports demand for cloud-based ERP integration among retailers and regional enterprises managing transactions across several Southeast Asian markets.
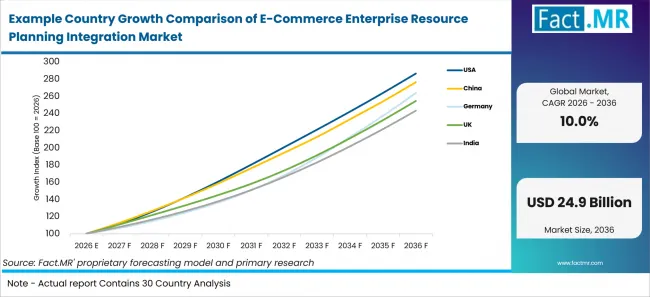
Example Country Growth Comparison Of E Commerce Enterprise Resource Planning Integration Market | Source: Fact.MR
| Country | CAGR (2026-2036) |
|---|---|
| USA | 11.1% |
| Germany | 10.2% |
| UK | 9.8% |
| Canada | 8.9% |
| Singapore | 8.4% |
Source: Fact.MR analysis. Updated Aug 6, 2026
What is driving USA’s growth through 2036?
The USA is forecast to expand at an 11.1% CAGR from 2026 to 2036.
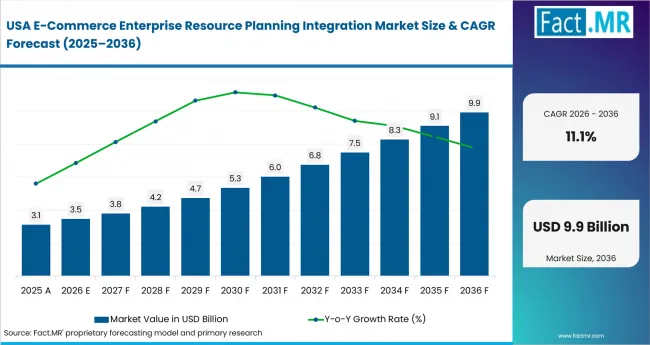
E Commerce Enterprise Resource Planning Integration Market Country Value Analysis | Source: Fact.MR
U.S. retail e-commerce sales reached USD 326.7 billion in the first quarter of 2026 and accounted for 16.8% of total retail sales. The scale of online transactions is increasing demand for integrations that connect storefronts with ERP-based order processing, inventory allocation and financial reporting.
What is driving Germany’s growth through 2036?
Germany is forecast to expand at a 10.2% CAGR from 2026 to 2036.
Around 83% of German internet users purchased products or services online in 2024, showing the established role of e-commerce in the country’s retail environment. Retailers require dependable ERP integration to maintain accurate product, order and fulfilment information while meeting strict enterprise data requirements.
What is driving the UK’s growth through 2036?
The UK is forecast to expand at a 9.8% CAGR from 2026 to 2036.
Online spending in Great Britain increased 11.7% year over year during the second quarter of 2026, while June online sales rose 14.4% from the previous year. Rising digital order volumes are encouraging retailers to automate the movement of transaction data between storefronts, stock systems and ERP platforms.
What is driving India’s growth through 2036?
India is forecast to expand at a 9.3% CAGR from 2026 to 2036.
ONDC had processed more than 326 million cumulative orders by October 2025, including 18.2 million orders during that month. The expansion of interoperable commerce creates demand for integration platforms that connect different buyer applications and seller systems with ERP, catalogue and fulfilment workflows.
What is driving Canada’s growth through 2036?
Canada is forecast to expand at an 8.9% CAGR from 2026 to 2036.
Canadian retail e-commerce sales reached CAD 4.0 billion in November 2025 and represented 5.7% of total retail trade. This recurring online transaction base supports investment in cloud-based integration that improves inventory visibility and coordinates orders across digital and physical channels.
What is driving Singapore’s growth through 2036?
Singapore is forecast to expand at an 8.4% CAGR from 2026 to 2036.
Singapore’s digital economy reached SGD 128.1 billion and accounted for 18.6% of GDP in 2024. The depth of digital adoption supports demand for secure cloud integration among retailers and regional enterprises connecting e-commerce operations with ERP systems across Southeast Asian markets.
Who leads the E-Commerce Enterprise Resource Planning Integration Market?
Oracle Corporation, SAP SE and Microsoft Corporation are among the leading providers due to their established ERP ecosystems and ability to connect commerce operations with finance, inventory and supply-chain workflows. IBM, Boomi and Informatica compete through enterprise integration, automation and data-management capabilities, while MuleSoft, Workato, Celigo and Jitterbit focus more directly on API-led integration, iPaaS and prebuilt application connectors.
Competition is shaped by the breadth of supported applications, connector reliability and the ability to manage data across cloud and legacy environments. Providers with established ERP platforms can embed integration within a broader enterprise software relationship, while specialist vendors compete through faster deployment, lower-code configuration and deeper connectivity with e-commerce platforms.
The addressable requirement is supported by widespread enterprise adoption of the underlying technologies. In 2025, 46.45% of EU enterprises used ERP software, with adoption reaching 88.71% among large enterprises. Paid cloud services were used by 52.74% of EU enterprises during the same year, creating a substantial installed base for cloud-based ERP and e-commerce integration.
The competitive landscape remains fragmented because integration requirements vary by ERP environment, storefront architecture and business scale. Larger software companies are positioned to serve complex multinational deployments, while specialist integration providers can gain traction where buyers need prebuilt connectors, shorter implementation cycles or support for mixed application environments.
Which companies are the key providers?
Key companies include Oracle Corporation; SAP SE; Microsoft Corporation; International Business Machines Corporation; Boomi, LP; Celigo, Inc.; Informatica Inc.; MuleSoft, LLC; Workato, Inc.; and Jitterbit, Inc.
- Oracle Corporation
- SAP SE
- Microsoft Corporation
- International Business Machines Corporation
- Boomi, LP
- Celigo, Inc.
- Informatica Inc.
- MuleSoft, LLC
- Workato, Inc.
- Jitterbit, Inc.
Bibliography
- Eurostat. (2026). Cloud computing: Statistics on the use by enterprises. European Commission.
- Eurostat. (2026). Digital economy and society statistics: Enterprises. European Commission.
- Eurostat. (2026). E-business integration. European Commission.
- Infocomm Media Development Authority. (2025). Singapore’s digital economy at 18.6% of GDP. Government of Singapore.
- National Bureau of Statistics of China. (2026). Total retail sales of consumer goods in December 2025. Government of China.
- National Institute of Standards and Technology. (2011). The NIST definition of cloud computing. U.S. Department of Commerce.
- OECD. (2021). The digital transformation of SMEs. OECD Publishing.
- U.S. Census Bureau. (2026). Quarterly retail e-commerce sales: First quarter 2026. U.S. Department of Commerce.
- Wikipedia. (2026). Enterprise resource planning. Wikimedia Foundation.
This Report Answers
- The report provides strategic intelligence on the E-Commerce Enterprise Resource Planning Integration Market across the covered segments that shape product positioning.
- Segment analysis covers the leading segments and their share within the 2026 market.
- Country outlook evaluates the highest-growth markets and the wider regional comparison.
- Competitive analysis profiles the named providers in the e-commerce enterprise resource planning integration space.
- Application assessment covers the covered use cases with attention to channel access and product fit.
What does the E-Commerce Enterprise Resource Planning Integration Market cover?
E-Commerce Enterprise Resource Planning Integration products are sold across the covered segments and applications.
The E-Commerce Enterprise Resource Planning Integration Market covers products identified by the covered segments and sold in the assessed formats for the leading applications. The assessment includes the leading segments, the segment share leaders and the countries that drive the fastest growth. Other uses are included when the product is sold within the assessed scope.
What is included in the scope?
E-Commerce Enterprise Resource Planning Integration is assessed across the covered segments and regions with company coverage tied to named providers.
The scope includes the covered segments and regions. Coverage spans the leading segments and the application base that drives demand. The country view includes the listed countries and their projected growth, while the regional view covers North America, Latin America, Europe, East Asia, South Asia and Pacific, and the Middle East and Africa. Company coverage includes the named providers listed in the competitive section.
What is excluded from the scope?
Products outside the assessed segments and applications are outside this market.
The scope excludes products that do not sit within the covered segments. General alternatives and adjacent categories are outside the scope unless sold within the assessed definition. Related services and supporting equipment that are not directly tied to the covered product are excluded, keeping the market sizing consistent with the stated definition.
How Was the Analysis Built?
The analysis draws on 120+ sources and 35+ company portfolios. It covers 25+ countries and more than 20 industry interviews.
- Primary Research: Primary research includes discussions with manufacturers and service providers. It covers distributors, end users and subject-matter experts. These conversations examine purchasing priorities and channel requirements.
- Desk Research: Desk research covers official statistics and regulatory publications. It reviews company literature, trade data and standards. Every source used in the analysis is documented in the bibliography.
- Market Sizing and Forecasting: Market estimates combine historical performance with demand indicators. The model reviews pricing trends, segment shares and country-level growth. Barriers to market expansion are tested before the forecast is finalized.
- Data Validation and Update Cycle: Findings are validated by comparing interviews with public data and company activity. Regular updates review launches, sourcing shifts and changes in customer adoption.
Segmentation
What is the report's scope and coverage?
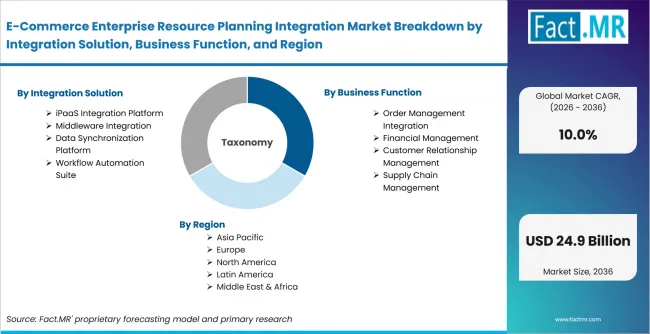
E Commerce Enterprise Resource Planning Integration Market Breakdown By Integration Solution, Business Function, And Region | Source: Fact.MR
| Attribute | Details |
|---|---|
| Quantitative Units | USD billion in 2026 to USD billion by 2036 at a CAGR |
| Market Definition | E-Commerce Enterprise Resource Planning Integration products sold across the covered segments and applications |
| Segments Covered | Integration Solution; Business Function; End-use Industry; Organization Type; Deployment Model |
| Regions Covered | North America; Latin America; Europe; East Asia; South Asia and Pacific; Middle East and Africa |
| Countries Covered | USA; China; Germany; UK; India; Canada; Singapore |
| Key Companies Profiled | Oracle Corporation; SAP SE; Microsoft Corporation; International Business Machines Corporation; Boomi, LP; and others |
| Forecast Period | 2026 to 2036 |
| Approach | Hybrid top-down and bottom-up approach using segment demand; share; country growth; channel visibility; pricing; and company portfolio review |
Source: Fact.MR analysis. Updated Aug 6, 2026
How is the market segmented?
-
By Integration Solution:
- iPaaS Integration Platform
- Pre-built ERP Connectors
- API-based Integration
- Middleware Integration
- Enterprise Service Bus
- Event-driven Middleware
- Data Synchronization Platform
- Master Data Synchronization
- Product Catalog Synchronization
- Workflow Automation Suite
- Order Workflow Automation
- Exception Handling Automation
- iPaaS Integration Platform
-
By Business Function:
- Order Management Integration
- Real-time Order Sync
- Inventory Synchronization
- Financial Management
- Accounts Receivable
- Tax & Compliance
- Customer Relationship Management
- Customer Data Sync
- Loyalty Program Integration
- Supply Chain Management
- Warehouse Management
- Demand Forecasting
- Order Management Integration
-
By End-use Industry:
- Retail & E-commerce
- Online Retailers
- Marketplace Operators
- Manufacturing
- Consumer Goods
- Wholesale & Distribution
- Healthcare
- Pharma E-commerce
- Medical Supplies
- Food & Beverage
- Food Retail
- Beverage Distribution
- Retail & E-commerce
-
By Organization Type:
- Large Enterprises
- Global Enterprises
- Mid-sized Enterprises
- Small & Medium Enterprises
- Distributors
- Channel Partners
- System Integrators
- Managed Service Providers
- Digital Commerce Providers
- Logistics Providers
- Fulfillment Partners
- 3PL Providers
- Large Enterprises
-
By Deployment Model:
- Cloud-based Integration
- Multi-tenant SaaS
- API-driven Architecture
- Hybrid Deployment
- Private Cloud
- On-premise Deployment
- AI-enabled Integration Platform
- Intelligent Workflow Engine
- Automated API Gateway
- Low-code Integration Platform
- Visual Workflow Builder
- Event Processing Engine
- Cloud-based Integration
-
By Region:
- North America
- Latin America
- Western Europe
- Eastern Europe
- East Asia
- South Asia and Pacific
- Middle East & Africa
Frequently Asked Questions
Which Integration Solution leads the market?
Which Business Function leads the market?
Which End-use Industry leads the market?
Which Organization Type leads the market?
Which Deployment Model leads the market?
Which country records the highest listed CAGR?
What is the primary driver in this market?
What is the main restraint?
Which companies are included in the market assessment?
Who worked on this report


Preview the report firsthand - request a free sample
Free SampleGet the brochure for pricing and purchase details
Download PDF