- Market Value (2025): USD 21.4 Bn
- Estimated Value (2026): USD 58.6 Bn
- Forecast Value (2036): USD 23.4 Bn
- CAGR (2026-2036): 9.6%
What is the FTTH Equipment Market forecast to be worth by 2036?
USD 23.4 billion in 2026 to USD 58.6 billion by 2036 at a 9.6% CAGR.
- FTTH equipment revenue totalled USD 21.4 billion in 2025, with most spending tied to new fibre access builds and copper replacement programmes.
- By 2036 the market will reach USD 58.6 billion, up from USD 23.4 billion in 2026, as operators move from gigabit to multi-gigabit PON and extend fibre into rural and multifamily premises.
- A 9.6% CAGR for 2026 to 2036 reflects two layers of demand: first-time fibre connections in still-building markets and electronics refresh on networks already in service.
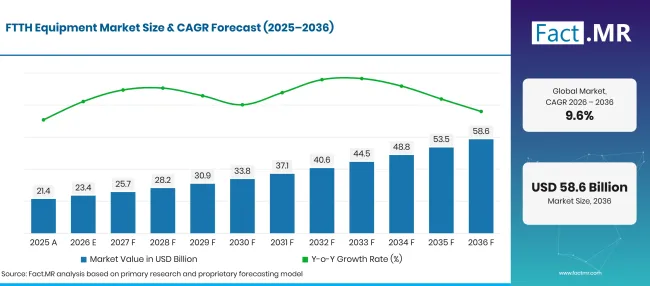
Ftth Equipment Market Forecast Global | Source: Fact.MR
| Year | Basis | Market Value (USD billion) |
|---|---|---|
| 2025 | Actual | 21.4 |
| 2026 | Estimate | 23.4 |
| 2036 | Forecast | 58.6 |
| CAGR 2026 to 2036 | Forecast period | 9.6% |
Source: Fact.MR analysis. Updated Nov 6, 2026
What are the defining numbers behind FTTH Equipment Market growth?
The 2026 to 2036 period adds USD 35.2 billion in new value, led by optical line terminals, telecom operator networks and buried fibre plant.
- Demand Drivers in the Market
- Fixed networks still carry most of the world’s data. Fixed broadband traffic reached 7.3 zettabytes in 2025, up from 6.2 zettabytes a year earlier and almost five times mobile traffic, which keeps operators adding access capacity at the home end [1].
- Subscriber growth continues alongside traffic growth. Global fixed broadband penetration stands at 20 subscriptions per 100 inhabitants, with subscriptions growing by an average of 5.2% a year over five years [2]. Each new line on fibre needs a terminal, a splitter port and a drop cable.
- Copper retirement is pushing operators to finish fibre footprints. Fibre to the premises coverage across the EU reached 74.1% by mid-2025, which leaves a sizeable share of homes still to be passed and a growing installed base ready for upgrades [3].
- Public funding programmes for unserved areas widen the addressable base for access electronics and passive plant, since rural builds need more cable and outdoor enclosures per subscriber than dense urban builds.
- Key Segments Analyzed
- By Component: Optical Line Terminal will hold 38.2% share in 2026, since every PON port served from the central office or cabinet starts at an OLT line card.
- By Application: Telecommunication will account for 42.6% of 2026 value, as carrier access networks absorb most equipment bought for fibre rollouts.
- By Deployment Type: Underground will capture 61.4% in 2026, reflecting operator preference for ducted and buried routes that limit storm damage and repair visits.
- By End-User: Internet Service Providers will command 48.3% of 2026 revenue, given that their build budgets fund most OLT, terminal and cable purchases.
- Analyst Opinion at Fact.MR
- Shambhu Nath Jha, Principal Consultant at Fact.MR, states, “Fibre access buying is moving from a pure footprint race to a capacity race, and suppliers will need to serve both at once. Operators that already pass most homes will spend on 10G and 25G PON line cards and new home terminals, while late builders will still buy large volumes of cable, closures and splitters. Vendors that make field installation faster and keep older and newer PON on one chassis will win the most repeat orders through 2036.”
- Strategic Implications
- OLT and ONT manufacturers should design line cards and terminals that run GPON, XGS-PON and 25G PON on the same fibre, so operators can upgrade subscribers one by one.
- Cable and connectivity suppliers should expand pre-connectorised drop and terminal ranges, because labour time is now the costliest line in many fibre builds.
- Internet service providers should plan equipment purchases around permit and civil works calendars, ordering long-lead electronics before trenching starts.
- Investors should track grant awards and wholesale access rules country by country, as these set the timing of equipment orders more than headline coverage targets.
Germany leads the country set at 11.0%, since its fibre base remains small next to its copper and cable lines and the catch-up is now in full swing. Brazil follows at 10.1%, a gap of 0.9 points explained by a fibre market that is already well along and driven by thousands of regional providers. The United States, at 9.1%, trails Brazil by 1.0 point as federal grant money reaches rural areas only after long permit cycles. A 0.9-point step separates it from the United Kingdom at 8.2%, where full fibre already reaches most homes and the work shifts to take-up. Japan closes the set at 7.2%, 1.0 point lower, as near-universal coverage leaves upgrades as the main source of demand.
How does the FTTH Equipment Market break down by segment?
Optical Line Terminal will lead Component at 38.2%; Telecommunication will head Application at 42.6%; Underground will hold Deployment Type at 61.4%; Internet Service Providers will lead End-User at 48.3% in 2026.
Which Component leads?
Optical Line Terminal takes 38.2% of 2026 sales.
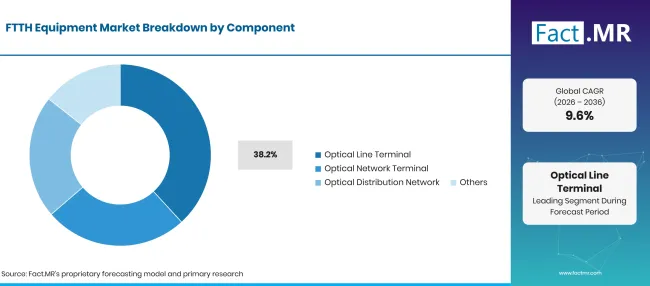
Ftth Equipment Market Breakdown Component | Source: Fact.MR
| Component | Share (2026) |
|---|---|
| Optical Line Terminal (Leading segment) | 38.2% |
| Other segments combined | 61.8%* |
| Total | 100.0% |
Source: Fact.MR analysis. Updated Nov 6, 2026
The OLT is the one active box every PON depends on: it sets the speed tier, manages each splitter tree and links the access network to the operator’s aggregation layer. When an operator lifts its service tier from 1 Gbps to multi-gigabit, the OLT line card is the first item it replaces, so this component sees both build and upgrade spending. Optical network terminals follow subscriber additions and router refresh cycles, and many now combine the fibre modem with Wi-Fi gateways covered in the Wi-Fi equipment study. Optical distribution network items, such as splitters, closures and patch panels, scale with homes passed. The Others group covers test gear, power units and network management tools.
What supports Telecommunication within Application?
Telecommunication represents 42.6% of 2026 revenue.
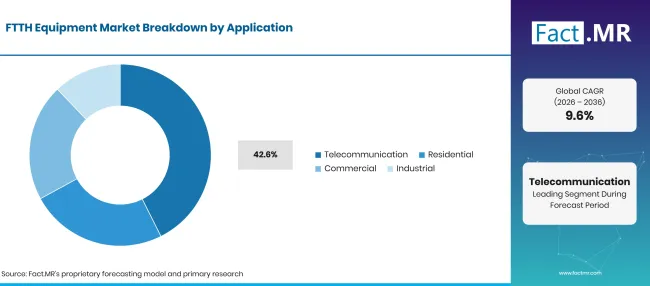
Ftth Equipment Market Breakdown Application | Source: Fact.MR
| Application | Share (2026) |
|---|---|
| Telecommunication (Leading segment) | 42.6% |
| Other segments combined | 57.4%* |
| Total | 100.0% |
Source: Fact.MR analysis. Updated Nov 6, 2026
Carrier access networks buy fibre equipment in large, multi-year frame contracts that span central office electronics, field cabinets and the home terminal. Fixed operators also use their fibre plant to feed mobile sites, which links FTTH spending to the 5G network equipment cycle and gives a single trench several revenue lines. Residential demand covers in-home fibre and multifamily wiring, while commercial users need symmetrical service for offices and retail sites. Industrial users take fibre for plant networks and campus links. These groups compete with 5G fixed wireless access in some rural areas, which shapes how far operators extend fibre.
What leads the Deployment Type segment?
Underground installations account for 61.4% of 2026 value.
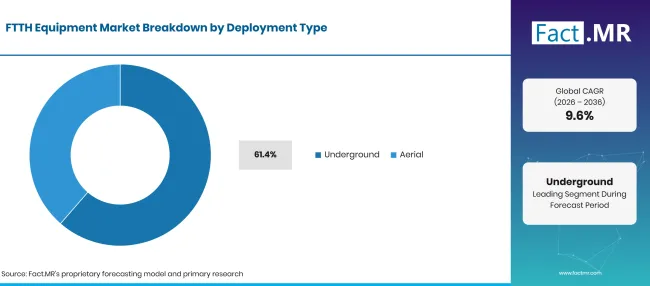
Ftth Equipment Market Breakdown Deployment Type | Source: Fact.MR
| Deployment Type | Share (2026) |
|---|---|
| Underground (Leading segment) | 61.4% |
| Other segments combined | 38.6%* |
| Total | 100.0% |
Source: Fact.MR analysis. Updated Nov 6, 2026
Buried and ducted fibre lasts longer and suffers fewer outages from storms, vehicles and tree falls, which lowers repair costs over the network’s life. The trade-off is time: in a 2026 review of federal broadband programmes, one participant told the U.S. Government Accountability Office that permits to install fiber could add 9 to 12 months to a project [4]. Aerial deployment on existing poles is quicker and cheaper per home, and it is common in rural areas and in markets with dense pole networks. Operators often mix both methods on a single build, and they choose cable designs and closures to suit each route. Many installers use the same crews and tools across the wire and cable trade for both.
What leads the End-User segment?
Internet Service Providers account for 48.3% of 2026 spending.
| End-User | Share (2026) |
|---|---|
| Internet Service Providers (Leading segment) | 48.3% |
| Other segments combined | 51.7%* |
| Total | 100.0% |
Source: Fact.MR analysis. Updated Nov 6, 2026
Service providers own the access network and buy most of its parts. In Brazil, small providers delivered 56.4% of fixed broadband services in mid-2025, according to Anatel data, which shows how much of the market regional operators now control [5]. Their purchases are frequent and price sensitive, and they favour vendors that ship from local stock. Enterprises buy fibre access for campuses, hotels and office parks, often linking it to gigabit Ethernet switching inside the building. Government bodies fund and sometimes own open-access networks in areas private operators skip. The Others group includes utilities and property developers that wire new housing schemes.
What is accelerating FTTH Equipment Market adoption, and what is holding it back?
Growing household traffic, copper switch-offs and public grants keep fibre builds moving across most regions. Construction remains the main brake: civil works, rights of way and permit waits raise the cost per home, and low-density areas often fail to pay back without subsidy. Labour shortages for splicing and installation slow schedules in several markets.
Drivers Impact Analysis
| DRIVER | (~) % IMPACT ON CAGR | GEOGRAPHIC RELEVANCE | IMPACT TIMELINE |
|---|---|---|---|
| Fibre coverage extending to more homes and businesses | +1.1% | Global | Medium term (2-4 years) |
| Household and business data use rising each year | +1.0% | Global | Short term (<=2 years) |
| Copper networks being retired in favour of fibre | +0.9% | North America, Western Europe, East Asia | Medium term (2-4 years) |
| Operator and ISP capital spending on access networks | +0.8% | Global | Medium term (2-4 years) |
| Public broadband programmes for unserved areas | +0.6% | Global | Long term (>=4 years) |
Source: Fact.MR analysis. Updated Nov 6, 2026
Opportunity Impact Analysis
| OPPORTUNITY | (~) % IMPACT ON CAGR | GEOGRAPHIC RELEVANCE | IMPACT TIMELINE |
|---|---|---|---|
| Fibre builds in rural and underserved areas | +0.7% | Latin America, South Asia & Pacific, Middle East & Africa | Long term (>=4 years) |
| Upgrades to 10G, 25G and 50G PON | +0.6% | Global | Medium term (2-4 years) |
| Refresh of older GPON networks | +0.6% | North America, Western Europe, East Asia | Medium term (2-4 years) |
| Fibre for enterprises and multifamily buildings | +0.5% | Global | Long term (>=4 years) |
Source: Fact.MR analysis. Updated Nov 6, 2026
Restraints Impact Analysis
| RESTRAINT | (~) % IMPACT ON CAGR | GEOGRAPHIC RELEVANCE | IMPACT TIMELINE |
|---|---|---|---|
| High upfront cost of fibre construction and equipment | -0.6% | Global | Short term (<=2 years) |
| Civil works cost for underground deployment | -0.5% | Global | Medium term (2-4 years) |
| Rights of way and local permit delays | -0.4% | Global | Medium term (2-4 years) |
| Weak returns in low-density areas | -0.3% | Rural and remote markets | Long term (>=4 years) |
Source: Fact.MR analysis. Updated Nov 6, 2026
Which countries are scaling the FTTH Equipment Market through 2036?
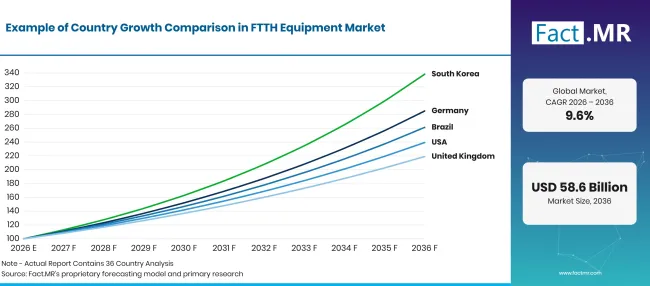
Factmr Ftth Equipment Market Growth Index | Source: Fact.MR
| Country | CAGR (2026 to 2036) |
|---|---|
| Germany | 11.0% |
| Brazil | 10.1% |
| United States | 9.1% |
| United Kingdom | 8.2% |
| Japan | 7.2% |
Source: Fact.MR analysis. Updated Nov 6, 2026
What is driving FTTH equipment adoption in Germany?
11.0% CAGR, driven by a late but fast fibre catch-up.
Germany is still early in fibre take-up, which leaves room for heavy equipment buying. The Bundesnetzagentur counted 6.4 million active FTTH and FTTB connections at the end of 2025, up from 5.3 million a year earlier, lifting fibre to 16.5% of active fixed broadband lines [6]. Telecom companies invested about EUR 15.3 billion in fixed assets in 2025, and a large gap between homes connected and homes active points to more terminal sales as users switch.
How is Brazil’s FTTH equipment market evolving?
10.1% CAGR, backed by thousands of regional providers.
Brazil’s fibre market grew from the bottom up. Anatel counted 11,951 authorized fixed broadband providers in mid-2025, plus more than 10,000 smaller firms operating without a formal licence [5]. These operators buy OLTs, terminals and drop cable in small, frequent batches, and they compete with each other on speed tiers, which keeps upgrade orders coming.
What is strengthening the United States market?
9.1% CAGR, helped by federal grant programmes.
Federal funding is the main swing factor for U.S. fibre equipment demand. The U.S. Government Accountability Office reports that NTIA oversees the over USD 42 billion Broadband Equity, Access, and Deployment program, and that all nine federal programmes it reviewed had begun distributing funds by February 2026 [4]. The 2025 policy change removed BEAD’s fibre preference, so fibre vendors now compete with fixed wireless and satellite for part of the rural money.
Why is the United Kingdom investing in FTTH equipment?
8.2% CAGR, reflecting a shift from build to take-up.
Full fibre reached 24.9 million UK homes, or 82% of the total, in January 2026, and full fibre connections rose to 12.4 million [7]. Northern Ireland is furthest ahead, with 95% residential full fibre availability [8]. With most homes passed, equipment demand moves from cable and closures toward home terminals, drop connections and capacity upgrades on alternative networks.
What is shaping Japan’s market growth?
7.2% CAGR, owing to an upgrade-led cycle.
Japan built its fibre base early. The Ministry of Internal Affairs and Communications reports about 40.90 million FTTH subscriptions at the end of December 2024, and fibre broadband coverage of 99.84% of households at the end of FY2022 [9]. With so few homes left to pass, operators spend mainly on 10G services, replacement terminals and higher-capacity OLTs in existing exchanges.
Who leads the FTTH Equipment Market?
The market splits into three groups that compete on different terms. Full-line access vendors, Huawei, Nokia and ZTE, sell OLTs, home terminals and management software as one package, and they win large carrier tenders on port density and upgrade paths. Nokia launched two mass-market 25G PON home terminals in March 2025 that work on the same networks as GPON and 10G PON [10].\
A second group, ADTRAN and Calix, focuses on regional and mid-sized operators, where software, subscriber apps and support count as much as hardware; in October 2026 Calix extended its SmartMDU offer for providers serving multifamily buildings [11]. Passive plant specialists Corning, Sumitomo Electric and Prysmian supply fibre, cable, splicers and connectivity. Corning’s Evolv pre-connectorised terminals won an FTTH Innovation Award in 2025 for cutting installation labour [12]. Through 2036, the edge will go to suppliers that cut labour per home and let operators upgrade speeds without new fibre.
Which companies are the key providers?
Key companies in the FTTH Equipment Market include Huawei, Nokia, ZTE, ADTRAN, Calix, Corning, Sumitomo Electric and Prysmian.
- Huawei
- Nokia
- ZTE
- ADTRAN
- Calix
- Corning
- Sumitomo Electric
- Prysmian
Bibliography
- [1] International Telecommunication Union. (2025, October 15). Facts and Figures 2025: Internet traffic.
- [2] International Telecommunication Union. (2025, October 15). 5G subscriptions already represent more than one-third of all mobile broadband subscriptions.
- [3] European Commission. (2026, June 17). Digital Decade 2026: Connectivity Coverage in Europe 2025 report.
- [4] U.S. Government Accountability Office. (2026, August 31). Broadband Deployment: Agencies Should Take Steps to Better Target Underserved Areas and Consider Sustainability (GAO-26-107725).
- [5] Agência Gov, via Anatel. (2025, July 14). 56% da banda larga no Brasil é fornecida por pequenas operadoras, segundo Anatel.
- [6] Bundesnetzagentur. (2026, June 5). Telecoms Annual Report 2025.
- [7] Ofcom. (2026, May 13). Connected Nations update: Spring 2026.
- [8] Ofcom. (2025, November 19). Nations report 2025.
- [9] Ministry of Internal Affairs and Communications. (2025, July 8). 2025 White Paper on Information and Communications in Japan, Part II.
- [10] Nokia. (2025, March 18). Nokia unveils two mass-market 25G PON residential fiber ONTs, making large-scale multi-gig and 10G+ viable and affordable.
- [11] Calix. (2026, October 20). Calix Expands SmartMDU to Help Providers Win Multifamily Markets With Resident Experiences That Earn up to 95% Satisfaction.
- [12] Corning. (2025, March 31). Corning Optical Communications Wins FTTH Innovation Award 2025.
This Report Answers
- How is FTTH equipment revenue split between optical line terminals, home terminals and distribution network items?
- Why do telecom carriers account for the biggest block of application spending?
- What keeps underground installation ahead of aerial deployment despite higher civil costs?
- How are internet service providers, from national carriers to regional firms, buying fibre equipment?
- Which supplier groups compete for OLT, terminal and passive plant orders, and on what terms?
- How do Germany, Brazil, the United States, the United Kingdom and Japan differ in build stage and growth?
What does the FTTH Equipment Market cover?
This study tracks the equipment that carries a fibre connection from the operator’s exchange or cabinet to the subscriber’s premises. Active items include optical line terminals and optical network terminals; passive items include feeder and drop cable, splitters, closures, connectors and patch panels.
Value is measured at manufacturer selling price for new equipment shipped in each year. Revenue is split by component, application, deployment type, end user and region, and five countries are assessed in detail.
What is included in the scope?
OLT chassis, line cards and compact outdoor OLTs used for GPON, XGS-PON, 25G PON and 50G PON service.
Optical network terminals and fibre home gateways that operators install for residential and business subscribers.Optical distribution items: feeder, distribution and drop cable, splitters, fibre closures, terminals and pre-connectorised assemblies.Supporting equipment sold for FTTH networks, such as splicers, test gear and element management software bundled with access hardware.
What is excluded from the scope?
Broadband subscription fees, wholesale access charges and other service revenue.
Civil works, trenching, pole rental and installation labour sold as separate contracts.Core, metro and long-haul optical transport equipment, and submarine cable systems.Consumer routers, mesh Wi-Fi kits and Ethernet cards sold at retail without an FTTH service contract.
How Was the Analysis Built?
The analysis draws on 120+ sources, 35+ company portfolios, 25+ countries, and more than 20 industry interviews.
- Primary Research: Primary research includes discussions with manufacturers, service providers, technology developers, distributors, end users, and subject-matter experts. These conversations examine purchasing priorities, product adoption, operational challenges, approval requirements, competitive positioning, and the factors that influence wider market acceptance.
- Desk Research: Desk research covers government statistics, regulatory publications, company filings, trade data, technical studies, industry associations, standards, public policy, and other authoritative sources. Every source used in the analysis is documented in the bibliography.
- Market Sizing and Forecasting: Market estimates combine historical performance, demand indicators, pricing and volume trends, segment shares, company participation, country-level growth, adoption patterns, investment activity, and barriers to market expansion.
- Data Validation and Update Cycle: Findings are validated by comparing primary interviews with public data, company activity, regulatory changes, trade patterns, and industry developments. Regular updates review new product launches, capacity changes, partnerships, approvals, and shifts in commercial adoption.
Segmentation
What is the report’s scope and coverage?
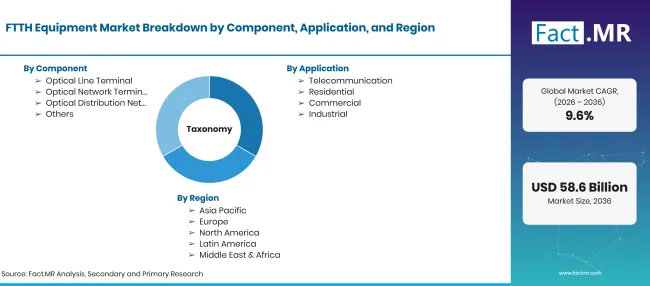
Ftth Equipment Market Taxonomy | Source: Fact.MR
| Attribute | Details |
|---|---|
| Quantitative Units | USD billion |
| Market Definition | Active and passive equipment used to build and run fibre-to-the-home access networks, from the optical line terminal to the subscriber terminal. |
| Component | Optical Line Terminal; Optical Network Terminal; Optical Distribution Network; Others |
| Application | Telecommunication; Residential; Commercial; Industrial |
| Deployment Type | Underground; Aerial |
| End-User | Internet Service Providers; Enterprises; Government; Others |
| Regions Covered | North America; Latin America; Western Europe; Eastern Europe; East Asia; South Asia & Pacific; Middle East & Africa |
| Countries Covered | Germany; Brazil; United States; United Kingdom; Japan |
| Companies Profiled | Huawei; Nokia; ZTE; ADTRAN; Calix; Corning; Sumitomo Electric; Prysmian |
| Forecast Period | 2026 to 2036 |
| Approach | Bottom-up count of homes passed, connected and upgraded by country, priced by component and checked against operator capital spending and vendor portfolios. |
Source: Fact.MR analysis. Updated Nov 6, 2026
How is the market segmented?
-
By Component
- Optical Line Terminal
- Optical Network Terminal
- Optical Distribution Network
- Others
-
By Application
- Telecommunication
- Residential
- Commercial
- Industrial
-
By Deployment Type
- Underground
- Aerial
-
By End-User
- Internet Service Providers
- Enterprises
- Government
- Others
-
By Region
- North America
- Latin America
- Western Europe
- Eastern Europe
- East Asia
- South Asia & Pacific
- Middle East & Africa
Frequently Asked Questions
How large is the FTTH equipment market in 2026?
What growth rate will the FTTH equipment market record?
Which component leads?
Which application leads?
Which deployment type leads?
Which end-user leads?
Which country will grow quickest?
Who are the main companies?
What holds the market back?
Who worked on this report


Preview the report firsthand - request a free sample
Free SampleGet the brochure for pricing and purchase details
Download PDF