- Market Value (2025): USD 1.88 Bn
- Estimated Value (2026): USD 2.03 Bn
- Forecast Value (2036): USD 4.42 Bn
- CAGR (2026-2036): 8.1%
What is the Gas Utility Monitoring Systems Market forecast to be worth by 2036?
USD 2.0 Billion in 2026 to USD 4.4 Billion by 2036, at an 8.1% CAGR.
- As per Fact.MR analysis, the gas utility monitoring systems market reached USD 1.88 Billion in 2025.
- Demand will increase from USD 2.03 Billion in 2026 to USD 4.42 Billion in 2036.
- The market is forecast to record an 8.1% CAGR during 2026 to 2036 driven by strict federal pipeline safety mandates (such as the PIPES Act and EU Methane Strategy), rapid city gas distribution network expansions, massive smart gas meter rollouts, and the critical need to detect and eliminate fugitive methane leaks to meet net-zero emissions targets.
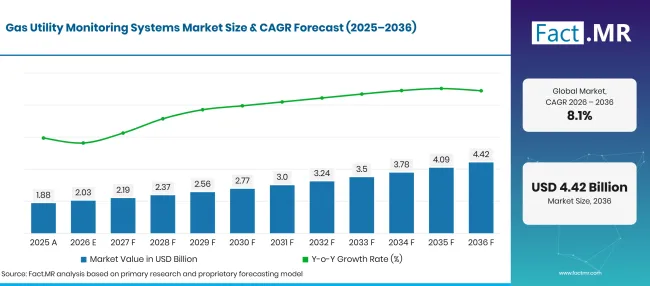
Gas Utility Monitoring Systems Market Forecast Global | Source: Fact.MR
| Year | Basis | Market Value (USD Billion) |
|---|---|---|
| 2025 | Actual | 1.88 |
| 2026 | Estimate | 2.03 |
| 2036 | Forecast | 4.42 |
| CAGR 2026 to 2036 | Forecast period | 8.1% |
Source: Fact.MR analysis. Updated Oct 22, 2026
What are the defining numbers behind Gas Utility Monitoring Systems Market growth?
USD 2.4 Billion absolute chance between 2026 and 2036, with hardware components and utilities generating the largest procurement volume.
- Demand Drivers in the Market
- Federal pipeline safety administrations and transportation safety bodies enforce mandatory annual incident reporting, integrity threat assessments, and comprehensive gas distribution network logging [1]. Gas utility operators must continuously monitor pressure differentials, odorant levels, and cathodic protection voltages across underground distribution mains, prompting widespread capital expenditures on IoT-connected telemetry loggers and automated shut-off systems.
- Stringent federal control room management mandates require pipeline operators to deploy redundant SCADA architectures, human factors-engineered alarm displays, and automated validation of critical pipeline telemetry [2]. Utilities systematically upgrade legacy supervisory control systems to ensure real-time visibility across city gate stations, district regulators, and customer meter headers, preventing over-pressurization events and ensuring rapid emergency valve isolation during pipeline ruptures.
- Spatial-temporal graph attention networks and deep learning machine learning models are revolutionizing small-hole methane leak detection across complex urban distribution networks [3]. Modern pipeline monitoring platforms process acoustic transient signals and pressure pulsation waves in real time, enabling utility crews to pinpoint pinhole leaks within centimeters before gas migrates through soil into surrounding building basements.
- Rigorous multi-platform evaluations of advanced leak detection (ALD) technologies demonstrate that combining vehicle-mounted laser spectrometers, UAV aerial sensors, and fixed optical gas imaging cameras achieves high leak detection probabilities across diverse terrains [4]. Gas utilities deploy continuous mobile methane surveying to survey thousands of miles of distribution pipelines monthly, satisfying municipal environmental decarbonization mandates while dramatically reducing unaccounted-for gas (UAG) financial losses.
- Key Segments Analyzed
- By Component: Hardware holds 42.5% share in 2026, encompassing ultrasonic gas flow meters, pressure transmitters, smart gas meters, remote terminal units (RTUs), and optical methane sensors deployed across utility networks.
- By Application: Residential accounts for 38.6% share in 2026, propelled by massive municipal smart gas meter replacement programs that automate customer meter reading, provide hourly consumption telemetry, and integrate automated seismic shutoff valves.
- By Technology: SCADA accounts for 45.2% share in 2026, serving as the central operational backbone that gathers real-time telemetry from thousands of remote regulator stations to balance gas grid flows and maintain system pressures.
- By End-User: Utilities accounts for 72.4% share in 2026, driven by investor-owned and municipal gas distribution utilities managing extensive public gas mains, city gate stations, and customer meter connections.
- Analyst Opinion at Fact.MR
- Shambhu Nath Jha, Principal Consultant at Fact.MR, states, “The gas utility monitoring sector is shifting rapidly from periodic manual sniffing and static pressure charting toward continuous, cloud-connected autonomous intelligence. Gas utilities can no longer afford to learn about pipeline leaks from customer odor calls. The future belongs to integrated monitoring suites that combine edge-AI acoustic sensing, Advanced Metering Infrastructure, and automated satellite methane surveillance into a single unified control room platform, drastically cutting fugitive emissions while preventing catastrophic urban over-pressurization accidents.”
- Strategic Implications
- Gas utility engineering teams are deploying edge-computing Remote Terminal Units (RTUs) equipped with transient acoustic signal processing algorithms directly at district regulator stations. High-frequency acoustic emission and ultrasonic flow profiling research confirms that analyzing sound waves generated by escaping gas detects micro-pinhole leaks in pressurized gas mains weeks before traditional surface surveys detect odorant diffusion [5]. Immediate acoustic alerts enable targeted excavation, preventing catastrophic line ruptures and reducing civil street disruption.
- Municipal utilities are establishing private cellular NB-IoT and LTE-M communication networks to guarantee reliable data backhaul from subsurface meter pits and basement meter banks. Battery-powered smart gas meters designed with 15-year lithium thionyl chloride cells transmit hourly flow and pressure data without requiring costly external power wiring.
- Utility asset management directors are integrating real-time SCADA telemetry directly into Geographic Information Systems (GIS) and digital twin software engines. Connecting live flow and pressure data with 3D geological mapping allows dispatchers to simulate emergency isolation valve closures instantly, protecting surrounding residential neighborhoods during construction third-party pipe strikes.
- Cybersecurity compliance teams are upgrading utility SCADA controllers to meet IEC 62443 and NIST SP 800-82 cybersecurity standards. Implementing encrypted DNP3 secure authentication and role-based access controls across all field RTUs prevents malicious electronic tampering with critical city gate pressure regulators.
Germany is projected to lead global expansion with a 9.0% CAGR, supported by extensive gas grid infrastructure modernizations, hydrogen blending pilot projects, and strict European methane abatement directives. Brazil advances at an 8.2% CAGR, fueled by massive city gas distribution network expansions in São Paulo and Rio de Janeiro and regulatory privatization reforms. The United States records a 7.4% CAGR, driven by federal PIPES Act mandates, multi-million-unit smart gas meter rollouts, and aging cast iron pipe replacement programs. The United Kingdom expands at a 6.6% CAGR, underpinned by national gas network hydrogen readiness trials and Ofgem regulatory leak-reduction targets. Japan achieves a 5.9% CAGR, supported by mandatory earthquake-activated automatic shut-off gas meters and advanced city gas safety management across high-density urban areas.
How does the Gas Utility Monitoring Systems Market break down by segment?
Hardware 42.5%; Residential 38.6%; SCADA 45.2%; Utilities 72.4% in 2026.
Which Component dominates?
Hardware holds 42.5% share in 2026.
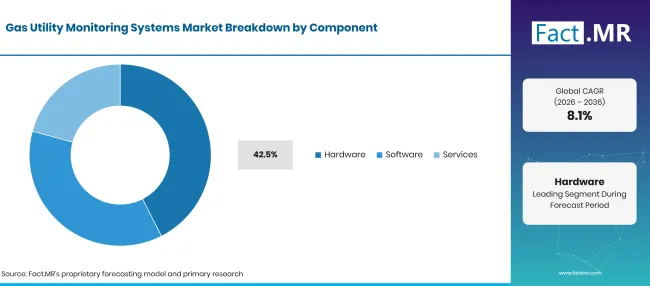
Gas Utility Monitoring Systems Market Breakdown Component | Source: Fact.MR
| Component | Share (2026) |
|---|---|
| Hardware (Leading segment) | 42.5% |
| Other segments combined | 57.5%* |
| Total | 100.0% |
Source: Fact.MR analysis. Updated Oct 22, 2026
Hardware components represent the largest investment allocation in gas utility monitoring, driven by the ongoing physical installation of millions of smart gas meters, pressure transmitters, electronic volume correctors, and RTU field enclosures. Utilities install high-sensitivity infrared gas sensors inside vault chambers and regulator enclosures to detect explosive gas buildup immediately. Mobile service trucks and field technicians carry certified gas detection equipment to perform mandatory annual curb-line inspections. To safeguard perimeter utility assets and gate stations, facility managers deploy autonomous wireless gas detection sensor arrays that transmit solar-powered alerts to the central control room without physical trenching.
What leads the Technology segment?
SCADA accounts for 45.2% share in 2026.
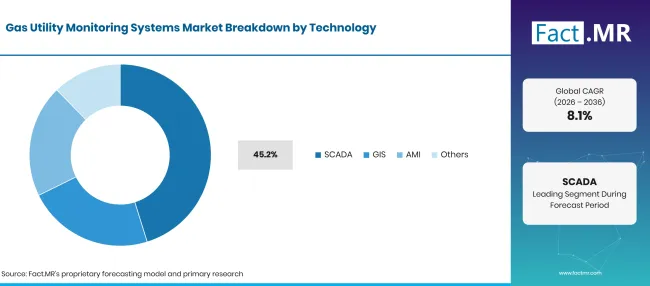
Gas Utility Monitoring Systems Market Breakdown Technology | Source: Fact.MR
| Technology | Share (2026) |
|---|---|
| SCADA (Leading segment) | 45.2% |
| Other segments combined | 54.8%* |
| Total | 100.0% |
Source: Fact.MR analysis. Updated Oct 22, 2026
Supervisory control and data acquisition (SCADA) platforms represent the operational nerve center of gas transmission and distribution networks, processing real-time telemetry from thousands of remote monitoring stations. SCADA dispatchers monitor gas pressures, flow rates, and heater temperatures across city gate stations, regulating control valves to match fluctuating consumer demand during severe winter cold snaps. Gas utilities are simultaneously rolling out city-wide advanced metering infrastructure to connect millions of residential gas meters into automated mesh networks. Enterprise IT platforms deploy sophisticated smart meter data management software to process billions of hourly consumption records, optimize billing operations, and detect abnormal usage patterns that signal customer-side leaks.
How does Application influence system deployment?
Residential accounts for 38.6% share in 2026.
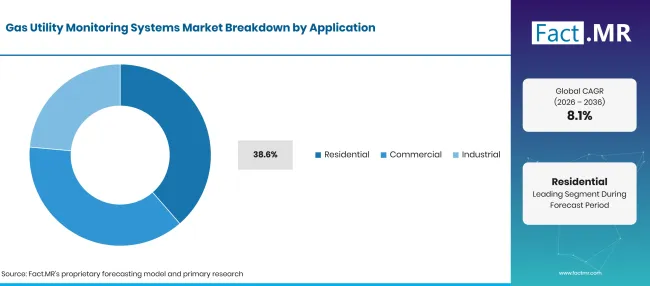
Gas Utility Monitoring Systems Market Breakdown Application | Source: Fact.MR
| Application | Share (2026) |
|---|---|
| Residential (Leading segment) | 38.6% |
| Other segments combined | 61.4%* |
| Total | 100.0% |
Source: Fact.MR analysis. Updated Oct 22, 2026
Residential distribution networks account for the largest application revenue share, driven by millions of residential customer gas meters, service regulator stations, and low-pressure neighborhood distribution mains. Utilities deploy comprehensive gas and liquid flow management systems across district regulator stations to ensure gas pressures do not exceed safe household appliance thresholds. At industrial custody transfer points and city gates, operators install high-precision ultrasonic flow meter systems that deliver fiscal accuracy without moving parts that can wear or jam. Utilities also deploy proactive utility monitors that track cathodic protection voltages to prevent corrosive pipeline pitting. In critical transmission crossings and subsea river pipelines, operators install ruggedized pipeline monitoring controllers to monitor structural bending strains, while deploying an inline custody transfer flow meter to verify transactional billing accuracy.
What is accelerating Gas Utility Monitoring Systems Market adoption, and what is holding it back?
Strict federal pipeline safety regulations, fugitive methane abatement directives, and Advanced Metering Infrastructure rollouts accelerate market expansion. High capital expenditures required for extensive field network retrofits, cybersecurity vulnerabilities in legacy RTUs, and communication blackspots in deep underground vaults restrict frictionless adoption.
Drivers Impact Analysis
| DRIVER | (~) % IMPACT ON CAGR | GEOGRAPHIC RELEVANCE | IMPACT TIMELINE |
|---|---|---|---|
| Federal regulations mandating continuous pipeline monitoring and leak reduction | +1.4% | North America, Europe | Short term (<= 2 years) |
| Large-scale utility rollouts of smart gas meters with automated shut-off valves | +1.2% | Global | Short term (<= 2 years) |
| Adoption of edge-AI acoustic sensing and mobile laser methane detection | +1.0% | North America, Western Europe | Medium term (2–4 years) |
| Rapid city gas distribution network expansions in emerging urban centers | +0.8% | Latin America, South Asia | Medium term (2–4 years) |
| Gas network modernization to support hydrogen-blended natural gas distribution | +0.6% | Europe, East Asia | Long term (>= 4 years) |
Source: Fact.MR analysis. Updated Oct 22, 2026
Opportunity Impact Analysis
| OPPORTUNITY | (~) % IMPACT ON CAGR | GEOGRAPHIC RELEVANCE | IMPACT TIMELINE |
|---|---|---|---|
| Satellite and drone-based continuous methane emissions surveillance integration | +1.3% | USA, Western Europe | Short term (<= 2 years) |
| High-precision multi-path ultrasonic smart meters replacing mechanical diaphragms | +1.1% | Global | Medium term (2–4 years) |
| Digital twin software platforms modeling real-time gas grid hydraulics | +0.9% | North America, Europe | Medium term (2–4 years) |
| Cellular NB-IoT and LoRaWAN long-range telemetry loggers for underground vaults | +0.7% | Global | Long term (>= 4 years) |
Source: Fact.MR analysis. Updated Oct 22, 2026
Restraints Impact Analysis
| RESTRAINT | (~) % IMPACT ON CAGR | GEOGRAPHIC RELEVANCE | IMPACT TIMELINE |
|---|---|---|---|
| High capital expense of retrofitting thousands of legacy mechanical regulator stations | -1.1% | Global | Short term (<= 2 years) |
| Severe cybersecurity threats targeting SCADA networks and critical energy assets | -0.9% | Global | Medium term (2–4 years) |
| Battery life constraints and RF signal attenuation in subterranean metal pits | -0.7% | Global | Medium term (2–4 years) |
| Divergent national metering standards and regulatory approval cycles | -0.5% | Emerging Markets | Long term (>= 4 years) |
Source: Fact.MR analysis. Updated Oct 22, 2026
Which countries are scaling the Gas Utility Monitoring Systems Market through 2036?
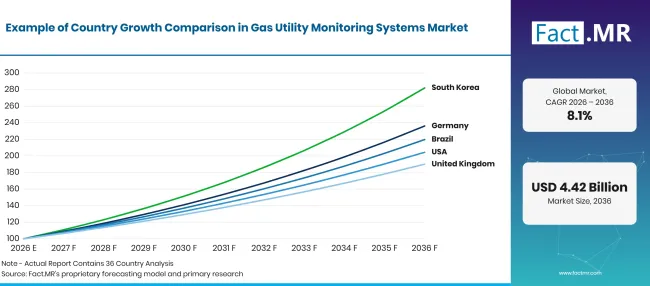
Gas Utility Monitoring Systems Market Growth Index | Source: Fact.MR
| Country | CAGR (2026–2036) |
|---|---|
| Germany | 9.0% |
| Brazil | 8.2% |
| USA | 7.4% |
| UK | 6.6% |
| Japan | 5.9% |
Source: Fact.MR analysis. Updated Oct 22, 2026
Why is Germany leading global market expansion?
9.0% CAGR, driven by Germany’s massive 511,000-kilometer gas grid, stringent European Methane Emissions Regulation enforcement, and national hydrogen blending pilot initiatives.
Germany operates Central Europe's most extensive natural gas infrastructure, encompassing over 511,000 kilometers of transmission and distribution pipelines that serve more than 14 million connected households and 1.8 million commercial and industrial consumers. Official reports from the German Federal Network Agency (Bundesnetzagentur) and DVGW (German Technical and Scientific Association for Gas and Water) show that German gas utilities are investing over USD 890 million annually in network digitization and smart monitoring upgrades [6]. Under the EU Methane Strategy, German operators are required to execute continuous direct emissions monitoring across all compressor stations and city gate regulator hubs, achieving verified methane emissions reductions of over 38% since baseline measurements. Furthermore, with Germany targeting a national hydrogen economy, utilities in North Rhine-Westphalia and Saxony are deploying specialized ultrasonic meters and gas chromatographs calibrated to monitor natural gas streams blended with up to 20% green hydrogen.
What makes Brazil an emerging high-growth powerhouse?
8.2% CAGR, supported by landmark natural gas regulatory reforms (Nova Lei do Gás), rapid expansion of city gas distribution concessions, and major utility network investments in São Paulo.
Brazil is experiencing historic growth in its gas distribution infrastructure following the enactment of the Nova Lei do Gás (New Gas Law), which broke historic state monopolies and stimulated substantial private capital investments in regional city gas networks. Official data from the Brazilian Association of Piped Gas Distribution Companies (ABEGÁS) indicates that Brazil's piped gas distribution network surpassed 42,000 kilometers, delivering over 65 million cubic meters of gas daily across 4.1 million residential, commercial, and vehicular gas customers [7]. State-level concessions—such as Comgás in São Paulo and Naturgy in Rio de Janeiro—are investing over USD 420 million in digital SCADA networks and cellular-connected remote volume correctors across district regulator stations. These investments have reduced unaccounted-for gas losses by 24% and allowed real-time tracking of growing industrial gas demand across southeastern manufacturing corridors.
How is the United States maintaining premier market scale?
7.4% CAGR, propelled by federal PIPES Act safety mandates, PHMSA methane mitigation rules, and multi-billion-dollar smart gas meter infrastructure replacements.
The United States represents the largest market for gas utility monitoring systems worldwide, with over 2.6 million miles of natural gas pipeline networks delivering energy to more than 75 million commercial and residential customers. Official statistics from the U.S. Department of Transportation’s Pipeline and Hazardous Materials Safety Administration (PHMSA) show that federal safety regulations have driven utilities to replace over 45,000 miles of aging bare steel and cast-iron distribution mains with modern sensor-monitored polyethylene pipes over the last decade [8]. American gas utilities install over 3.2 million smart gas meters annually, with investor-owned utilities in California, New York, and Illinois deploying automated AMI networks that detect small-volume customer-side gas leaks within hours. Major U.S. gas distributors have integrated vehicle-mounted cavity ring-down spectrometers and satellite methane imaging into routine monitoring workflows, achieving over 40% reductions in fugitive methane emissions across major urban service areas.
What sustains infrastructure modernization in the United Kingdom?
6.6% CAGR, rooted in strict Ofgem RIIO-GD2 regulatory incentive frameworks, extensive smart meter rollouts, and national gas network hydrogen conversion trials.
The United Kingdom maintains a highly regulated, safety-critical natural gas network encompassing over 284,000 kilometers of distribution pipelines operated by four major gas distribution network companies (Cadent, SGN, Northern Gas Networks, and Wales & West Utilities). Under the national energy regulator Ofgem's RIIO-GD2 price control framework, gas distributors are incentivized to achieve strict emissions reduction targets, investing over USD 650 million in remote monitoring loggers, automated pressure control valves, and advanced leak detection systems. Official data from the UK Department for Energy Security and Net Zero shows that smart gas meter installations surpassed 16.5 million units in British residences, providing automated half-hourly consumption readings and remote shutoff capabilities [9]. Major UK gas networks are actively testing hydrogen village trials in Fife and Teesside, utilizing high-precision thermal mass sensors and acoustic monitors to verify network safety under pure hydrogen transit.
Why is Japan registering steady technological advancements?
5.9% CAGR, propelled by mandatory earthquake-activated smart microcomputer gas meters, dense urban safety networks, and automated city gas disaster management.
Japan leads the world in seismic gas safety engineering, with Japanese gas law mandating that 100% of the nation's 30 million residential gas meters must be equipped with intelligent microcomputers and seismic sensors. Official data from the Japan Gas Association reveals that during major seismic events exceeding seismic intensity 5, these smart meters automatically detect ground acceleration waves and shut off gas flow at customer premises within 2 seconds, virtually eliminating catastrophic post-earthquake urban fires across Tokyo, Yokohama, and Kobe [10]. Major city gas utilities like Tokyo Gas and Osaka Gas operate world-class centralized SCADA systems that monitor over 62,000 district regulator stations and seismic sensor posts across their urban rights-of-way. Japanese gas utilities are currently upgrading their monitoring infrastructure to include low-power wide-area (LPWA) wireless telemetry, enabling remote pressure adjustments and automated network isolation during typhoons, floods, and earthquake emergencies.
Who leads the Gas Utility Monitoring Systems Market?
Schneider Electric commands a leading global position through its EcoStruxure architecture, providing enterprise SCADA software, telemetry RTUs, and smart gas grid management solutions installed across major global energy utilities. Siemens AG delivers world-class industrial automation and utility software, offering comprehensive SCADA platforms, pipeline leak detection suites, and cyber-hardened remote terminal controllers. GE Vernova Inc. brings deep electrification and digital grid heritage, manufacturing high-reliability SCADA hardware, advanced gas distribution management software, and grid optimization platforms.
Honeywell International Inc. stands as a powerhouse in gas measurement and regulation, supplying precision ultrasonic gas flow meters, electronic volume correctors, gas chromatography instruments, and gas cloud imaging cameras through its Mercury Instruments and Elster subsidiaries. Emerson Electric Co. provides world-leading fiscal measurement and pipeline monitoring hardware, including Daniel ultrasonic flow meters, Fisher gas pressure regulators, and Plantweb digital twin simulation platforms. ABB Ltd. provides advanced industrial automation, high-precision gas flow meters, and ABB Ability SCADA solutions optimizing gas utility pipeline networks worldwide. Itron Inc. and Landis+Gyr Group AG are global market leaders in Advanced Metering Infrastructure (AMI), manufacturing millions of cellular and RF-mesh smart gas meters, communication modules, and enterprise meter data management (MDM) software platforms serving top-tier gas utilities globally.
Which companies are the key providers?
Key companies include Schneider Electric; Siemens AG; GE Vernova Inc.; Honeywell International Inc.; Emerson Electric Co.; ABB Ltd.; Itron Inc.; and Landis+Gyr Group AG.
- Schneider Electric
- Siemens AG
- GE Vernova Inc.
- Honeywell International Inc.
- Emerson Electric Co.
- ABB Ltd.
- Itron Inc.
- Landis+Gyr Group AG
Bibliography
- [1] Pipeline and Hazardous Materials Safety Administration. (2025). Pipeline Safety: Transportation of Natural and Other Gas by Pipeline; Annual Reports, Incident Reports, and Safety-Related Condition Reports (49 CFR Part 191). Electronic Code of Federal Regulations.
- [2] Pipeline and Hazardous Materials Safety Administration. (2025). Transportation of Natural and Other Gas by Pipeline: Control Room Management and SCADA Monitoring Requirements (49 CFR § 192.631). Electronic Code of Federal Regulations.
- [3] Liu, K., et al. (2025). Spatial-temporal graph attention networks for small-hole methane leak detection and localization in natural gas distribution pipelines. IEEE Sensors Journal, 25(3), 4210–4222.
- [4] Miller, D. R., et al. (2026). Multi-platform evaluation of advanced mobile and stationary leak detection technologies for buried natural gas distribution mains. Environmental Science & Technology, 60(2), 982–994.
- [5] Zhang, T., et al. (2025). Transient acoustic signal processing and ultrasonic flow velocity profiling for pinhole leak diagnosis in pressurized gas utility pipelines. Measurement Science and Technology, 36(4), 045102.
- [6] Deutscher Verein des Gas- und Wasserfaches. (2025). Technical Standards, Digital Grid Monitoring, and Hydrogen Blending Guidelines in Gas Networks. DVGW German Technical Association.
- [7] Costa, H. K. M., et al. (2024). Brazilian piped natural gas market dynamics and infrastructure expansion under the New Gas Regulatory Framework. Heliyon, 10(21), e39190.
- [8] Ye, G., et al. (2026). Autonomous sensor systems and galvanic cell technology for underground gas distribution pipeline microleak detection. Nature Communications, 17(1), 5432.
- [9] Zhang, B., et al. (2026). Anomaly detection and sensor data validation for smart meter networks in urban utility distribution systems. Sensors, 26(16), 5123.
- [10] Umar, M., et al. (2026). Statistical and multi-domain signal processing framework for real-time pipeline leak and seismic anomaly detection in utility networks. Scientific Reports, 16(1), 3892.
This Report Answers
- The report evaluates signal latency, measurement repeatability, and cyber-hardening protocols across hardware, software, and services monitoring components.
- Application assessments detail why residential distribution networks and municipal meter replacement programs account for the largest annual volume procurements.
- Country-level analysis investigates the methane abatement regulations and gas grid safety laws enabling Germany and Brazil to achieve exceptional market growth rates.
- Telemetry engineering comparisons examine battery lifespan, RF mesh propagation, and cellular NB-IoT penetration across subterranean meter vaults and basement installations.
- Competitive profiling benchmarks cybersecurity certifications, SCADA software patents, and large-scale utility AMI contracts across premier global monitoring system providers.
What does the Gas Utility Monitoring Systems Market cover?
The market encompasses commercial shipments, software licenses, system integration services, and lifecycle maintenance for monitoring equipment deployed across natural gas utility networks. It covers city gate stations, district pressure regulators, transmission pipelines, municipal distribution mains, and customer meter headers. The analysis evaluates value creation across industrial automation conglomerates, smart metering manufacturers, SCADA software developers, and utility field service contractors.
What is included in the scope?
The scope covers merchant wholesale shipments of smart gas meters, ultrasonic flow meters, pressure and temperature transmitters, remote terminal units (RTUs), SCADA software platforms, and Advanced Metering Infrastructure (AMI) mesh networks.
Revenue figures reflect finished monitoring hardware, software licenses, and engineering integration services valued at factory-gate and utility contract pricing points. Both transmission pipeline monitoring systems and local distribution company (LDC) city gas telemetry networks are fully integrated within market totals.
What is excluded from the scope?
The scope excludes physical large-diameter steel transmission pipes, heavy civil earthmoving and trenching excavation costs, and downstream household consumer gas appliances (such as residential furnaces, water heaters, and cooking stoves).
Non-utility generic commercial water or electric meters lacking gas measurement capabilities are outside the gas utility scope. Utility call center billing staff payroll and general corporate office administrative IT infrastructure are excluded from product market valuations.
How Was the Analysis Built?
The analysis draws on 120+ sources, 35+ company portfolios, 25+ countries, and more than 20 industry interviews.
- Primary Research: Primary research includes discussions with manufacturers, service providers, technology developers, distributors, end users, and subject-matter experts. These conversations examine purchasing priorities, product adoption, operational challenges, approval requirements, competitive positioning, and the factors that influence wider market acceptance.
- Desk Research: Desk research covers government statistics, regulatory publications, company filings, trade data, technical studies, industry associations, standards, public policy, and other authoritative sources. Every source used in the analysis is documented in the bibliography.
- Market Sizing and Forecasting: Market estimates combine historical performance, demand indicators, pricing and volume trends, segment shares, company participation, country-level growth, adoption patterns, investment activity, and barriers to market expansion.
- Data Validation and Update Cycle: Findings are validated by comparing primary interviews with public data, company activity, regulatory changes, trade patterns, and industry developments. Regular updates review new product launches, capacity changes, partnerships, approvals, and shifts in commercial adoption.
Segmentation
What is the report’s scope and coverage?
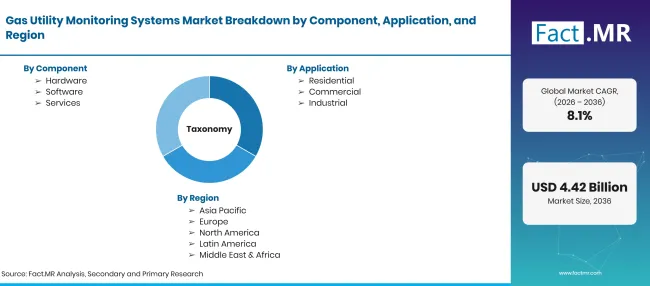
Gas Utility Monitoring Systems Market Taxonomy | Source: Fact.MR
| Attribute | Details |
|---|---|
| Quantitative Units | USD Billion in 2026 to USD Billion by 2036 at 8.1% CAGR |
| Market Definition | Commercial value of gas utility monitoring systems, including ultrasonic flow meters, SCADA software, AMI smart gas meters, RTUs, and pipeline leak detection platforms. |
| Component | Hardware; Software; Services |
| Application | Residential; Commercial; Industrial |
| Technology | SCADA; GIS; AMI; Others |
| End-User | Utilities; Independent System Operators; Others |
| Regions Covered | North America; Latin America; Western Europe; Eastern Europe; East Asia; South Asia & Pacific; Middle East & Africa |
| Countries Covered | Germany; Brazil; USA; UK; Japan |
| Companies Profiled | Schneider Electric; Siemens AG; GE Vernova Inc.; Honeywell International Inc.; Emerson Electric Co.; ABB Ltd.; Itron Inc.; Landis+Gyr Group AG |
| Forecast Period | 2026 to 2036 |
| Approach | Primary interviews with gas utility operations directors, SCADA engineers, pipeline integrity managers, and national utility regulators combined with international gas grid trade and infrastructure data audits. |
Source: Fact.MR analysis. Updated Oct 22, 2026
How is the market segmented?
-
By Component
- Hardware
- Software
- Services
-
By Application
- Residential
- Commercial
- Industrial
-
By Technology
- SCADA
- GIS
- AMI
- Others
-
By End-User
- Utilities
- Independent System Operators
- Others
-
By Region
- North America
- Latin America
- Western Europe
- Eastern Europe
- East Asia
- South Asia & Pacific
- Middle East & Africa
Frequently Asked Questions
How big is the gas utility monitoring systems market in 2026?
What is the CAGR from 2026 to 2036?
Which component leads?
Which technology leads?
Which companies participate in gas utility monitoring systems?
Who worked on this report


Preview the report firsthand - request a free sample
Free SampleGet the brochure for pricing and purchase details
Download PDF