- Market Value (2025): USD 3.0 Bn
- Estimated Value (2026): USD 3.4 Bn
- Forecast Value (2036): USD 12.5 Bn
- CAGR (2026-2036): 13.8%
What is the Proactive Utility Monitors Market forecast to be worth by 2036?
USD 3.4 billion in 2026 to USD 12.5 billion by 2036 at a 13.8% CAGR.
- The Proactive Utility Monitors Market reached USD 3.0 billion in 2025.
- Demand is projected to increase from USD 3.4 billion in 2026 to USD 12.5 billion by 2036.
- The market is forecast to record a 13.8% CAGR from 2026 to 2036 as electric utilities, grid operators and municipal networks move toward condition-based monitoring.
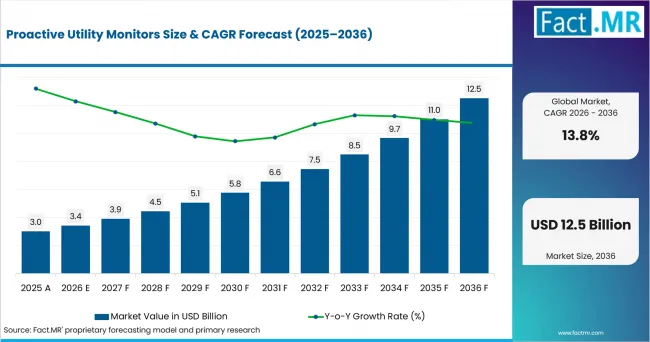
Proactive Utility Monitors Value Analysis | Source: Fact.MR
What are the defining numbers behind Proactive Utility Monitors Market growth?
An absolute opportunity of USD 9.1 billion is expected between 2026 and 2036.
- Demand Drivers in the Market
- Distribution utilities need earlier asset warnings as the U.S. Energy Information Administration projected U.S. electricity use to rise 1% in 2026. It projected a 3% increase for 2027 in the same January 2026 release.
- Transmission operators need better line visibility as the U.S. Department of Energy announced an approximately USD 1.9 billion SPARK funding opportunity for power-grid upgrades in March 2026.
- Utility maintenance teams need asset-health dashboards that connect transformer loading, alarms and repair timing into a single operating view.
- Key Segments Analyzed
- By Asset: Transformer monitoring is projected to hold 27.0% share in 2026 due to its role in protecting high-value equipment from overload stress.
- By Analytics: Predictive asset health is anticipated to account for 32.0% share in 2026 because utilities need condition scores that guide maintenance timing.
- By Utility Segment: Electric distribution is forecast to represent 46.0% share in 2026 owing to dense feeder networks and rising low-voltage visibility needs.
- By Deployment: Edge + cloud is expected to capture 37.0% share in 2026 as local sensing and remote analytics support faster operational response.
- Analyst Opinion at Fact.MR
- Shambhu Nath Jha, Principal Consultant at Fact.MR, states, “Utility monitoring is shifting from alarm display to asset decisions backed by operating data. Suppliers are expected to gain where they connect field readings with health scoring and outage response. Grid teams prefer tools that work during peak load events and still explain why each alert needs attention.”
- Strategic Implications
- Sensor vendors should document transformer, feeder and substation use cases separately so utilities can match devices to asset risk.
- Analytics providers should show how health scores change maintenance priority before promoting wider enterprise dashboards.
- System integrators should test SCADA and ADMS connectors early because data latency shapes operator confidence.
- Managed-service providers should package monitoring rules by utility size so municipal teams avoid heavy configuration work.
The USA is projected to record 15.1% CAGR through 2036, supported by power-demand growth and grid funding. France is anticipated to post 14.7% CAGR, driven by low-carbon generation scale and regulated transmission investment. Germany is estimated to hold 14.4% CAGR due to renewable capacity additions and faster line approvals. The UK is forecast to advance at 13.2% CAGR, shaped by clean-power targets and connection reform. Italy is expected to reach 10.3% CAGR, led by network investment and distribution-measurement regulation.
How does the Proactive Utility Monitors Market break down by segment?
Transformer monitoring leads Asset at 27.0%; Electric distribution leads Utility Segment at 46.0% share.
Which Asset segment dominates?
Transformer monitoring is expected to hold 27.0% share in 2026.
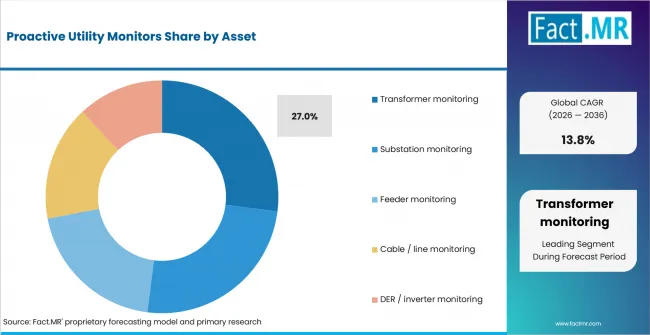
Proactive Utility Monitors Analysis By Asset | Source: Fact.MR
Transformer monitoring leads because transformers carry high replacement cost and direct service risk. Utilities use these monitors to track loading, temperature and insulation warning signs before faults move into customer-facing outages. Hitachi Energy launched HMAX Energy in March 2026 as an AI-powered suite for critical energy infrastructure, covering assets such as transformers, switchgear and substations.
What leads the Analytics segment?
Predictive asset health is projected to account for 32.0% share in 2026.
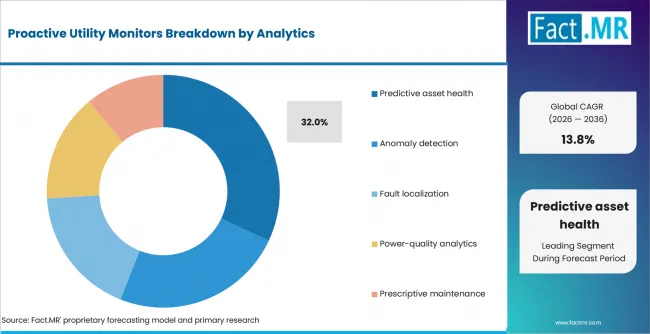
Proactive Utility Monitors Analysis By Analytics | Source: Fact.MR
Predictive asset health leads Analytics because utilities need a maintenance signal that operations teams and finance teams can understand. Condition scores turn sensor readings into a ranked view of asset risk. Schneider Electric announced the availability of its One Digital Grid Platform in November 2025, combining planning, operations and asset management in a modular, AI-enabled platform designed for utilities.
How does Utility Segment shape demand?
Electric distribution is anticipated to represent 46.0% share in 2026.
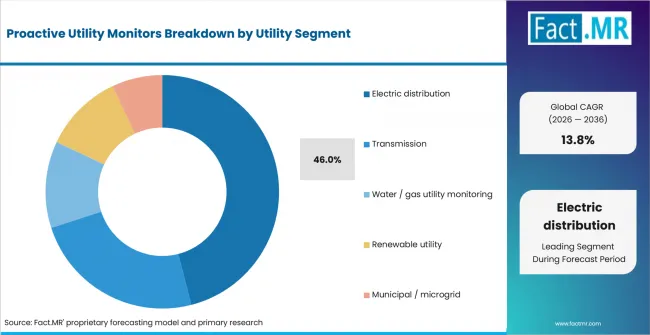
Proactive Utility Monitors Analysis By Utility Segment | Source: Fact.MR
Electric distribution leads because lower-voltage networks carry more DER, EV charging and weather-driven load variation near customers. Distribution utilities need feeder and transformer readings that help operators act before service quality deteriorates. Itron expanded AI-powered distributed intelligence with NVIDIA in March 2026 to process endpoint waveform data for local anomaly detection.
What supports Edge + cloud within Deployment?
Edge + cloud is forecast to capture 37.0% share in 2026.
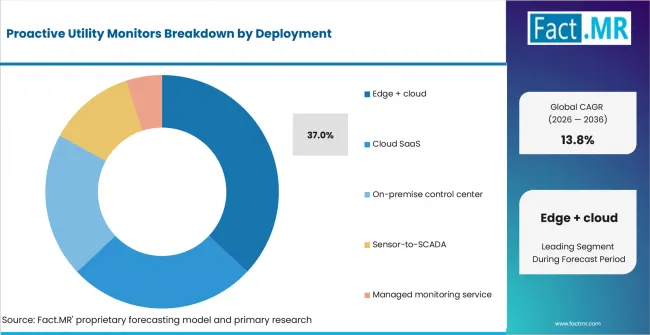
Proactive Utility Monitors Analysis By Deployment | Source: Fact.MR
Edge + cloud deployment leads because field devices need local decisions and control teams need central trend analysis. The model reduces dependence on a single control-center path during storms. GE Vernova launched GridBeats APS in February 2026 as a software-defined automation and protection system for substations.
What is accelerating Proactive Utility Monitors Market adoption, and what is holding it back?
Demand is expected to rise with grid visibility needs and predictive maintenance. Adoption is constrained by integration cost, cybersecurity reviews and rate-case timing.
Drivers Impact Analysis
| DRIVER | (~) % IMPACT ON CAGR | GEOGRAPHIC RELEVANCE | IMPACT TIMELINE |
|---|---|---|---|
| Transformer and substation condition visibility | +1.5% | Global | Short term (<= 2 years) |
| DER and inverter visibility at the distribution edge | +1.2% | USA, Germany, UK | Medium term (2-4 years) |
| Grid-modernization funding and line approvals | +1.0% | USA, France, Germany | Medium term (2-4 years) |
| Power-quality analytics for mixed-load networks | +0.8% | Europe, North America | Long term (>= 4 years) |
Source: Fact.MR analysis. Updated Sep 10, 2026
Opportunity Impact Analysis
| OPPORTUNITY | (~) % IMPACT ON CAGR | GEOGRAPHIC RELEVANCE | IMPACT TIMELINE |
|---|---|---|---|
| Edge + cloud monitoring services for distribution utilities | +1.2% | Global | Medium term (2-4 years) |
| Predictive asset health tied to maintenance planning | +0.9% | North America, Europe | Short term (<= 2 years) |
| Water and gas utility monitoring extensions | +0.7% | Europe, North America | Long term (>= 4 years) |
Source: Fact.MR analysis. Updated Sep 10, 2026
Restraints Impact Analysis
| RESTRAINT | (~) % IMPACT ON CAGR | GEOGRAPHIC RELEVANCE | IMPACT TIMELINE |
|---|---|---|---|
| SCADA, ADMS and cybersecurity integration cost | -0.6% | Global | Short term (<= 2 years) |
| Legacy sensor data quality and calibration gaps | -0.5% | Europe, North America | Medium term (2-4 years) |
| Utility budget approvals and rate-case timing | -0.4% | Global | Long term (>= 4 years) |
Source: Fact.MR analysis. Updated Sep 10, 2026
Which countries are scaling the Proactive Utility Monitors Market through 2036?
- The country comparison spans 4.8 percentage points and forms three practical growth bands across the forecast period.
- The USA remains 0.4 percentage point above France as data-center load and grid funding lift utility visibility needs.
- France remains 0.3 percentage point above Germany as regulated transmission investment increases monitoring demand.
- Germany remains 1.2 percentage points above the UK as renewable additions raise feeder and line-monitoring pressure.
- The UK remains 2.9 percentage points above Italy as connection reform creates near-term need for credible grid data.
- Italy closes the displayed range with network investment and measurement rules that support slower but steady adoption.
Comparable CAGRs create different entry conditions due to connection queues, rate regulation, asset age and renewable integration. Full report coverage includes North America, Latin America, Western Europe, Eastern Europe, East Asia, South Asia & Pacific, Middle East & Africa.
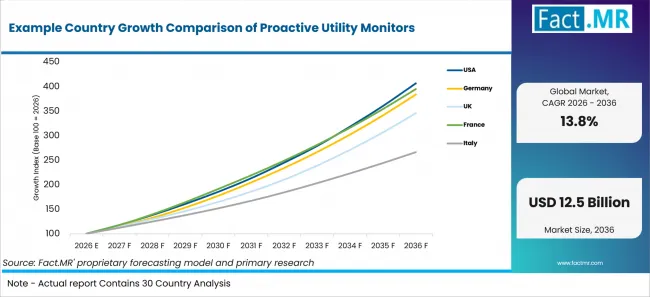
Example Country Growth Comparison Of Proactive Utility Monitors | Source: Fact.MR
| Country | CAGR |
|---|---|
| USA | 15.1% |
| France | 14.7% |
| Germany | 14.4% |
| UK | 13.2% |
| Italy | 10.3% |
Source: Fact.MR analysis. Updated Sep 10, 2026
What supports USA adoption?
15.1% CAGR, supported by data-center load visibility and grid funding.
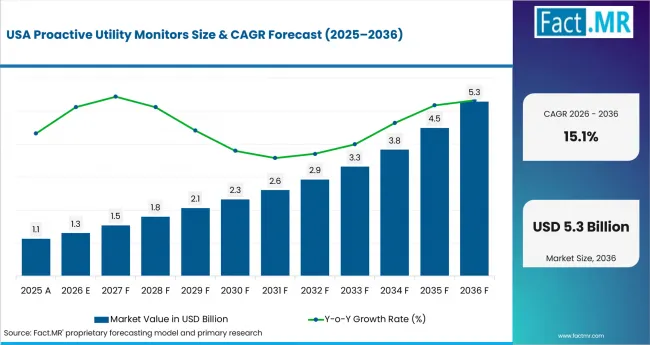
Proactive Utility Monitors Country Value Analysis | Source: Fact.MR
U.S. utilities are using monitor data to understand faster demand growth around data centers and industrial load pockets. In March 2026, the U.S. Energy Information Administration identified 196 companies operating data centers across Texas, Washington state and the Northern Virginia–Washington, DC region for three voluntary pilot field studies of data-center energy use. The pilot demonstrates EIA’s effort to obtain more granular information on data-center electricity use.
How is France scaling demand?
14.7% CAGR, driven by low-carbon generation scale and transmission investment.
France is adding monitoring demand where low-carbon generation and transmission expansion place more value on grid stability. RTE reported in February 2026 that France’s low-carbon electricity generation reached a record 521.1 TWh in 2025. In March 2026, CRE announced the approval of RTE’s 2026 investment programme, totaling EUR 4.24 billion.
What supports Germany adoption?
14.4% CAGR, supported by renewable capacity additions and line expansion.
Germany’s utility monitors are tied closely to renewable integration and approved grid work. Bundesnetzagentur reported in January 2026 that renewable capacity increased by nearly 21 GW in 2025. The agency also approved roughly 2,000 km of power lines in 2025.
What supports United Kingdom growth?
13.2% CAGR, backed by clean-power operations and connection reform.
UK demand is shaped by clean-power operation and the need to sort viable grid connections from speculative load requests. DESNZ reported in July 2026 that clean sources accounted for 73.3% of Great Britain electricity generation in 2025. The UK government stated in March 2026 that the transmission demand connection queue had grown 460% in the six months to June 2025.
How does Italy perform?
10.3% CAGR, led by transmission investment and measurement regulation.
Italy’s market develops through national grid investment and measured network performance. Terna’s 2025 Development Plan includes more than EUR 23 billion of investment for 2025-2034. Terna reported in March 2026 that February electricity demand increased 2.1% year over year.
Who leads the Proactive Utility Monitors Market?
Companies profiled in this report include Siemens, Schneider Electric, Hitachi Energy, GE Vernova, ABB and Itron, each with relevant utility-monitoring, grid-automation or asset-management offerings.
Siemens addresses distribution-grid monitoring through Electrification X and the SICAM Enhanced Grid Sensor. SICAM EGS can operate with SENTRON 3NA6 COM intelligent fuses in transformer stations and distribution cabinets to monitor feeder loads and improve low-voltage grid visibility.
Schneider Electric provides the One Digital Grid Platform, which is built on EcoStruxure ADMS, DERMS and ArcFM and integrates planning, operations and asset-management capabilities. Hitachi Energy provides HMAX Energy, an AI-powered suite for critical energy infrastructure that combines asset monitoring, data-driven planning, predictive analysis and preventive maintenance capabilities.
GE Vernova supports grid automation through its GridBeats portfolio, including GridBeats APS for substation automation and protection and GridBeats APM for transmission and distribution asset-performance management. Itron provides Grid Edge Intelligence enabled by distributed intelligence technology, combining intelligent devices, edge analytics, network capabilities, applications and software for distribution-grid visibility and control.
ABB provides Genix Asset Performance Management, which combines predictive analytics, condition monitoring and maintenance strategies for asset-intensive industries including power and water. Across these portfolios, suppliers offer capabilities for grid monitoring, asset analytics, cybersecurity, system integration and maintenance support.
Which companies are profiled?
Companies profiled include Siemens; Schneider Electric; Hitachi Energy; GE Vernova; ABB; and Itron.
- Siemens
- Schneider Electric
- Hitachi Energy
- GE Vernova
- ABB
- Itron
Bibliography
- ABB. (2025, May 4). Generative AI in asset performance: ABB Genix APM Copilot transforms asset performance.
- Bundesnetzagentur. (2026a, January 2). Energy transition clears crucial hurdle – significant progress in electricity grid expansion in 2025.
- Bundesnetzagentur. (2026b, January 8). Growth in renewable energy in 2025.
- Commission de régulation de l’énergie. (2026, March 9). La CRE approuve le programme d’investissements de RTE pour l’année 2026, pour un montant de 4,24 milliards d’euros, conforme avec la trajectoire retenue par la CRE dans sa décision sur le tarif d’utilisation des réseaux publics d’électricité (TURPE 7).
- Department for Energy Security and Net Zero. (2026, July 16). DESNZ annual report 2025 to 2026: Performance report. GOV.UK.
- Department for Energy Security and Net Zero, Department for Science, Innovation and Technology, National Energy System Operator, & Ofgem. (2026, March 11). Government to tackle speculative demand grid connection requests. GOV.UK.
- GE Vernova. (2026, February 3). GE Vernova expands its Grid Automation portfolio with a new solution for modern grids.
- Hitachi Energy. (2026, March 23). Hitachi launches HMAX Energy, a pioneering AI-powered service and solution suite for critical energy infrastructure.
- International Energy Agency. (2025, April 10). Energy demand from AI. In Energy and AI.
- Itron. (2026, March 16). Itron brings AI-powered distributed intelligence capabilities to electric grid with NVIDIA.
- Regulatory Authority for Energy, Networks and Environment. (2025, July 17). Orientamenti per l’aggiornamento della regolazione output-based dei servizi di distribuzione e misura dell’energia elettrica a partire dal 1° gennaio 2026 (Consultation No. 332/2025/R/eel).
- RTE. (2026, February 25). Bilan électrique 2025 : les conditions sont réunies pour permettre à la France d’accélérer son électrification et réduire durablement sa dépendance aux énergies fossiles.
- Schneider Electric. (2025, November 18). Schneider Electric debuts One Digital Grid Platform to help utilities modernize and address energy costs.
- Siemens. (2025, December 11). Siemens boosts grid availability with comprehensive transparency.
- Terna. (2025, March 14). Terna: 2025 Development Plan for the national electricity grid presented.
- Terna. (2026, March 18). Terna: Renewable generation +27.8% in February. Electricity demand continues to increase.
- U.S. Department of Energy. (2026, March 12). Energy Department announces $1.9B investment in critical grid infrastructure to reduce electricity costs.
- U.S. Energy Information Administration. (2026a, January 13). EIA forecasts strongest four-year growth in U.S. electricity demand since 2000, fueled by data centers.
- U.S. Energy Information Administration. (2026b, March 25). EIA launches pilot survey on energy use at data centers.
This Report Answers
- The report explains where proactive utility monitors are used across asset type and analytics function. It also covers utility segment and deployment model.
- Segment analysis identifies the leading subsegments and the operating reasons utilities prioritize them.
- Country analysis examines the listed markets and the policy or infrastructure factors supporting monitoring deployment.
- Competitive analysis reviews current providers across sensors, asset analytics, grid automation and edge intelligence.
- Application analysis assesses how transformer health, feeder visibility and fault localization influence purchase decisions.
What does the Proactive Utility Monitors Market cover?
The Proactive Utility Monitors Market covers field devices and software that help utilities detect asset stress before outages. It includes smart grid sensor devices and electric power distribution automation systems when they support early alerts, condition monitoring and operator response.
The assessment covers utility analytics and energy analytics used for predictive asset health, anomaly detection and fault localization. It includes volt VAR management where voltage behavior, feeder stability and power-quality analytics depend on monitored field data.
What is included in the scope?
The scope includes power monitoring equipment, asset-health software, edge devices, cloud dashboards and sensor-to-SCADA integrations sold to utilities. Advanced metering infrastructure is included where endpoint data supports proactive network monitoring beyond billing.
It includes transformer monitors, substation monitors, feeder monitors, cable or line monitors and DER or inverter monitors. Dynamic line rating sensors and grid resilience alliances are adjacent where they improve line visibility, emergency response and resilience planning.
What is excluded from the scope?
Pure distributed energy generation assets, standalone inverters, billing-only meters and general enterprise software remain outside the scope. A microgrid platform is outside scope when it operates generation and storage without proactive asset-monitoring capability.
Raw transformer hardware, power cable sales, outsourced field inspection and generic SCADA upgrades remain outside the scope unless predictive alerts or asset-health analytics are part of the delivered function.
How Was the Analysis Built?
The analysis draws on 120+ sources, 35+ company portfolios, 25+ countries, and more than 20 industry interviews.
- Primary Research: Primary research includes discussions with manufacturers, service providers, technology developers, distributors, end users, and subject-matter experts. These conversations examine purchasing priorities, product adoption, operational challenges, approval requirements, competitive positioning, and the factors that influence wider market acceptance.
- Desk Research: Desk research covers government statistics, regulatory publications, company filings, trade data, technical studies, industry associations, standards, public policy, and other authoritative sources. Every source used in the analysis is documented in the bibliography.
- Market Sizing and Forecasting: Market estimates combine historical performance, demand indicators, pricing and volume trends, segment shares, company participation, country-level growth, adoption patterns, investment activity, and barriers to market expansion.
- Data Validation and Update Cycle: Findings are validated by comparing primary interviews with public data, company activity, regulatory changes, trade patterns, and industry developments. Regular updates review new product launches, capacity changes, partnerships, approvals, and shifts in commercial adoption.
Segmentation
What is the report’s scope and coverage?
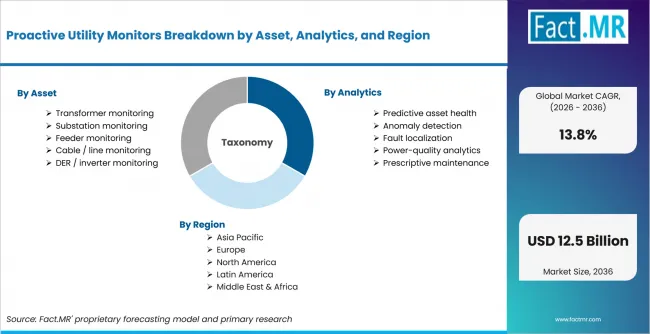
Proactive Utility Monitors Breakdown By Asset, Analytics, And Region | Source: Fact.MR
| Attribute | Details |
|---|---|
| Quantitative Units | USD billion |
| Market Definition | Hardware and software used by utilities to monitor asset condition, detect anomalies, localize faults and issue early operational alerts across electric, water and gas networks. |
| Asset | Transformer monitoring; Substation monitoring; Feeder monitoring; Cable / line monitoring; DER / inverter monitoring |
| Analytics | Predictive asset health; Anomaly detection; Fault localization; Power-quality analytics; Prescriptive maintenance |
| Utility Segment | Electric distribution; Transmission; Water / gas utility monitoring; Renewable utility; Municipal / microgrid |
| Deployment | Edge + cloud; Cloud SaaS; On-premise control center; Sensor-to-SCADA; Managed monitoring service |
| Regions Covered | North America; Latin America; Western Europe; Eastern Europe; East Asia; South Asia & Pacific; Middle East & Africa |
| Countries Covered | United States; France; Germany; United Kingdom; Italy |
| Key Companies Profiled | Siemens; Schneider Electric; Hitachi Energy; GE Vernova; ABB; Itron |
| Forecast Period | 2026 to 2036 |
| Approach | Hybrid top-down and bottom-up approach using installed grid assets; utility monitoring use cases; deployment mix; country-level investment; regulatory signals; and provider portfolio review. |
Source: Fact.MR analysis. Updated Sep 10, 2026
How is the market segmented?
-
By Asset
- Transformer monitoring
- Substation monitoring
- Feeder monitoring
- Cable / line monitoring
- DER / inverter monitoring
-
By Analytics
- Predictive asset health
- Anomaly detection
- Fault localization
- Power-quality analytics
- Prescriptive maintenance
-
By Utility Segment
- Electric distribution
- Transmission
- Water / gas utility monitoring
- Renewable utility
- Municipal / microgrid
-
By Deployment
- Edge + cloud
- Cloud SaaS
- On-premise control center
- Sensor-to-SCADA
- Managed monitoring service
-
By Region
- North America
- Latin America
- Western Europe
- Eastern Europe
- East Asia
- South Asia & Pacific
- Middle East & Africa
Frequently Asked Questions
How big is the proactive utility monitors market in 2026?
What is the CAGR of the proactive utility monitors market from 2026 to 2036?
Which analytics segment leads the proactive utility monitors market?
Which deployment model leads the proactive utility monitors market?
Which companies are profiled in the proactive utility monitors market?
Who worked on this report


Preview the report firsthand - request a free sample
Free SampleGet the brochure for pricing and purchase details
Download PDF