- Market Value (2025): USD 999.1 Mn
- Estimated Value (2026): USD 1120.0 Mn
- Forecast Value (2036): USD 3509.7 Mn
- CAGR (2026-2036): 12.1%
What is the Grid Resilience Alliances Market forecast to be worth by 2036?
USD 1120.0 million in 2026 to USD 3509.7 million by 2036 at a 12.1% CAGR.
- The Grid Resilience Alliances Market reached USD 999.1 million in 2025.
- Demand is projected to increase from USD 1120.0 million in 2026 to USD 3509.7 million by 2036.
- The market is forecast to record 12.1% CAGR from 2026 to 2036 as utilities, public agencies and technology vendors coordinate hardening programs.
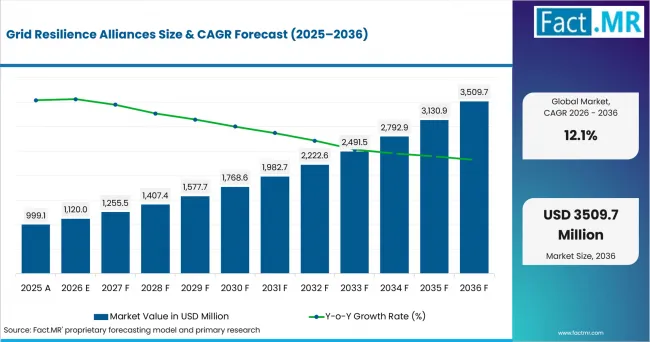
Grid Resilience Alliances Value Analysis | Source: Fact.MR
What are the defining numbers behind Grid Resilience Alliances Market growth?
An absolute opportunity of USD 2389.7 million is expected between 2026 and 2036.
- Demand Drivers in the Market
- Utilities need shared restoration methods when weather events damage several service territories during the same operating window.
- Public agencies need faster grid-upgrade coordination. In March 2026, the U.S. Department of Energy announced an approximately USD 1.9 billion SPARK funding opportunity to accelerate upgrades to the nation’s power grid.
- Technology vendors need alliance access to field data where utilities test sensors, analytics and outage-management software before wider deployment.
- Research bodies need common playbooks so lessons from black-start drills, wildfire planning and cyber exercises are useful across several operators.
- Key Segments Analyzed
- By Alliance Type: Utility-technology partnerships are expected to hold 31.0% share in 2026 due to the need for tested tools that improve field response.
- By Resilience Focus: Storm / wildfire hardening is projected to account for 27.0% share in 2026, supported by repeated weather-related grid interruptions.
- By Participant: Utilities are anticipated to capture 39.0% share in 2026 owing to their control over service areas, crews and grid operating data.
- By Program Model: Joint investment programs are estimated to represent 30.0% share in 2026 since resilience gains often require shared funding and approvals.
- Analyst Opinion at Fact.MR
- Shambhu Nath Jha, Principal Consultant at Fact.MR, states, "Grid resilience alliances are becoming operating partnerships because resilience depends on shared crews, data and decision rules. Demand is expected to favor programs that translate grant funding into repeatable restoration practices. Providers that combine field-tested technology, utility trust and standards knowledge are positioned to shape alliance selection."
- Strategic Implications
- Utilities should align mutual-aid playbooks with technology pilots so field crews receive tools that fit restoration workflows.
- Technology vendors should prove outage-location accuracy, cyber safeguards and service integration before alliance partners expand deployments.
- Public agencies should connect grants with shared deployment rules. Australia approved 14 projects under its Grid Enhancing Technologies grants program in July 2026.
- Research institutions should publish usable standards and training material so smaller utilities adopt tested resilience methods.
The USA is projected to record 13.6% CAGR through 2036 due to federal grid funding and mature mutual-aid practice. The UK is expected to post 13.3% CAGR as RIIO-3 investment and connections reform support network coordination. Japan is anticipated to advance at 12.9% CAGR with reserve planning and cross-regional coordination. Germany is estimated to reach 12.6% CAGR through line approvals and transformer capacity planning. Australia is forecast to hold 11.6% CAGR as transmission planning and grid-enhancing grants support shared pilots.
How does the Grid Resilience Alliances Market break down by segment?
Utilities lead Participant at 39.0% share in 2026; Utility-technology partnerships lead Alliance Type at 31.0% share.
Which Alliance Type dominates?
Utility-technology partnerships are expected to hold 31.0% share in 2026.
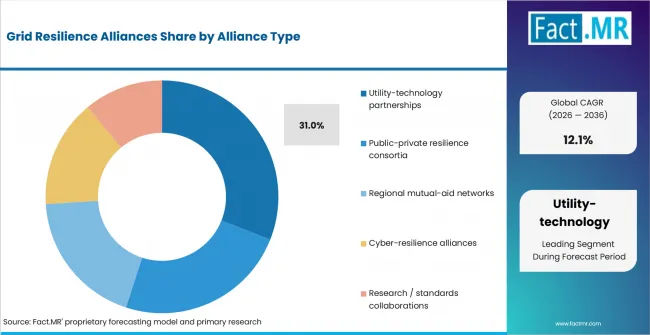
Grid Resilience Alliances Analysis By Alliance Type | Source: Fact.MR
Utility-technology partnerships lead Alliance Type since utilities need vendors to adapt field tools to live network conditions. These partnerships are useful where outage management, grid analytics and crew dispatch data must work together. GE Vernova launched GridOS for Distribution in February 2026 to help utilities operate distribution grids as one orchestrated system. That type of platform supports alliance programs that link software with grid operations.
What leads the Resilience Focus segment?
Storm / wildfire hardening is projected to account for 27.0% share in 2026.
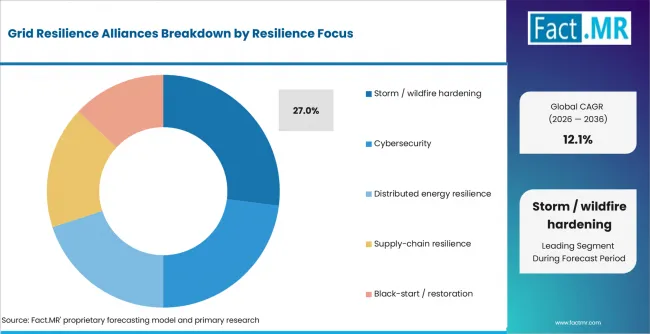
Grid Resilience Alliances Analysis By Resilience Focus | Source: Fact.MR
Storm / wildfire hardening leads Resilience Focus where alliances begin with visible outage exposure. Edison Electric Institute reported in June 2026 that about 80% of reported U.S. outages between 2000 and 2023 were associated with major weather events. Cybersecurity, supply-chain resilience and black-start planning remain active focus areas, yet storm hardening receives early funding because customers and regulators see the service effect directly.
How does Participant shape demand?
Utilities are anticipated to represent 39.0% share in 2026.
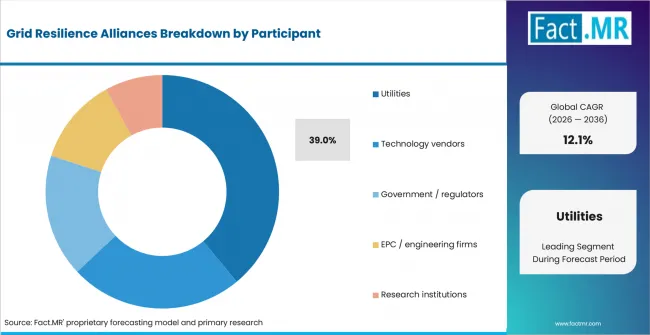
Grid Resilience Alliances Analysis By Participant | Source: Fact.MR
Utilities lead Participant due to their customer relationships, service-territory obligations and outage data. Technology vendors bring analytics platforms and field devices, while regulators help set reliability expectations. Government agencies often support funding and reporting rules. Research institutions contribute methods, standards and test results. Participation is expected to widen as alliance programs connect smart grid sensors with outage analytics and restoration planning.
What supports Program Model growth?
Joint investment programs are estimated to hold 30.0% share in 2026.
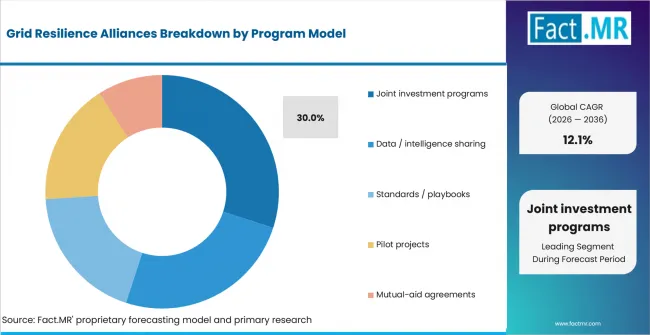
Grid Resilience Alliances Analysis By Program Model | Source: Fact.MR
Joint investment programs lead Program Model since resilience work often serves several parties at the same time. Utilities need shared cost rules for projects that harden corridors, add visibility and improve restoration speed. Data / intelligence sharing supports cyber and weather planning. Standards / playbooks help alliances repeat methods across territories. Pilot projects are expected to remain useful where distribution automation systems require field validation before wider rollout.
What is accelerating Grid Resilience Alliances Market adoption, and what is holding it back?
Federal funding drives it; cost allocation restrains it.
Drivers Impact Analysis
| DRIVER | (~) % IMPACT ON CAGR | GEOGRAPHIC RELEVANCE | IMPACT TIMELINE |
|---|---|---|---|
| Federal and regulator-backed grid resilience funding | +1.7% | North America, Western Europe | Short term (<= 2 years) |
| Extreme-weather outage exposure | +1.4% | USA, Australia, Japan | Medium term (2-4 years) |
| Utility-technology partnership models | +1.2% | Global | Medium term (2-4 years) |
| Cyber and data-sharing requirements | +0.8% | USA, UK, Japan | Long term (>= 4 years) |
- Federal and regulator-backed grid resilience funding: Public funding programs can create early demand for alliances that bring utilities, government agencies, and technology providers together. Clear funding pathways support joint planning where resilience projects require coordination across infrastructure owners, contractors, and solution vendors.
- Extreme-weather outage exposure: Severe weather increases the need for coordinated restoration, hardening, and emergency-response programs. Alliance models can improve crew sharing, equipment staging, and cross-utility planning where storms affect multiple service territories at the same time.
- Utility-technology partnership models: Utilities increasingly work with software and hardware vendors when resilience projects require sensors, analytics, communications, and field visibility. Partnership structures can reduce pilot risk while allowing utilities to retain operating control and vendors to demonstrate solutions across multiple networks.
- Cyber and data-sharing requirements: Grid resilience programs increasingly depend on secure information exchange between utilities, technology suppliers, and industry bodies. Clear data-sharing rules and common cyber practices can improve trust, support coordinated threat response, and strengthen collaboration across resilience-focused alliances.
Opportunity Impact Analysis
| OPPORTUNITY | (~) % IMPACT ON CAGR | GEOGRAPHIC RELEVANCE | IMPACT TIMELINE |
|---|---|---|---|
| Grid-enhancing technology pilots | +1.1% | Australia, USA, UK | Short term (<= 2 years) |
| Mutual-aid modernization | +0.9% | North America, Japan | Medium term (2-4 years) |
| Standards and playbook licensing | +0.7% | Global | Medium term (2-4 years) |
| Data-sharing and intelligence platforms | +0.6% | USA, Western Europe | Long term (>= 4 years) |
- Grid-enhancing technology pilots: Pilot programs create entry points for vendors providing dynamic ratings, sensing, analytics, and other grid-enhancing technologies. Alliance structures can help utilities test these solutions in controlled settings and convert successful pilots into repeatable deployment models.
- Mutual-aid modernization: Mutual-aid networks can expand beyond crew sharing toward common outage visibility, spare-equipment coordination, and restoration planning. Digital tools and shared operating procedures help utilities coordinate resources more efficiently across multiple service territories.
- Standards and playbook licensing: Research and standards collaborations can create value by giving utilities tested procedures, resilience frameworks, and implementation guidance. Shared playbooks help smaller utilities adopt structured resilience practices without developing every process independently.
- Data-sharing and intelligence platforms: Resilience programs increasingly require weather, cyber, and asset-condition information to move securely across multiple organizations. Alliance platforms with role-based access can support coordinated decision-making while helping utilities and technology partners manage sensitive operational data.
Restraints Impact Analysis
| RESTRAINT | (~) % IMPACT ON CAGR | GEOGRAPHIC RELEVANCE | IMPACT TIMELINE |
|---|---|---|---|
| Cost allocation across partners | -0.6% | Global | Short term (<= 2 years) |
| Long equipment lead times | -0.5% | USA, Germany, Australia | Medium term (2-4 years) |
| Sensitive grid-data controls | -0.4% | USA, UK, Japan | Medium term (2-4 years) |
| Different utility operating practices | -0.3% | Global | Long term (>= 4 years) |
- Cost allocation across partners: Joint resilience programs can stall when costs and benefits are distributed across utilities, customers, and public agencies. Clear funding responsibilities and benefit-sharing rules are important for securing approval and preventing delays in shared budgets.
- Long equipment lead times: Grid hardening depends on transformers, conductors, control equipment, and other components with long manufacturing cycles. Alliance schedules therefore need to align project planning with equipment availability, supplier capacity, and delivery timing.
- Sensitive grid-data controls: Data-sharing initiatives face limits where outage, control-room, cyber, and asset-condition information is sensitive. Alliances can progress more effectively when access rights, confidentiality requirements, and data boundaries are defined clearly from the outset.
- Different utility operating practices: Restoration methods, network designs, and operating procedures vary across service territories. Shared playbooks therefore often require local adaptation, increasing coordination effort and making modular guidance more useful than rigid one-size-fits-all procedures.
Which countries are scaling the Grid Resilience Alliances Market through 2036?
- The country comparison spans 2.0 percentage points and forms three practical growth bands across the forecast period.
- The USA remains 0.3 percentage point above the UK due to federal resilience funding and mature mutual-aid practice.
- The UK remains 0.4 percentage point above Japan as RIIO-3 investment and connections reform support network coordination.
- Japan remains 0.3 percentage point above Germany as reserve planning increases cross-regional coordination needs.
- Germany remains 1.0 percentage point above Australia as line approvals and transformer capacity programs support grid modernization.
- Australia closes the displayed range as transmission planning and grid-enhancing grants support shared resilience pilots.
Comparable CAGRs create different entry conditions due to funding rules, network ownership and emergency-response practice. Full report coverage includes North America, Latin America, Western Europe, Eastern Europe, East Asia, South Asia & Pacific, Middle East & Africa.
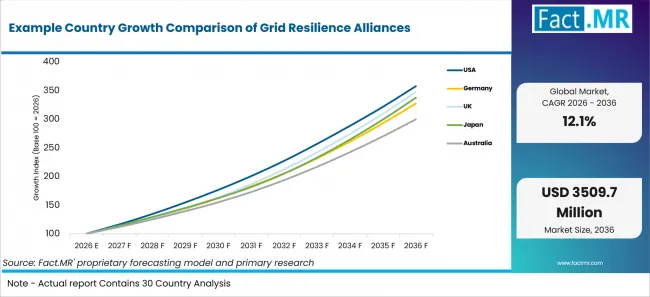
Example Country Growth Comparison Of Grid Resilience Alliances | Source: Fact.MR
| Country | CAGR |
|---|---|
| USA | 13.6% |
| UK | 13.3% |
| Japan | 12.9% |
| Germany | 12.6% |
| Australia | 11.6% |
What supports USA adoption?
13.6% CAGR, supported by federal grid funding and mutual-aid depth.
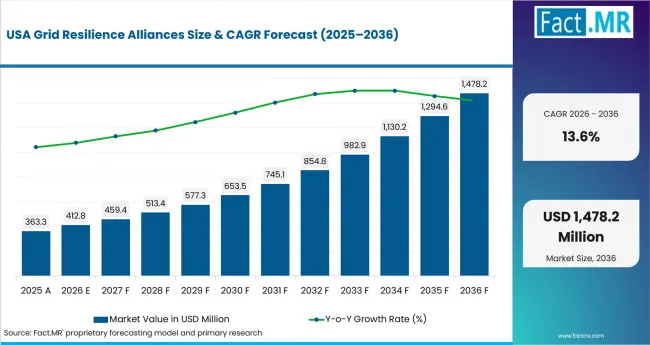
Grid Resilience Alliances Country Value Analysis | Source: Fact.MR
U.S. utilities rely on emergency coordination when hot weather or storms cross service areas. In June 2026, the Department of Energy issued two emergency orders to reduce Mid-Atlantic blackout risk. The USA is projected to record 13.6% CAGR through 2036 as alliance work links grid hardening, emergency response and technology pilots.
How is the UK scaling demand?
13.3% CAGR, backed by RIIO-3 investment and connections reform.
Britain's network operators are coordinating investment and connection sequencing through regulator-led programs. Ofgem confirmed GBP 10.3 billion of initial RIIO-3 investment for the electricity transmission network in December 2025 to strengthen reliability and expand grid capacity. The UK is expected to post 13.3% CAGR through 2036 as utilities, regulators and connection bodies align capacity upgrades with project readiness.
What supports Japan growth?
12.9% CAGR, driven by reserve planning and cross-regional coordination.
Japan is linking supply-demand planning with cross-regional coordination. METI reported in May 2026 that all areas had capacity for the 3% reserve rate needed for summer 2026. Japan is anticipated to advance at 12.9% CAGR through 2036 as OCCTO-backed supply-demand planning supports coordination across service areas.
What supports Germany adoption?
12.6% CAGR, reinforced by faster line approvals and transformer capacity planning.
Germany is pairing faster transmission approvals with long-term equipment planning. Bundesnetzagentur reported in January 2026 that it approved roughly 2,000 km of power lines in 2025. Germany is estimated to record 12.6% CAGR through 2036 as utilities coordinate corridors, transformer supply and standards-based grid expansion.
How does Australia perform?
11.6% CAGR, led by transmission planning and grid-enhancing technology funding.
Australia's resilience alliances are shaped by national transmission planning and public technology grants. AEMO said in December 2025 that around 6,000 km of new transmission lines would need to be added by 2050 under the Step Change scenario. Australia is forecast to hold 11.6% CAGR through 2036 as networks test technology, storage and grid capacity programs together.
Who leads the Grid Resilience Alliances Market?
GE Vernova is an active provider through GridOS for Distribution, which is designed to help utilities operate distribution grids as a coordinated system. Its position is relevant where resilience alliances connect grid analytics, outage management, field visibility and restoration workflows across utility operations.
Hitachi Energy participates through critical grid-infrastructure and transformer programs that support network reinforcement and resilience planning. Its grid-modernization activity is relevant where utilities need long-term equipment availability, coordinated expansion and technology partnerships alongside resilience programs.
ABB, Schneider Electric, Siemens Energy and Itron are also profiled in the competitive landscape. The report positions these companies as relevant participants in grid-resilience programs, although the provided material offers less specific alliance-level evidence for them than for GE Vernova and Hitachi Energy.
Competition therefore centers on field-tested grid technology, utility integration, restoration support and cyber-secure data exchange. Alliance credibility also depends on standards knowledge, equipment availability, interoperability and the ability to translate pilots into repeatable resilience programs across multiple service territories.
Which companies are the key providers?
Key companies includes ABB, Schneider Electric, SIEMENS ENERGY, ITRON, GE Vernova and Hitachi Energy.
- ABB
- Schneider Electric
- SIEMENS ENERGY
- ITRON
- GE Vernova
- Hitachi Energy
Bibliography
- Australian Energy Market Operator. (2025, December 10). AEMO publishes draft electricity roadmap for consultation.
- Bundesnetzagentur. (2026, January 2). Energy transition clears crucial hurdle – significant progress in electricity grid expansion in 2025.
- Department for Energy Security and Net Zero, Department for Science, Innovation and Technology, National Energy System Operator, & Ofgem. (2026, March 11). Government to tackle speculative demand grid connection requests.
- Department of Climate Change, Energy, the Environment and Water. (2026, July 22). $30 million to strengthen nation's electricity grid.
- Concentric Energy Advisors, Inc. (2026, June 1). The U.S. electric grid: A critical backbone for the economy and national security.
- Electric Power Research Institute. (2025, December 15). New global initiative launched to prepare future-ready grids.
- GE Vernova. (2026, February 3). GE Vernova launches GridOS for Distribution, the industry’s first unified solution for grid orchestration.
- GridWise Alliance. (2026, March 4). AI and the grid: Unlocking the potential of artificial intelligence for electric utilities.
- Hitachi Energy. (2025, July 28). Hitachi Energy and E.ON sign deal worth up to $700 million USD for critical grid infrastructure to bolster energy security and resilience in Germany.
- Ministry of Economy, Trade and Industry. (2026, May 20). Measures for balancing electricity supply and demand for summer 2026 compiled.
- Ofgem. (2025, December 4). Ofgem unlocks £28 billion investment to maintain a safe, secure and resilient energy grid and to upgrade and expand capacity to meet growing demands.
- U.S. Department of Energy. (2026, June 30). Energy Secretary secures Mid-Atlantic grid ahead of period of hot weather.
- U.S. Department of Energy. (2026, March 12). Energy Department announces $1.9B investment in critical grid infrastructure to reduce electricity costs.
This Report Answers
- The report explains how grid resilience alliances are used across alliance type and resilience focus. It also covers participant and program model.
- Segment analysis identifies the leading subsegments and the operating reasons utilities prioritize them.
- Country analysis examines the USA, UK, Japan, Germany and Australia through funding, planning and grid-risk evidence.
- Competitive analysis reviews ABB, Schneider Electric, SIEMENS ENERGY, ITRON, GE Vernova and Hitachi Energy.
- Application analysis assesses how hardening, cyber readiness and restoration coordination influence alliance selection.
What does the Grid Resilience Alliances Market cover?
The Grid Resilience Alliances Market covers formal and semi-formal programs that improve the ability of electric grids to prepare for disruptions and restore service. It includes utility-technology partnerships, public-private consortia, mutual-aid networks, cyber-resilience alliances and research collaborations.
The assessment differs from pure equipment markets because alliance value comes from coordination and shared operating methods. Adjacent coverage of electric power equipment and advanced metering infrastructure helps define the technology layer used inside resilience programs.
What is included in the scope?
The scope includes alliance models used by utilities, government bodies, technology vendors, EPC firms and research institutions to strengthen grid resilience. It covers storm / wildfire hardening, cyber readiness, distributed energy resilience and restoration planning. Related coverage of utility analytics, dynamic line rating sensors and volt VAR management is treated as adjacent technology context when these tools support alliance execution. Programs linked with behind-the-meter storage or microgrid services are included when the alliance objective is grid resilience.
What is excluded from the scope?
The scope excludes standalone power equipment sales, one-off consulting assignments and telecom-only resilient networks activity. Standalone smart grid sensors and software tools are covered only when they are part of a grid-resilience alliance, consortium or joint program.
How Was the Analysis Built?
The analysis draws on 120+ sources, 35+ company portfolios, 25+ countries, and more than 20 industry interviews.
- Primary Research: Primary research includes discussions with manufacturers, service providers, technology developers, distributors, end users, and subject-matter experts. These conversations examine purchasing priorities, product adoption, operational challenges, approval requirements, competitive positioning, and the factors that influence wider market acceptance.
- Desk Research: Desk research covers government statistics, regulatory publications, company filings, trade data, technical studies, industry associations, standards, public policy, and other authoritative sources. Every source used in the analysis is documented in the bibliography.
- Market Sizing and Forecasting: Market estimates combine historical performance, demand indicators, pricing and volume trends, segment shares, company participation, country-level growth, adoption patterns, investment activity, and barriers to market expansion.
- Data Validation and Update Cycle: Findings are validated by comparing primary interviews with public data, company activity, regulatory changes, trade patterns, and industry developments. Regular updates review new product launches, capacity changes, partnerships, approvals, and shifts in commercial adoption.
What is the report's scope and coverage?
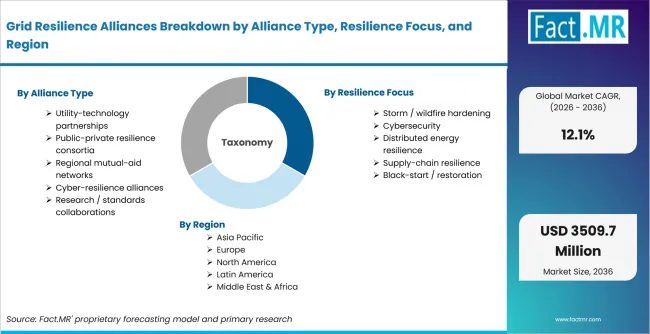
Grid Resilience Alliances Breakdown By Alliance Type, Resilience Focus, And Region | Source: Fact.MR
| Attribute | Details |
|---|---|
| Quantitative Units | USD million |
| Market Definition | Alliances, consortia, joint programs and collaborative operating models that improve electric-grid resilience through shared planning, hardening, restoration, cyber-readiness and technology deployment. |
| Alliance Type | Utility-technology partnerships; Public-private resilience consortia; Regional mutual-aid networks; Cyber-resilience alliances; Research / standards collaborations |
| Resilience Focus | Storm / wildfire hardening; Cybersecurity; Distributed energy resilience; Supply-chain resilience; Black-start / restoration |
| Participant | Utilities; Technology vendors; Government / regulators; EPC / engineering firms; Research institutions |
| Program Model | Joint investment programs; Data / intelligence sharing; Standards / playbooks; Pilot projects; Mutual-aid agreements |
| Regions Covered | North America; Latin America; Western Europe; Eastern Europe; East Asia; South Asia & Pacific; Middle East & Africa |
| Countries Covered | USA; UK; Japan; Germany; Australia |
| Key Organizations and Companies Profiled | ABB; Schneider Electric; SIEMENS ENERGY; ITRON; GE Vernova; Hitachi Energy |
| Forecast Period | 2026 to 2036 |
| Approach | Hybrid top-down and bottom-up approach using grid-resilience funding, alliance participation, utility partnership activity, country-level grid policy and provider portfolio review. |
How is the market segmented?
-
By Alliance Type
- Utility-technology partnerships
- Public-private resilience consortia
- Regional mutual-aid networks
- Cyber-resilience alliances
- Research / standards collaborations
-
By Resilience Focus
- Storm / wildfire hardening
- Cybersecurity
- Distributed energy resilience
- Supply-chain resilience
- Black-start / restoration
-
By Participant
- Utilities
- Technology vendors
- Government / regulators
- EPC / engineering firms
- Research institutions
-
By Program Model
- Joint investment programs
- Data / intelligence sharing
- Standards / playbooks
- Pilot projects
- Mutual-aid agreements
-
By Region
- North America
- Latin America
- Western Europe
- Eastern Europe
- East Asia
- South Asia & Pacific
- Middle East & Africa