- Market Value (2025): USD 58.4 Bn
- Estimated Value (2026): USD 62.2 Bn
- Forecast Value (2036): USD 116.4 Bn
- CAGR (2026-2036): 6.5%
What is the Handset Display Market forecast to be worth by 2036?
USD 62.2 billion in 2026 to USD 116.4 billion by 2036 at a 6.5% CAGR.
- As per Fact.MR analysis, the handset display market was valued at USD 58.4 billion in 2025.
- Demand is projected to grow from USD 62.2 billion in 2026 to USD 116.4 billion by 2036.
- The forecast implies a 6.5% CAGR from 2026 to 2036, supported by display upgrades, adoption of advanced OLED panels and continuing demand for replacement screens.
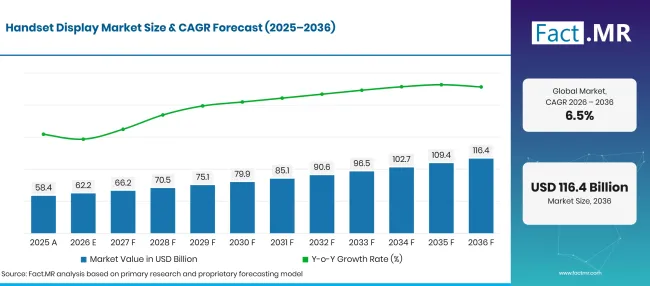
Handset Display Market Forecast Global | Source: Fact.MR
| Year | Basis | Market Value (USD billion) |
|---|---|---|
| 2025 | Actual | 58.4 |
| 2026 | Estimate | 62.2 |
| 2036 | Forecast | 116.4 |
| CAGR 2026 to 2036 | Forecast period | 6.5% |
Source: Fact.MR analysis. Updated Oct 23, 2026
What are the defining numbers behind Handset Display Market growth?
USD 54.2 billion absolute opportunity between 2026 and 2036.
- Demand Drivers in the Market
- Increasing adoption of OLED and AMOLED is supporting the growth of the handset display market. Display technology upgrades support demand for panels with better contrast, brightness, colour reproduction and power efficiency. Omdia reported that AMOLED-equipped smartphones accounted for 63% of global smartphone shipments in the first quarter of 2025, up from 51% a year earlier [1].
- New display features in premium handsets have driven the growth of the market. Samsung Display showcased its Flex Magic Pixel privacy technology at Mobile World Congress in March 2026. The technology uses panel-level privacy features to restrict viewing angles, illustrating how display suppliers are developing features beyond conventional image quality [2].
- Continued demand for LCD panels is supported by their ongoing use in lower-cost handsets and replacement markets. TrendForce estimated in August 2026 that LCD smartphone panels would account for approximately 59% of global smartphone panel shipments in 2026, while AMOLED would account for around 41% [3]. This illustrates the continued importance of affordability and the installed handset base.
- Display manufacturing investment supports production capacity expansion, advanced display technology development. BOE announced the mass-production launch of its Gen 8.6 AMOLED production line in Chengdu on June 17, 2026, highlighting investment in advanced display manufacturing capacity [4]. Although the line serves mid- to large-sized OLED applications rather than only handset panels, it reflects broader investment in OLED production technology.
- Key Segments Analyzed
- By Technology: LCD will account for 36.5% of the market in 2026. The OLED category includes AMOLED implementations, so any separate AMOLED reporting requires mutually exclusive definitions.
- By Size: Above 6 inches hold 44.7% of the market in 2026, reflecting the importance of larger screens in contemporary handset designs.
- By Resolution: HD leads with 46.2% of the market in 2026.
- By Application: Smartphones represent 89.4% of the market in 2026, making them the dominant specified handset application.
- Analyst Opinion at Fact.MR
- Shambhu Nath Jha, Principal Consultant at Fact.MR, states, “Handset display demand is shaped by a balance between premium features and cost control. OLED and AMOLED panels enable manufacturers to differentiate devices through contrast, brightness, form factor and privacy-related features, while LCD remains important in price-sensitive and replacement segments. Suppliers that can deliver consistent panel quality, improve manufacturing yields and manage costs are better positioned to serve different handset categories. The market outlook will also depend on smartphone replacement cycles and the ability of advanced display features to justify higher device prices.”
- Strategic Implications
- Display manufacturers need to balance OLED innovation with cost-effective LCD production for entry-level and replacement demand.
- Handset brands can link display upgrades to clear consumer benefits such as readability, power efficiency, privacy, brightness, and durability.
- Panel suppliers must prioritize yield improvement, manufacturing efficiency, and reliable supply to manage pricing pressure.
- Procurement teams are advised to assess panel quality, lifetime, power consumption, and supply continuity alongside the purchase price.
- Investors and market participants benefit from distinguishing panel shipments from panel revenue because changes in panel mix and average selling prices can affect revenue differently from unit demand.
Germany is set to record a 7.5% CAGR through 2036. Brazil is set to post 6.8%, followed by the USA at 6.2%. The UK is estimated to advance at 5.5%, while Japan is forecast at 4.9%.
How does the Handset Display Market break down by segment?
Fact.MR’s segmentation identifies LCD at 36.5% of the technology category, displays above 6 inches at 44.7% of the size category, HD at 46.2% of the resolution category, and smartphones at 89.4% of the application category.
Which Technology leads?
LCD is set to hold 36.5% share in 2026.
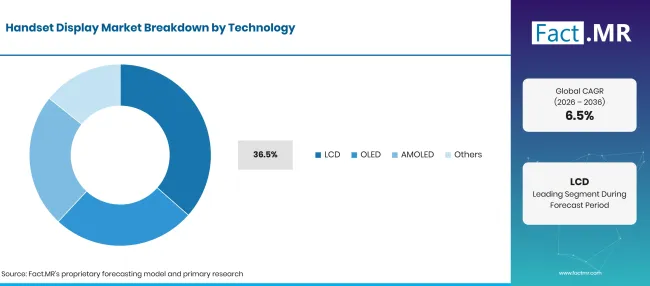
Handset Display Market Breakdown Technology | Source: Fact.MR
| Technology | Share (2026) |
|---|---|
| LCD | 36.5% |
| Other segments combined | 63.5%* |
| Total | 100.0% |
Source: Fact.MR analysis. Updated Oct 23, 2026
LCD panels remain important for handsets where manufacturing cost, affordability and replacement demand are central purchasing considerations. They are used across entry-level and selected mid-range devices, where buyers may prioritise screen availability and price over the contrast and design features associated with premium OLED panels. OLED technology produces light at the pixel level, allowing deep blacks and high contrast. AMOLED is an active-matrix form of OLED commonly used in smartphone displays. Flexible OLED and other advanced implementations can also support thinner panels and curved or foldable device designs.
What leads the Size segment?
Displays above 6 inches are set to represent 44.7% share in 2026.
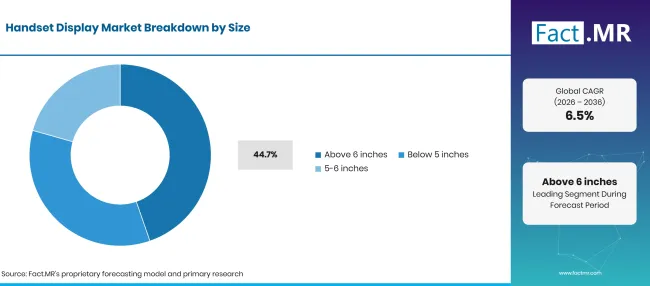
Handset Display Market Breakdown Size | Source: Fact.MR
| Display Size | Share (2026) |
|---|---|
| Above 6 inches (Leading segment) | 44.7% |
| Other segments combined | 55.3%* |
| Total | 100.0% |
Source: Fact.MR analysis. Updated Oct 23, 2026
Displays above 6 inches support video streaming, gaming, reading, navigation and multitasking. Handset manufacturers can use larger screens to improve the viewing experience and differentiate products across mid-range and premium categories. However, panel dimensions must be balanced against device weight, battery capacity, handling comfort and manufacturing cost. Smaller displays remain relevant in compact devices, feature phones and selected specialist handsets. The market share of each size band depends on the product mix, regional price sensitivity and the pace at which manufacturers introduce larger-screen models.
How does Resolution shape demand?
HD displays are likely to account for 46.2% share in 2026.
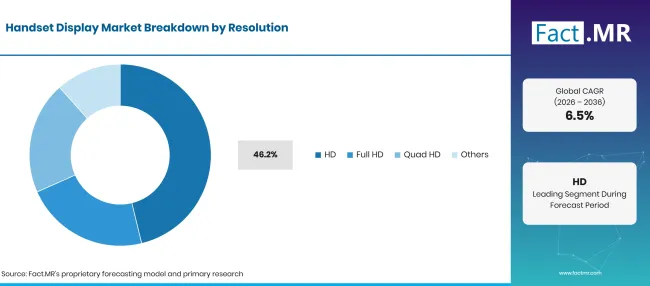
Handset Display Market Breakdown Resolution | Source: Fact.MR
| Resolution | Share (2026) |
|---|---|
| HD (Leading segment) | 46.2% |
| Other segments combined | 53.8%* |
| Total | 100.0% |
Source: Fact.MR analysis. Updated Oct 23, 2026
HD panels remain relevant in affordable smartphones, where manufacturers need to manage component costs while providing an adequate viewing experience. Resolution selection also depends on display size, pixel density, power consumption and the device’s target price. Full HD panels offer greater detail and can be suited to larger displays, while Quad HD is used in selected premium devices. Actual demand depends on the handset portfolio and the balance between perceived image quality, manufacturing cost and power efficiency.
How does Application shape demand?
Smartphones are likely to account for 89.4% share in 2026.
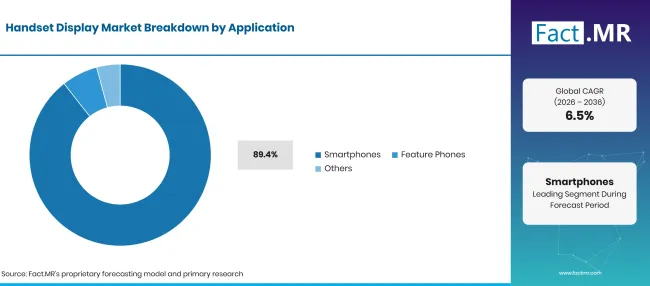
Handset Display Market Breakdown Application | Source: Fact.MR
| Application | Share (2026) |
|---|---|
| Smartphones (Leading segment) | 89.4% |
| Other segments combined | 10.6%* |
| Total | 100.0% |
Source: Fact.MR analysis. Updated Oct 23, 2026
Smartphones dominate handset display demand because they require screens that support communication, photography, entertainment, navigation and applications. Display upgrades can help handset manufacturers differentiate products through brightness, refresh rate, resolution, power consumption and privacy features. Feature phones and other handsets represent a smaller part of the supplied application mix. Their displays generally face stronger cost constraints, making LCD and simpler panel configurations commercially relevant. Replacement and repair demand also creates a market for compatible panels beyond new handset production.
What is accelerating Handset Display Market adoption, and what is holding it back?
Advanced OLED features, larger screens and replacement demand support the market, while component-cost pressure, price competition and slower handset upgrades may restrain growth.
Drivers Impact Analysis
| DRIVER | (~) % IMPACT ON CAGR | GEOGRAPHIC RELEVANCE | IMPACT TIMELINE |
|---|---|---|---|
| Rising demand for OLED displays | +1.0% | Asia, Americas | Medium term (2–4 years) |
| Increasing smartphone replacement demand | +0.9% | Global | Short term (≤ 2 years) |
| Growing adoption of high-refresh-rate displays | +0.7% | Global | Medium term (2–4 years) |
| Demand for larger and higher-resolution screens | +0.5% | Asia, Europe | Medium term (2–4 years) |
| Expansion of foldable smartphone displays | +0.4% | Asia, Americas | Long term (≥ 4 years) |
Source: Fact.MR analysis. Updated Oct 23, 2026
Opportunity Impact Analysis
| OPPORTUNITY | (~) % IMPACT ON CAGR | GEOGRAPHIC RELEVANCE | IMPACT TIMELINE |
|---|---|---|---|
| Advanced OLED and AMOLED display development | +0.8% | Global | Medium term (2–4 years) |
| Low-power display technologies | +0.6% | Asia, Europe | Medium term (2–4 years) |
| Flexible and foldable display integration | +0.5% | Asia, Americas | Long term (≥ 4 years) |
| High-brightness and durable display solutions | +0.4% | Global | Short term (≤ 2 years) |
Source: Fact.MR analysis. Updated Oct 23, 2026
Restraints Impact Analysis
| RESTRAINT | (~) % IMPACT ON CAGR | GEOGRAPHIC RELEVANCE | IMPACT TIMELINE |
|---|---|---|---|
| High manufacturing costs of advanced displays | -0.8% | Global | Short term (≤ 2 years) |
| Price sensitivity in entry-level smartphone segments | -0.6% | Asia, Africa | Medium term (2–4 years) |
| OLED panel production and yield challenges | -0.5% | Global | Short term (≤ 2 years) |
| Supply chain disruptions and component availability | -0.4% | Global | Medium term (2–4 years) |
Source: Fact.MR analysis. Updated Oct 23, 2026
Which countries are scaling the Handset Display Market through 2036?
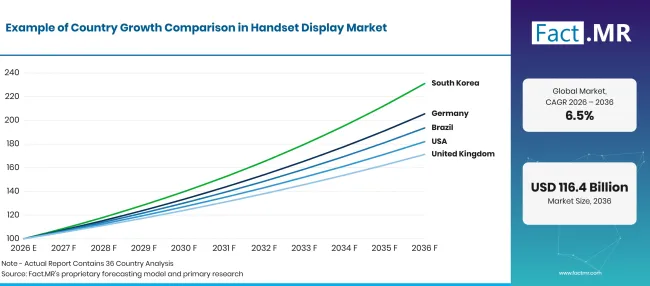
Handset Display Market Growth Index | Source: Fact.MR
| Country | CAGR (2026–2036) |
|---|---|
| Germany | 7.5% |
| Brazil | 6.8% |
| USA | 6.2% |
| UK | 5.5% |
| Japan | 4.9% |
Source: Fact.MR analysis. Updated Oct 23, 2026
What supports Germany adoption?
7.5% CAGR, supported by demand for premium handsets and advanced display features.
Germany’s handset display demand is linked to smartphone replacement, premium-device purchases and the availability of devices with improved brightness, resolution and power efficiency. Advanced OLED panels may benefit from manufacturers’ efforts to differentiate higher-priced handsets
How is Brazil developing handset display adoption?
6.8% CAGR, backed by smartphone demand and cost-conscious device choices.
Brazil’s market opportunity depends on the balance between affordable smartphones and premium models. LCD panels remain relevant in price-sensitive categories, while OLED adoption can expand where manufacturers offer advanced displays at accessible price points. Replacement screens also support panel demand when consumers repair existing devices instead of buying new handsets.
What supports United States adoption?
6.2% CAGR, shaped by premium smartphone features and replacement demand.
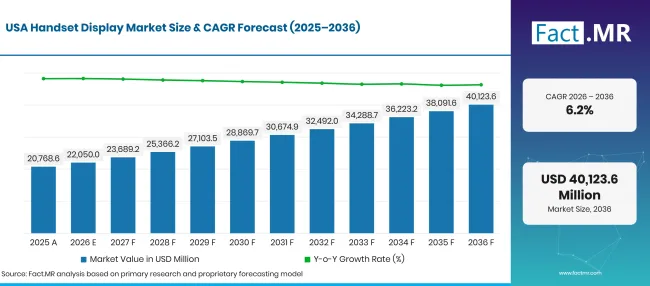
Handset Display Market Forecast Usa | Source: Fact.MR
The US market includes demand for premium smartphones with high-quality displays, advanced privacy features and improved viewing performance. Market growth will depend on whether consumers value these improvements enough to support device upgrades and higher panel prices.
How is the United Kingdom building adoption?
5.5% CAGR, driven by handset replacement and demand for varied device specifications.
UK handset display demand reflects a mix of premium smartphones, mid-range devices and replacement screens. OLED panels can support differentiation through contrast, brightness and design flexibility, while LCD panels remain important where cost is a priority.
What supports Japan adoption?
4.9% CAGR, backed by display technology development and established electronics expertise.
Japan has an established display and electronics industry, with companies such as Japan Display Inc. and Sharp Corporation participating in display technologies. The market opportunity includes advanced panels, compact devices and specialised display applications.
Who leads the Handset Display Market?
Fact.MR finds that Samsung Display Co., LG Display Co., BOE Technology Group Co., Tianma Microelectronics Co., Ltd., Visionox Technology Inc., Japan Display Inc., Sharp Corporation, TCL CSOT, AUO Corporation and Innolux Corporation.
Samsung Display, LG Display, BOE, Tianma and Visionox participate in mobile-display manufacturing, including OLED technologies. Japan Display and Sharp are relevant to the broader display supply chain, while TCL CSOT, AUO and Innolux participate in display-panel manufacturing across different product categories. Their handset exposure and competitive positions vary by technology, panel size, customer and application. BOE Technology Group Co announced the mass-production launch of its Gen 8.6 AMOLED production line in Chengdu in June 2026, reflecting investment in advanced OLED manufacturing [4]. Moreover, LG Display announced its FLiPP fine-metal-mask-free OLED patterning technology in August 2026. The company reported improvements in brightness, panel lifetime and power consumption under its stated comparison conditions [5].
Competition depends on panel quality, manufacturing yield, power efficiency, brightness, lifetime, pricing and reliable delivery. Suppliers must balance investment in advanced OLED production with the cost competitiveness of LCD panels. Device manufacturers also need stable component supply and consistent panel performance across handset models.
Which companies are the key providers?
Key companies include Samsung Display Co., Ltd.; LG Display Co., Ltd.; BOE Technology Group Co., Ltd.; Tianma Microelectronics Co., Ltd.; Visionox Technology Inc.; Japan Display Inc.; Sharp Corporation; TCL China Star Optoelectronics Technology Co., Ltd. (TCL CSOT); AUO Corporation; and Innolux Corporation.
- Samsung Display Co.
- LG Display Co.
- BOE Technology Group Co.
- Tianma Microelectronics Co., Ltd.
- Visionox Technology Inc.
- Japan Display Inc.
- Sharp Corporation
- TCL CSOT
- AUO Corporation
- Innolux Corporation
Bibliography
- [1] Omdia. (2025, June 12). Omdia: Flexible AMOLED displays power 51% of global smartphone shipments.
- [2] Samsung Display. (2026, March 2). Samsung Display showcases AI-optimized OLED technologies at MWC26.
- [3] TrendForce. (2026, August 31). Secondary and repair markets provide support; global smartphone panel shipments to decline just 2.5% in 2026, says TrendForce.
- [4] BOE Technology Group. (2026, June 17). BOE launches China’s first Gen 8.6 AMOLED production line, ushering in a new era for high-end displays.
- [5] LG Display. (2026, August 19). LG Display unveils FLiPP, achieving dream next-generation OLED.
This Report Answers
- The report describes the market for handset displays across the specified technologies, sizes, resolutions and applications.
- Segment analysis compares LCD, OLED and AMOLED technologies, screen sizes, resolution categories and handset applications.
- Country analysis discusses Germany, Brazil, the USA, the UK and Japan alongside relevant display-industry developments.
- The competitive overview profiles ten named display manufacturers.
- Demand analysis examines OLED adoption, premium display features, replacement demand, panel manufacturing investment and pricing pressures.
What does the Handset Display Market cover?
The market covers display panels used in smartphones, feature phones and other handset categories. It tracks panel technologies, sizes, resolutions and applications. Purchasing decisions depend on image quality, brightness, power consumption, panel durability, manufacturing cost and compatibility with handset designs.
What is included in the scope?
Included products are LCD, OLED, AMOLED and other handset display panels sold for use in smartphones, feature phones and other defined handset categories. The scope includes panels across the specified size and resolution categories and considers relevant display manufacturers and technology developments.
What is excluded from the scope?
The analysis excludes television, desktop-monitor, notebook and tablet displays unless they are explicitly included in the underlying market definition. General semiconductor components, handset batteries, cameras, touch controllers and finished smartphones are excluded from display-panel revenue unless the original market model specifically includes them. Display manufacturing equipment and unrelated display services are also excluded.
How Was the Analysis Built?
The analysis draws on 120+ sources, 35+ company portfolios, 25+ countries, and more than 20 industry interviews.
- Primary Research: Primary research includes discussions with manufacturers, service providers, technology developers, distributors, end users, and subject-matter experts. These conversations examine purchasing priorities, product adoption, operational challenges, approval requirements, competitive positioning, and the factors that influence wider market acceptance.
- Desk Research: Desk research covers government statistics, regulatory publications, company filings, trade data, technical studies, industry associations, standards, public policy, and other authoritative sources. Every source used in the analysis is documented in the bibliography.
- Market Sizing and Forecasting: Market estimates combine historical performance, demand indicators, pricing and volume trends, segment shares, company participation, country-level growth, adoption patterns, investment activity, and barriers to market expansion.
- Data Validation and Update Cycle: Findings are validated by comparing primary interviews with public data, company activity, regulatory changes, trade patterns, and industry developments. Regular updates review new product launches, capacity changes, partnerships, approvals, and shifts in commercial adoption.
Segmentation
What is the report’s scope and coverage?
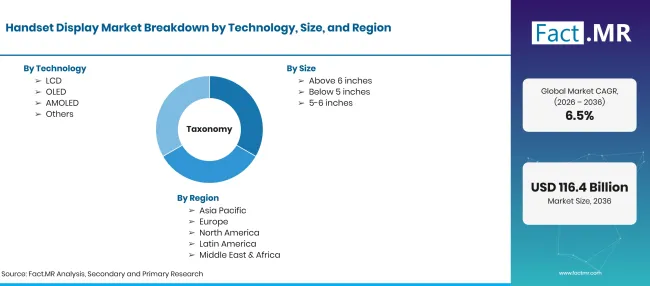
Handset Display Market Taxonomy | Source: Fact.MR
| Attribute | Details |
|---|---|
| Quantitative Units | USD billion in 2026 to USD billion by 2036, at CAGR |
| Market Definition | Display panels used in smartphones, feature phones and other handset categories |
| Technology | LCD; OLED; AMOLED; Others |
| Size | Above 6 inches; Below 5 inches; 5–6 inches |
| Resolution | HD; Full HD; Quad HD; Others |
| Application | Smartphones; Feature Phones; Others |
| Regions Covered | North America; Latin America; Western Europe; Eastern Europe; East Asia; South Asia & Pacific; Middle East & Africa |
| Countries Covered | Germany; Brazil; USA; UK; Japan |
| Companies Profiled | Samsung Display; LG Display; BOE; Tianma; Visionox; Japan Display; Sharp; TCL CSOT; AUO; Innolux |
| Forecast Period | 2026 to 2036 |
| Approach | public display-industry statistics and company announcements |
Source: Fact.MR analysis. Updated Oct 23, 2026
How is the market segmented?
-
By Technology
- LCD
- OLED
- AMOLED
- Others
-
By Size
- Above 6 inches
- Below 5 inches
- 5–6 inches
-
By Resolution
- HD
- Full HD
- Quad HD
- Others
-
By Application
- Smartphones
- Feature Phones
- Others
-
By Region
- North America
- Latin America
- Western Europe
- Eastern Europe
- East Asia
- South Asia & Pacific
- Middle East & Africa
Frequently Asked Questions
How big is the Handset Display Market in 2026?
What is the calculated 2025 market value?
What is the CAGR from 2026 to 2036?
Which technology has the largest share?
Which display size leads?
Which resolution leads?
Which application has the largest share?
Which countries have the highest growth rates?
Which companies are covered?
Who worked on this report


Preview the report firsthand - request a free sample
Free SampleGet the brochure for pricing and purchase details
Download PDF