- Market Value (2025): USD 60.2 Bn
- Estimated Value (2026): USD 62.7 Bn
- Forecast Value (2036): USD 94.9 Bn
- CAGR (2026-2036): 4.2%
What is the High Horsepower Tractor Market forecast to be worth by 2036?
USD 62.7 billion in 2026 to USD 94.9 billion by 2036 at a 4.2% CAGR.
- The valuation of the high horsepower tractor market was USD 60.2 billion in 2025, with large row-crop and grain farms accounting for most purchases.
- By 2036, revenue will reach USD 94.9 billion, up from USD 62.7 billion in 2026, as commercial farms trade up to machines that pull wider planters and tillage tools.
- A 4.2% CAGR will hold from 2026 to 2036, since replacement of older fleets runs alongside steady investment in traction and precision controls.
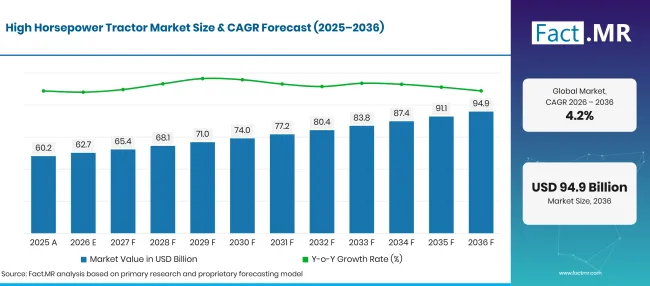
High Horsepower Tractor Market Forecast Global | Source: Fact.MR
| Year | Basis | Market Value (USD billion) |
|---|---|---|
| 2025 | Actual | 60.2 |
| 2026 | Estimate | 62.7 |
| 2036 | Forecast | 94.9 |
| CAGR 2026 to 2036 | Forecast period | 4.2% |
Source: Fact.MR analysis. Updated Oct 30, 2026
What are the defining numbers behind High Horsepower Tractor Market growth?
The 2026 to 2036 period adds USD 32.2 billion in new value, concentrated on large commercial farms.
- Demand Drivers in the Market
- Farm consolidation keeps lifting the acreage each operator must cover. The U.S. Department of Agriculture counted 115,030 farms with sales of USD 1 million or more in 2025, operating about 36.0% of all U.S. farmland [1]. Holdings at that scale need tractors that can pull wide implements for long hours.
- Manufacturers continue to push power ratings upward for farms that want more pulling capacity per pass. In September 2025, Case IH presented the Steiger 785 Quadtrac with a peak output of 853 HP and a 40% torque rise [2]. Machines in this class let one operator work a large implement at higher ground speed.
- Output growth in global agriculture keeps fieldwork volumes rising. In July 2025, the OECD and FAO estimated that global agricultural and fish production will increase by 14% over the next ten years, mainly through productivity gains [3]. Higher yields per hectare raise the workload at planting and harvest, which favors high-capacity machinery.
- Labor costs give farms a reason to cover more ground with fewer drivers. USDA data show an average hourly wage of USD 19.10 for all farm occupations in 2024, up 3.09% from 2023 [4]. A wider implement behind a stronger tractor spreads that wage over more acres.
- Automation readiness is turning into a purchase criterion. In August 2025, Fendt launched its 1000 Vario Gen4 range, spanning 426 HP to 550 HP, with factory readiness for PTx OutRun grain-cart and tillage automation [5]. Purchase prices and farm profitability still shape the timing of each replacement.
- Key Segments Analyzed
- By Engine Power: 201-300 HP will hold 38.5% share in 2026, since this band delivers enough drawbar pull for mid-sized implements without the price of the top power classes.
- By Application: Agriculture will account for 64.8% share in 2026, given that tillage, planting and grain haulage absorb most annual operating hours.
- By Drive Type: 4WD will capture 62.3% share in 2026 as traction on wet or heavy soils decides how much implement width a tractor can carry.
- By Sales Channel: OEM will command 71.8% share in 2026 through dealer networks that bundle configuration, warranty and financing with each new unit.
- Analyst Opinion at Fact.MR
- Shambhu Nath Jha, Principal Consultant at Fact.MR, states, “Buying decisions in this category start with a simple calculation: how many hectares a crew must finish before the weather turns. Four-wheel-drive models with guidance and automation readiness will gain ground because they shorten that calculation. Suppliers that pair dependable drivetrains with fast parts and service support will win repeat orders from large farms.”
- Strategic Implications
- Tractor manufacturers should publish field data on fuel use per hectare and service intervals, since buyers compare running costs alongside rated horsepower.
- Dealers should hold critical parts stock and trained technicians close to large-farm clusters, given that a stalled tractor during planting costs more than the repair itself.
- Precision technology providers should build guidance and implement-control packages that move across tractor brands and power classes.
- Equipment lenders should tie repayment schedules to harvest cash flow, which eases the upfront cost of a high-value machine.
Brazil leads the group at 5.1% CAGR, with record grain harvests drawing larger machines onto expanding cropland. The United States follows at 4.7%, where big row-crop operations replace aging fleets. Japan will advance at 4.0% as farmland moves into fewer and larger holdings. Germany posts 3.6%, with arable farms upgrading after a weak registration year. The United Kingdom closes at 3.1%, as cereal farmers weigh new purchases against tight crop margins.
How does the High Horsepower Tractor Market break down by segment?
201-300 HP will lead Engine Power at 38.5%; Agriculture will top Application at 64.8%; 4WD will head Drive Type at 62.3%; OEM will hold first place in Sales Channel at 71.8%.
Which Engine Power category leads?
201-300 HP takes 39.1% of 2026 sales.
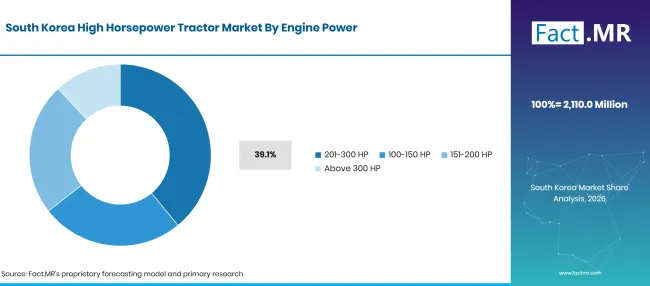
Factmr High Horsepower Tractor Market South Korea By Engine Power | Source: Fact.MR
| Engine Power | Share (2026) |
|---|---|
| 201-300 HP (Leading segment) | 39.1% |
| Other segments combined | 61.5%* |
| Total | 100.0% |
Source: Fact.MR analysis. Updated Oct 30, 2026
Commercial row-crop farms need enough drawbar pull for 12-row planters and heavy cultivators, yet most do not need an articulated machine for every task. Tractors between 201 and 300 HP handle tillage, planting and transport with a single unit, and their fuel and purchase costs stay below the costs of the classes above 300 HP. The share of land operated by large farms shapes this mix. U.S. farms with sales of USD 1 million or more averaged 2,733 acres each in 2025 [1]. Operations of that size often run one machine above 300 HP for primary tillage and several mid-power units for planting and spraying, while the farm tractors market below 100 HP serves smaller holdings.
What supports Agriculture within Application?
Agriculture represents 64.8% of 2026 revenue.
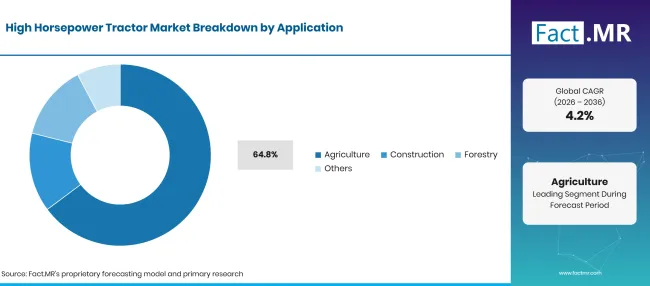
High Horsepower Tractor Market Breakdown Application | Source: Fact.MR
| Application | Share (2026) |
|---|---|
| Agriculture (Leading segment) | 64.8% |
| Other segments combined | 35.2%* |
| Total | 100.0% |
Source: Fact.MR analysis. Updated Oct 30, 2026
Grain, oilseed and forage producers put the most hours on these machines each year. Deep tillage, planting, cultivation and grain-cart work all call for sustained pulling power across thousands of hectares, and narrow seasonal windows reward machines that finish a field in fewer passes. Crop protection runs add further hours, with mounted and trailed agricultural sprayers matched to tractor hydraulics and guidance. Construction contractors use high-power tractors for earthmoving and haulage. Forestry operators deploy them alongside dedicated forestry machinery where tracked or articulated machines are not required.
How does Drive Type shape demand?
4WD claims 62.3% of the 2026 market.
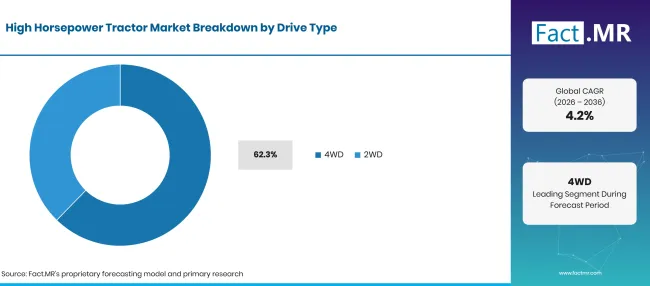
High Horsepower Tractor Market Breakdown Drive Type | Source: Fact.MR
| Drive Type | Share (2026) |
|---|---|
| 4WD (Leading segment) | 62.3% |
| Other segments combined | 37.7%* |
| Total | 100.0% |
Source: Fact.MR analysis. Updated Oct 30, 2026
Wheel slip wastes fuel and time when a tractor pulls a wide disc or ripper through heavy clay. Driving all four wheels spreads power across more contact area, which keeps the implement at working depth and reduces compaction from repeated passes. Two-wheel-drive models still suit lighter haulage and yard work, where a lower purchase price and simpler maintenance outweigh extra grip. Tracked and articulated 4WD designs serve the top of the power range, and buyers of agricultural tractors in general now treat front-axle drive as standard above 150 HP.
How does Sales Channel shape demand?
OEM channels secure 71.8% of 2026 sales.
| Sales Channel | Share (2026) |
|---|---|
| OEM (Leading segment) | 71.8% |
| Other segments combined | 28.2%* |
| Total | 100.0% |
Source: Fact.MR analysis. Updated Oct 30, 2026
A tractor in this class is a large capital purchase, and buyers want factory warranty, specification choice and dealer support in one transaction. Manufacturer dealers also arrange trade-ins and financing, which helps large farms rotate machines on a fixed cycle. The aftermarket supplies replacement parts, repairs and retrofit guidance kits over a working life that often exceeds a decade. Upkeep of existing equipment is a steady cost line: UK farms recorded equipment consumption of fixed capital of GBP 2,712 million in 2025, up from GBP 2,637 million in 2024 [6].
What is accelerating High Horsepower Tractor Market adoption, and what is holding it back?
Larger holdings, wider implements and labor costs keep large farms buying more power per operator. High purchase prices, financing costs and swings in farm income often delay replacement decisions by a season or more.
Drivers Impact Analysis
| DRIVER | (~) % IMPACT ON CAGR | GEOGRAPHIC RELEVANCE | IMPACT TIMELINE |
|---|---|---|---|
| Growing use of large implements and high-capacity machinery on commercial farms | +1.5% | Global | Medium term (2-4 years) |
| Demand for four-wheel-drive traction and efficient heavy-duty field operations | +1.1% | North America, Latin America, Western Europe | Medium term (2-4 years) |
| Integration of precision guidance, telemetry and automated machine controls | +0.9% | Global | Long term (>= 4 years) |
| Replacement of aging tractors to reduce downtime and maintenance requirements | +0.7% | Global | Short term (<= 2 years) |
Source: Fact.MR analysis. Updated Oct 30, 2026
Opportunity Impact Analysis
| OPPORTUNITY | (~) % IMPACT ON CAGR | GEOGRAPHIC RELEVANCE | IMPACT TIMELINE |
|---|---|---|---|
| Precision agriculture packages combining guidance, telemetry and implement control | +0.5% | Global | Medium term (2-4 years) |
| Higher-capacity tractors for large farms and extensive crop production | +0.4% | North America, Latin America | Medium term (2-4 years) |
| Connected service platforms and predictive maintenance for high-value equipment | +0.3% | Global | Long term (>= 4 years) |
| Flexible financing and equipment replacement programs for commercial farms | +0.2% | Latin America, North America, Western Europe | Short term (<= 2 years) |
Source: Fact.MR analysis. Updated Oct 30, 2026
Restraints Impact Analysis
| RESTRAINT | (~) % IMPACT ON CAGR | GEOGRAPHIC RELEVANCE | IMPACT TIMELINE |
|---|---|---|---|
| High upfront purchase prices and expensive financing | -0.3% | Global | Short term (<= 2 years) |
| Volatility in crop prices and farm operating margins | -0.2% | Global | Medium term (2-4 years) |
| Rising repair costs and limited access to specialist service in remote areas | -0.1% | Latin America, South Asia & Pacific | Medium term (2-4 years) |
Source: Fact.MR analysis. Updated Oct 30, 2026
Which countries are scaling the High Horsepower Tractor Market through 2036?
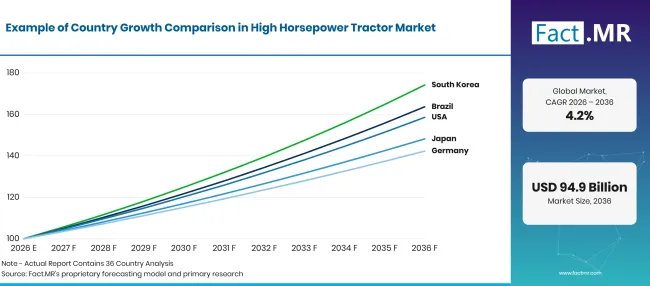
High Horsepower Tractor Market Growth Index | Source: Fact.MR
| Country | CAGR (2026 to 2036) |
|---|---|
| Brazil | 5.1% |
| United States | 4.7% |
| Japan | 4.0% |
| Germany | 3.6% |
| United Kingdom | 3.1% |
Source: Fact.MR analysis. Updated Oct 30, 2026
How is Brazil developing demand?
5.1% CAGR, driven by record grain output and the spread of large soybean and corn farms.
Brazil’s crop base keeps widening, and each new hectare needs heavy tillage, planting and haulage capacity. Conab estimated the 2025/26 grain harvest at a record 361.7 million tonnes, up 2.6% from the previous season, on 83.5 million hectares of planted area [7]. Soybean output reached 180.4 million tonnes in the same estimate [7]. Farm credit and commodity prices still set the pace of tractor purchases from one season to the next.
What is supporting the United States’ adoption?
4.7% CAGR, backed by large-acreage row-crop farms and steady fleet replacement.
American corn and soybean operations run powerful tractors for soil preparation and planting across short spring windows. National farm statistics counted 1,865,000 farms in 2025 with an average size of 469 acres [1]. Purchases remain sensitive to farm finances: the September 2026 forecast put 2026 net farm income at USD 158.4 billion, down 2.6% in nominal terms from 2025 [8]. Wheeled and tracked articulated models serve the top of the acreage range.
How does Japan perform?
4.0% CAGR, helped by consolidation of farmland into larger and corporate holdings.
Japan has long relied on compact machinery, but its farm structure is changing quickly. The 2025 Census of Agriculture and Forestry counted about 836,000 agricultural management entities, 22.3% fewer than five years earlier, while average cultivated area per entity rose to 3.6 hectares [9]. Corporate entities increased 10.1% to about 34,000 [9]. Larger rice and field-crop operators in Hokkaido form the main buyer group for tractors above 100 HP.
What supports Germany’s adoption?
3.6% CAGR, reflecting arable farms that upgrade machinery after a weak registration year.
German arable farms run wide implements on cereal, rapeseed and maize land, especially in the eastern states. The federal government reported a 2025 grain harvest of about 44.7 million tonnes, almost 15% more than in 2024 [10]. Tractor buying lagged that recovery: Fendt, citing Federal Motor Transport Authority data, reported 24,440 new tractor registrations in Germany in 2025, down 12.4% from 2024 [11]. Domestic machinery makers keep the country a reference market for high-power designs.
How is the United Kingdom scaling demand?
3.1% CAGR, as cereal farmers balance machinery needs against tight crop margins.
UK demand comes mainly from larger arable farms, where wet autumns can shrink the drilling window. Defra reported that average Farm Business Income on English cereal farms rose 20% to GBP 49,700 in 2024/25, though agri-environment and diversification income offset losses on crop enterprises [12]. Harvested wheat production reached just under 12 million tonnes in 2025, 7.3% higher than in 2024 [6]. Purchases of high-power tractors tend to slow when farm confidence weakens.
Who leads the High Horsepower Tractor Market?
Competition splits into two tiers. Full-line groups, namely John Deere, CNH (through Case IH and New Holland) and AGCO (through Fendt, Massey Ferguson and Valtra), cover every power class from mid-range row-crop tractors to articulated and tracked machines, and they win on dealer density, parts logistics and in-house guidance software.
Case IH showed this approach in September 2025 with the Steiger 785 Quadtrac, which pairs extra peak power with bundled automation packages [2]. Fendt took a similar route in August 2025, preparing its 1000 Vario Gen4 for autonomous grain-cart and tillage work [5]. CLAAS, Kubota, SDF (through Deutz-Fahr), JCB and Versatile form the second tier and compete through narrower ranges with a clear identity, such as the CLAAS Xerion, the high-speed JCB Fastrac or Versatile’s articulated 4WD models. Over the forecast period, service coverage at harvest time and automation that works across mixed fleets will separate winners from the rest.
Which companies are the key providers?
Key companies include John Deere; CNH (Case IH, New Holland); AGCO Corporation (Fendt, Massey Ferguson, Valtra); CLAAS; Kubota Corporation; SDF (Deutz-Fahr); JCB; and Versatile.
- John Deere
- CNH (Case IH, New Holland)
- AGCO Corporation (Fendt, Massey Ferguson, Valtra)
- CLAAS
- Kubota Corporation
- SDF (Deutz-Fahr)
- JCB
- Versatile
Bibliography
- [1] U.S. Department of Agriculture, National Agricultural Statistics Service. (2026, February). Farms and Land in Farms 2025 Summary.
- [2] Case IH. (2025, September 23). Case IH Unveils Its Highest Horsepower Tractor Yet with Steiger 785 Quadtrac.
- [3] OECD and FAO. (2025, July 15). OECD-FAO Agricultural Outlook 2025-2034.
- [4] U.S. Department of Agriculture, Economic Research Service. (2025, November 18). Farm Labor.
- [5] AGCO Corporation. (2025, August 26). Fendt Launches 1000 Vario Gen4 Tractor and All-New Optimum Planter at 2025 Farm Progress Show.
- [6] Department for Environment, Food & Rural Affairs. (2026, July 9). Agriculture in the United Kingdom 2025.
- [7] Agência Gov, Government of Brazil. (2026, September 15). Conab estima produção recorde na safra 2025/26 com 361,7 milhões de toneladas de grãos [Conab estimates record 2025/26 harvest of 361.7 million tonnes of grain].
- [8] U.S. Department of Agriculture, Economic Research Service. (2026, September 3). Farm Sector Income Forecast.
- [9] Ministry of Agriculture, Forestry and Fisheries, Japan. (2026, March 31).[Release of the summary of final results of the 2025 Census of Agriculture and Forestry].
- [10] Federal Government of Germany. (2025, September 3). Landwirtschaft sichert stabile Ernte trotz Wetterextremen [Agriculture secures a stable harvest despite extreme weather].
- [11] Fendt. (2026, January 16). One in four German farmers bought a Fendt tractor in 2025.
- [12] Department for Environment, Food & Rural Affairs. (2025, November 20). Farm Business Income by farm type in England 2024/25.
This Report Answers
- Revenue for high horsepower tractors is split by engine power, application, drive type and sales channel.
- Each segment shows its 2026 leader together with the field conditions that support that position.
- Farm size, crop output and farm income frame the comparison of Brazil, the United States, Japan, Germany and the United Kingdom.
- Manufacturer profiles group full-line groups and specialist builders by the power classes and drivetrains they offer.
- Impact tables rank the drivers, opportunities and restraints that shape replacement cycles and ownership costs.
What does the High Horsepower Tractor Market cover?
High horsepower tractors are machines built to deliver sustained drawbar power for heavy tillage, large-scale planting, soil preparation and the operation of wide implements. They come in wheeled, articulated and tracked layouts with different drivetrain arrangements.
Revenue is tracked across four engine power bands, four application groups, two drive types and two sales channels. Regional demand and the positions of manufacturers active in this power range complete the picture.
What is included in the scope?
New tractors rated at 100 HP and above enter the assessment when sold for agriculture, construction, forestry or other covered uses. Both rigid-frame and articulated machines count, as do wheeled and tracked versions.
Factory-fitted guidance, telematics and automation features are valued as part of the tractor price. Retrofit kits bought later through the aftermarket channel are covered within that channel, while driverless platforms tracked in the autonomous tractors study are not double counted here.
What is excluded from the scope?
Compact and utility tractors below 100 HP do not count toward market value. Standalone implements such as cultivators, planters and trailers are also left out, and so are combine harvesters and self-propelled sprayers.
Financing products and standalone service contracts are excluded. Battery-powered models covered in the electric tractors analysis are counted only where they meet the 100 HP threshold.
How Was the Analysis Built?
The analysis draws on 120+ sources, 35+ company portfolios, 25+ countries, and more than 20 industry interviews.
- Primary Research: Primary research includes discussions with manufacturers, service providers, technology developers, distributors, end users, and subject-matter experts. These conversations examine purchasing priorities, product adoption, operational challenges, approval requirements, competitive positioning, and the factors that influence wider market acceptance.
- Desk Research: Desk research covers government statistics, regulatory publications, company filings, trade data, technical studies, industry associations, standards, public policy, and other authoritative sources. Every source used in the analysis is documented in the bibliography.
- Market Sizing and Forecasting: Market estimates combine historical performance, demand indicators, pricing and volume trends, segment shares, company participation, country-level growth, adoption patterns, investment activity, and barriers to market expansion.
- Data Validation and Update Cycle: Findings are validated by comparing primary interviews with public data, company activity, regulatory changes, trade patterns, and industry developments. Regular updates review new product launches, capacity changes, partnerships, approvals, and shifts in commercial adoption.
Segmentation
What is the report’s scope and coverage?
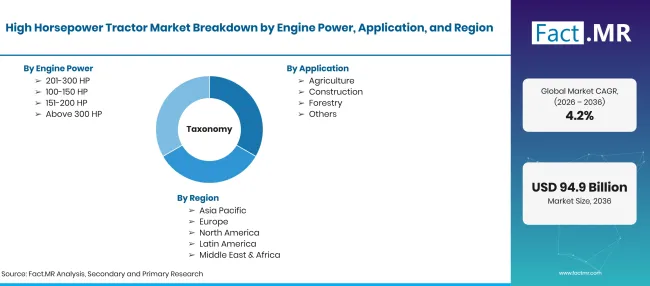
High Horsepower Tractor Market Taxonomy | Source: Fact.MR
| Attribute | Details |
|---|---|
| Quantitative Units | USD billion |
| Market Definition | New wheeled and tracked tractors rated at 100 HP and above, sold for agriculture, construction, forestry and other heavy-duty work. Value is measured at the complete-machine level. |
| Engine Power | 100-150 HP; 151-200 HP; 201-300 HP; Above 300 HP |
| Application | Agriculture; Construction; Forestry; Others |
| Drive Type | 4WD; 2WD |
| Sales Channel | OEM; Aftermarket |
| Regions Covered | North America; Latin America; Western Europe; Eastern Europe; East Asia; South Asia & Pacific; Middle East & Africa |
| Countries Covered | Brazil; United States; Japan; Germany; United Kingdom |
| Companies Profiled | John Deere; CNH (Case IH, New Holland); AGCO Corporation (Fendt, Massey Ferguson, Valtra); CLAAS; Kubota Corporation; SDF (Deutz-Fahr); JCB; Versatile |
| Forecast Period | 2026 to 2036 |
| Approach | Hybrid top-down and bottom-up approach using tractor registration and shipment indicators, farm structure data, power-class and drive-type splits, sales channel mix and manufacturer portfolio review. |
Source: Fact.MR analysis. Updated Oct 30, 2026
How is the market segmented?
-
By Engine Power
- 100-150 HP
- 151-200 HP
- 201-300 HP
- Above 300 HP
-
By Application
- Agriculture
- Construction
- Forestry
- Others
-
By Drive Type
- 4WD
- 2WD
-
By Sales Channel
- OEM
- Aftermarket
-
By Region
- North America
- Latin America
- Western Europe
- Eastern Europe
- East Asia
- South Asia & Pacific
- Middle East & Africa
Frequently Asked Questions
How large is the high horsepower tractor market in 2026?
What growth rate will the high horsepower tractor market record from 2026 to 2036?
Which engine power category leads the high horsepower tractor market?
Which application leads the high horsepower tractor market?
Which drive type leads the high horsepower tractor market?
Which sales channel leads the high horsepower tractor market?
Which country will grow the most in the high horsepower tractor market?
Who are the main companies in the high horsepower tractor market?
Who worked on this report


Preview the report firsthand - request a free sample
Free SampleGet the brochure for pricing and purchase details
Download PDF