


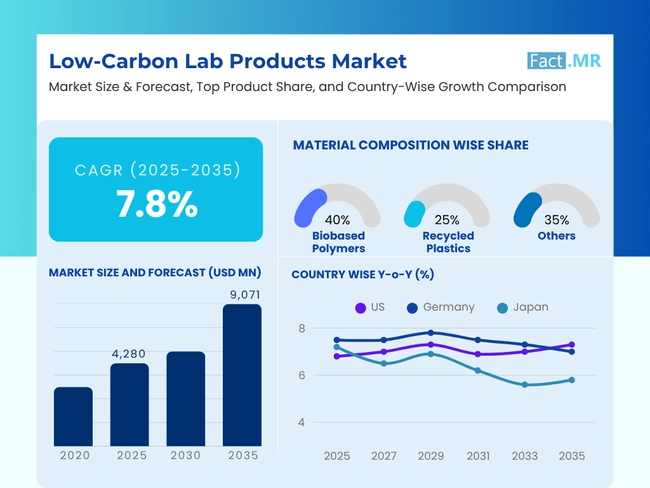
- Base Value(2025): 4280 Mn
- Forecast Value (2035): 9071 Mn
- CAGR (2035): 7.8%
Low-Carbon Lab Products Market Outlook (2025 to 2035)
The global low-carbon lab products market is expected to reach USD 9,071 million by 2035, up from USD 3,972 million in 2024. During the forecast period 2025 to 2035, the industry is projected to expand at a CAGR of 7.8%.
The market for low-carbon lab products is becoming increasingly crucial as sustainability becomes a priority for research institutes and the life sciences. Under increasing pressure from rules and regulations, as well as corporate ESG targets, there is a growing demand for sustainable consumables and equipment that are energy-efficient. Not only does this shift promote carbon reduction goals, but it also prioritizes innovation and drives progress.
What are the drivers of the low-carbon lab products market?
A convergence of regulatory, technological, and institutional forces is transforming scientific research and driving the emergence of a low-carbon lab products market. At the top of the list is the mounting pressure from governments and international agencies to reduce greenhouse gas emissions, including in the field of life sciences and research. Carbon accounting systems and carbon pricing systems, such as the EU's Carbon Border Adjustment Mechanism (CBAM), are prompting laboratories to reassess their environmental impact.
Both academic institutions and commercial laboratories are also being driven by corporate sustainability targets and environmental, social and governance (ESG) requirements to source greener solutions and implement greener practices. These are the changes towards using bioplastics, ensuring they can be recycled, and utilizing energy-efficient laboratory equipment. In addition, the sustainable management of the product lifecycle is facilitated by newer methods of green chemistry, as well as closed-loop systems for recycling laboratory plastics.
What are the regional trends of the low-carbon lab products market?
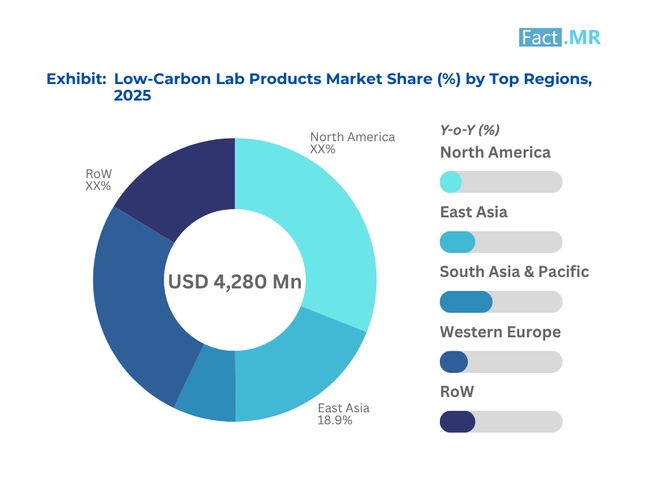
The market for low-carbon lab products varies across regions due to differing regulatory environments, varying levels of industrial maturity, and varying sustainability priorities.
First among them are North America (especially the USA), which has a robust life sciences segment and institutional investment in green projects. Federal agencies and universities are incorporating sustainability into their procurement practices, thereby driving demand for recycled labware and energy-efficient instruments.
Despite its leadership in sustainability, Europe remains dependent on regulatory mandates to drive progress. This is due to the EU's strict carbon policies, which aim to implement the Carbon Border Adjustment Mechanism (CBAM), compelling laboratories to adopt practices that reduce carbon emissions and promote a circular economy. Developed economies, such as Germany and the Netherlands, stand out due to their green chemistry centers and zero-carbon laboratory structures.
The Asia-Pacific region is developing at the fastest rate, driven by high growth in biotech and pharmaceutical research and development. Japan, China, and India are beginning to incorporate low-carbon requirements into their government research funding and industrial strategies. Southeast Asia has considerable potential that remains untapped as awareness and infrastructure develop in emerging economies.
What are the challenges and restraining factors of the low-carbon lab products market?
The low-carbon lab products market has several issues and limitation factors that may potentially inhibit its development. The increased expense of sustainable alternatives, such as bioplastics, recyclable consumables, and energy-efficient equipment, is one of the key obstacles. The prices may be a deterrent to adoption, particularly in lower-funded academic and government research and development laboratories.
In addition, the absence of universal metrics and certifications on sustainability issues further complicates the matter of procurement purchase choices, making it difficult to determine and compare green products within an institution. Such infrastructure bottlenecks as inadequate recycling infrastructure and outdated laboratory units also hinder the transition towards low-carbon alternatives.
Resistance to change within scientific communities, coupled with limited awareness of the environmental impact of traditional lab practices, is hindering the transition. The market expansion of companies with a low priority on sustainability issues in their research policies may be notably hampered in developing markets.
Country-Wise Insights
United States Push for Greener Labs Through Federal Mandates and Institutional Procurement
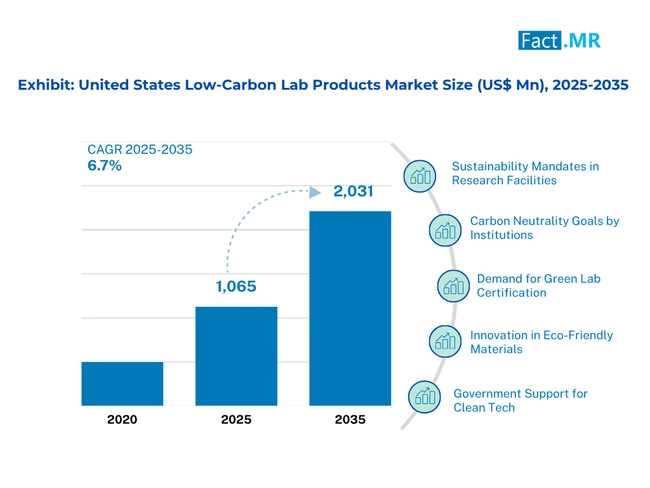
Federal sustainability requirements and a robust R&D environment in the United States define the low-carbon lab products market. Biotech companies and universities are transitioning to energy-efficient equipment, recyclable consumables, and green lab certification.
Institutional demand for zero-waste practices, circular lab programs and low-emission technologies drives the market. The low-carbon options are also gaining popularity among procurement teams as a key component of ESG strategies and LEED-compliant laboratories.
The future growth of the market will depend on domestic innovation in bioplastics, closed-loop supply chains, and AI-DS-powered efficiency tools in laboratories, accompanied by a shift in the green procurement system.
Germany’s Integration of EU Climate Policy into Low-Impact Laboratory Practices
The national energy transition in Germany and EU sustainability guidelines highly endorse the low-carbon lab products market in Germany. Life science hubs, academic research centers, green chemistry, and the pharmaceutical industry are early adopters of low-impact lab practices.
Sustainable standards have been introduced into the supply chain, emphasizing energy-efficient laboratory equipment, recyclable labware, and a waste-reducing workflow. The EU's policy tools, such as the CBAM policy or green taxonomy, influence the design and use of products.
The prospects for continued expansion of sustainable, certified product lines and lab lifecycle tracking technologies, with Germany as a global leader in the greening of the laboratory, are promising.
Japan’s National Net-Zero Targets Driving Cleanroom Innovation and Energy Efficiency
The adoption of low-carbon lab products in Japan is influenced by the government's decarbonization goals and industry-initiated sustainability statements. Research institutes are taking greener options in place of lab equipment and consumables.
Favorable policies, including the Green Innovation Fund and energy efficiency standards, are also stimulating the use of smart, low-energy lab systems and consumable, recyclable products. Integrating hydrogen and solar power is also being experimented upon in labs.
Category-Wise Analysis
Low-Carbon Consumables: Reducing Plastic Dependence at Scale
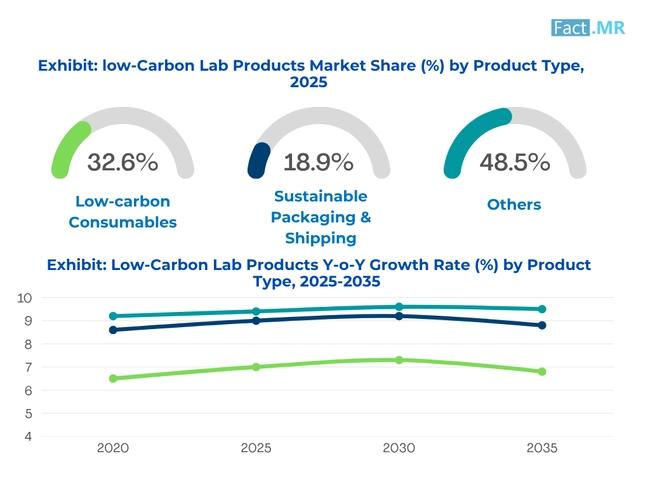
The biggest and most direct opportunity to make an immediate impact with sustainability in laboratories is the use of low-carbon consumables. Such items are pipette tips, PCR plates, cryovials, and many more. Of high volume and single-use to maintain sterility. Various labs are now interested in minimizing their environmental impact, and suppliers are redesigning these products with cleaner materials and processes.
The high frequency of adoption means that material sustainability can be improved in small steps, which still makes a significant overall impact. Lab certifications, such as My Green Lab Certification, and zero-waste purchasing policies are motivating labs to transition to lower-carbon plastic consumable materials. Replacements that are cost-effective and equal to or similar in performance are essential in the decision-making process of buyers.
Biobased Polymers: The Backbone of Green Lab Materials
Bio-based polymers, such as PLA (polylactic acid), PHA (polyhydroxyalkanoates), and bio-PE (bio-based polyethylene), are becoming fundamental materials in low-carbon lab product development. Based on renewable biopolymers such as corn starch, sugarcane, and algae, these polymers have a significantly lower carbon footprint, which compares favorably to that of conventional plastics.
This makes them suitable for the circular economy, as they can be recycled or biodegrade depending on the type of polymer used. They find more and more applications in consumables such as pipette tips, glassware and packaging inserts. Their prevalence in the market is further boosted by global regulations supporting bio-preferred materials and bans on plastics in various regions.
Competitive Analysis
Key players in the low-carbon lab products industry include Eppendorf SE, Thermo Fisher Scientific Inc., Corning Incorporated, Merck KGaA (MilliporeSigma), Greiner Bio-One, DWK Life Sciences, Beckman Coulter (Danaher Corporation), Hamilton Company, Avantor Inc., Mettler Toledo, Bio-Rad Laboratories, Inc., and TerraCycle.
There is a significant shift in the low-carbon lab products market due to the increasing demand for sustainable solutions in the laboratory. In this market, several developments suggest that it is shifting towards environmentally friendly practices, including recyclable plastics, energy-efficient instrumentation, and closed-loop recycling systems.
Companies that strive to minimize their environmental impact while meeting high-performance requirements are utilizing bio-based materials, modular labware, and digital integration. This is also enhanced by the presence of regulatory pressure and institutional purchase policies, which support the preference for green-certified products.
These product-sustainability dynamics are making competitive forces even fiercer as incumbents consolidate their sustainable products and neo-competitors provide disruption in the form of circular economy solutions. The action of mergers and acquisitions, as well as strategic alliances, is an uncommon strategy that also pursues the goal of improving environmental compliance and achieving production scale. Benchmarking of sustainability and life cycle assessments are also being promoted as a competitive tool to be applied when choosing vendors.
Recent Development
- In March 2025, Thermo Fisher Scientific debuted its Sustain line of biobased lab plastics made from second-generation feedstocks. Certified under the ISCC mass balance, these products chemically match conventional plastics, eliminating the need for revalidation. With a carbon footprint 50% lower, the launch enabled labs to reduce emissions without compromising performance. The move aligned with global sustainability goals for the scientific community.
- In March 2025, Thermo Fisher Scientific partnered with Polycarbin to co-develop low-carbon lab consumables made from recycled materials, thereby reducing reliance on fossil fuels in liquid-handling plastics. The collaboration expanded closed-loop recycling to divert waste from landfills. Products featured third-party-verified sustainability metrics, helping labs align budgets with eco-goals while maintaining performance. The move advanced green lab initiatives across the industry.
Fact.MR has provided detailed information about the price points of key manufacturers in the Low-Carbon Lab Products Market, positioned across regions, including sales growth, production capacity, and speculative technological expansion, in the recently published report.
Methodology and Industry Tracking Approach
The 2025 low-carbon lab products market report by Fact.MR is built upon insights from 3,200 stakeholders across 18 countries, with a minimum of 100 respondents per country. Among these participants, 65% were end users, including pharmaceutical manufacturers, biotech firms, clinical diagnostic labs, and academic research institutions, while the remaining 35% comprised procurement heads, sustainability officers, product development managers, and regulatory compliance specialists.
Data collection was conducted between June 2024 and May 2025, with a focused evaluation of critical factors, including material recyclability, energy efficiency of laboratory instruments, lifecycle carbon footprint, alignment with green procurement policies, and compliance with evolving environmental certifications and safety regulations. A regionally weighted calibration model was employed to ensure equitable representation across all major demand and supply centers.
The analysis incorporated data from over 120 validated sources, including scientific publications, ACT label databases, ISO compliance records, safety data sheets (SDS), and ESG disclosures from top-tier manufacturers, thereby triangulating market estimates and ensuring accuracy in the final findings.
Fact.MR applied rigorous analytical tools, such as multivariate regression and scenario modeling, to ensure data robustness. With continuous monitoring of the low-carbon lab products market since 2018, this report provides a comprehensive roadmap for firms seeking a competitive advantage, innovation, and sustainable growth within the sector.
Segmentation of Low-Carbon Lab Products Market
-
By Product Type :
- Low-carbon Consumables
- Pipette tips
- PCR plates
- Cryovials
- Reusable Labware
- Glass beakers
- Refillable reagent bottles
- Stainless steel scoops
- Sustainable Packaging & Shipping
- Recyclable cartons
- Compostable insulation
- Reusable cold chain boxes
- Low-Emission Instruments
- Energy-efficient -80°C freezers
- Inverter-driven centrifuges
- Auto shut-off fume hoods
- Eco Cleaning & Sterilization
- Biodegradable detergents
- UV surface sterilizers
- Low-temperature autoclaves
- Zero-Waste Accessories
- Compostable nitrile gloves
- Bamboo cotton swabs
- Recyclable pipette tip racks
- Low-carbon Consumables
-
By Material Composition :
- Biobased Polymers (PLA, PHA, bio-PE)
- Recycled Plastics (rPET, rPP, rHDPE)
- Glass & Ceramics
- Paper & Natural Fibers
- Hybrid/Composite Materials)
-
By Laboratory Workflow/Application :
- Sample Collection & Preparation
- Molecular & Cell Biology
- Analytical Chemistry & Chromatography
- Sterilization & Waste Management
- Cold Storage & Transport
-
By Region :
- North America
- Latin America
- Western Europe
- Eastern Europe
- East Asia
- South Asia & Pacific
- Middle East & Africa
- Frequently Asked Questions -
What was the Global Low-Carbon Lab Products Market Size Reported by Fact.MR for 2025?
The global low-carbon lab products market was valued at USD 4,280 million in 2025.
Who are the Major Players Operating in the Low-Carbon Lab Products Market?
Prominent players in the market are Eppendorf SE, Thermo Fisher Scientific Inc., Corning Incorporated, Merck KGaA (MilliporeSigma), among others.
What is the Estimated Valuation of the Low-Carbon Lab Products Market in 2035?
The market is expected to reach a valuation of USD 9,071 million in 2035.
What Value CAGR did the Low-Carbon Lab Products Market Exhibit Over the Last Five Years?
The historic growth rate of the low-carbon lab products market was 7.2% from 2020 to 2024.