- Market Value (2025): USD 6.05 Bn
- Estimated Value (2026): USD 6.45 Bn
- Forecast Value (2036): USD 12.2 Bn
- CAGR (2026-2036): 6.5%
What is the Military Power Solutions Market forecast to be worth by 2036?
USD 6.45 billion in 2026 to USD 12.2 billion by 2036 at a 6.5% CAGR.
- Military power solutions revenue totalled USD 6.05 billion in 2025, with generator sets and electrical power systems already in service across defence fleets and installations.
- Revenue will grow from USD 6.45 billion in 2026 to USD 12.2 billion by 2036 as armed forces modernise platforms and carry heavier electronic loads into the field.
- A 6.5% CAGR through 2036 reflects steady fleet renewal combined with new spending on hybrid power, energy storage and tactical microgrids.
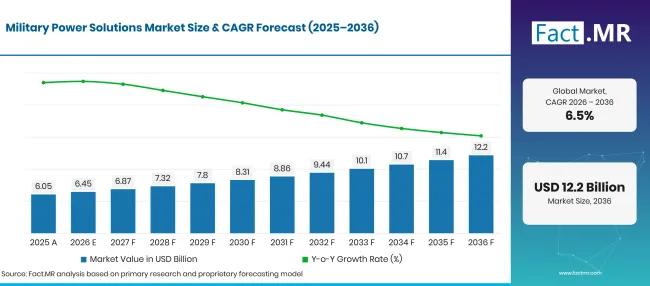
Military Power Solutions Market Forecast Global | Source: Fact.MR
| Year | Basis | Market Value (USD billion) |
|---|---|---|
| 2025 | Actual | 6.05 |
| 2026 | Estimate | 6.45 |
| 2036 | Forecast | 12.2 |
| CAGR 2026 to 2036 | Forecast period | 6.5% |
Source: Fact.MR analysis. Updated Nov 5, 2026
What are the defining numbers behind Military Power Solutions Market growth?
The 2026 to 2036 period adds USD 5.7 billion in new value, centred on non-portable systems, generator-based supply and land platforms.
- Demand Drivers in the Market
- Higher defence budgets are funding new equipment across allied forces. NATO estimates that real defence expenditure by its European members and Canada grew by about 15.94% in 2025 [1]. Part of this money flows into vehicles, ships and command systems that each need dedicated power equipment.
- Field units want to run longer without a generator. In U.S. Army exercises described in August 2025, insertion teams operated for 56 to 96 hours on one energy storage module and one power distribution module [2]. Results like these push buyers toward modular storage that cuts fuel resupply and noise.
- Soldier-carried electronics are raising the weight of batteries in each rucksack. The Army’s Soldier Wearable Power Generator 2.0 weighs under 3 pounds and aims to save a soldier about 20 pounds of battery weight on extended missions [3]. Compact generation of this kind opens a new product line for portable power suppliers.
- Energy resilience at fixed bases is moving up the investment agenda. Defence estates need secure generation, storage and switching so that radar sites, data centres and command posts keep running during grid outages.
- Key Segments Analyzed
- By Product Type: Non-Portable systems will capture 53.7% share in 2026, since bases, ships and large platforms need high-capacity power that runs around the clock.
- By Energy Sources: Generators will account for 28.4% of 2026 value, given their ability to supply electricity wherever no grid connection exists.
- By Application: Land will hold 38.2% of 2026 revenue, as armoured vehicles, ground command posts and air defence units carry growing onboard electrical loads.
- Analyst Opinion at Fact.MR
- Shambhu Nath Jha, Principal Consultant at Fact.MR, states, “Armed forces will treat electrical power as a combat supply line that is planned as carefully as fuel or ammunition. Hybrid sets that combine generators with modular batteries will replace many stand-alone diesel units at command posts and forward bases. Suppliers that can prove low weight, low signature and plug-in compatibility with existing vehicles will gain the most from the next wave of programmes.”
- Strategic Implications
- Manufacturers should design generator sets, storage modules and distribution boxes to common interface standards, since tactical microgrid compliance is becoming a condition of entry in army tenders.
- Platform integrators should bring power architecture into the earliest design phase of new vehicles and ships, as retrofitting extra electrical capacity later costs far more.
- Defence ministries should plan energy as a supply class with forecasts of daily kilowatt-hour demand per unit, which allows smaller generators and fewer fuel convoys.
- Investors should look at firms with qualified rugged power electronics and battery management, because these components appear in almost every new defence platform.
Germany leads the five assessed countries at 7.5%, as a defence budget of more than EUR 108 billion for 2026 turns into orders for vehicles and field energy systems. Brazil follows 0.7 points lower at 6.8%, with a renewed national defence strategy favouring domestic industry. The United States reaches 6.2%; its installed base is already large, so growth comes mainly from replacement and microgrid upgrades. The United Kingdom stands at 5.5%, linked to a staged rise in spending toward 2.5% of GDP. Japan closes the range at 4.9%, where budget gains go largely to missiles and unmanned assets. That leaves a smaller share for field power.
How does the Military Power Solutions Market break down by segment?
Non-Portable systems will lead Product Type at 53.7%; Generators will head Energy Sources at 28.4%; Land will hold Application at 38.2% in 2026.
Which Product Type leads?
Non-Portable systems take 53.7% of 2026 sales.
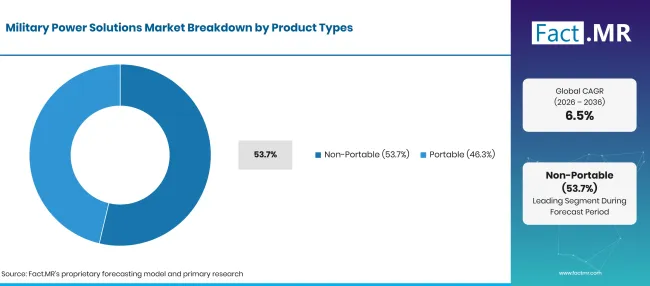
Military Power Solutions Market Breakdown Product Types | Source: Fact.MR
| Product Type | Share (2026) |
|---|---|
| Non-Portable systems (Leading segment) | 53.7% |
| Other segments combined | 46.3%* |
| Total | 100.0% |
Source: Fact.MR analysis. Updated Nov 5, 2026
Fixed bases, naval vessels, airfields and large command centres draw power around the clock and cannot depend on a single small unit. These sites install high-capacity generator sets, switchgear, uninterruptible supplies and distribution networks sized for continuous duty. Many are moving toward fixed microgrids that link several large generators with battery storage so that one failure does not take a site offline. Portable systems cover man-packable generators, soldier batteries, chargers and small solar kits. Their unit value is lower, but volumes rise with every new radio, drone and night-vision device issued to troops. Commercial designs such as the portable inverter generator often serve as the starting point for rugged military versions.
What supports Generators within Energy Sources?
Generators represent 28.4% of 2026 revenue.
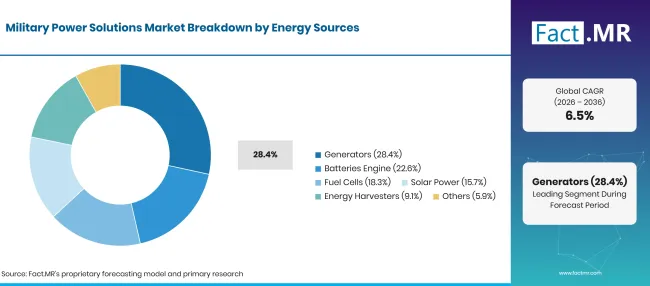
Military Power Solutions Market Breakdown Energy Sources | Source: Fact.MR
| Energy Sources | Share (2026) |
|---|---|
| Generators (Leading segment) | 28.4% |
| Other segments combined | 71.6%* |
| Total | 100.0% |
Source: Fact.MR analysis. Updated Nov 5, 2026
Expeditionary forces still rely on fuel-burning sets because they deliver steady electricity in places with no grid at all. Sizing is now under scrutiny. During the Lethal Eagle 24.1 exercise, 15 kW and 30 kW generators often ran below 10% of capacity, which wasted fuel and added to the unit’s signature [2]. Buyers therefore favour smaller sets and multi-fuel designs, including tri-fuel generator units that run on more than one fuel. Batteries form the second pillar, as rechargeable chemistries based on the lithium-ion battery replace older primary cells in radios and vehicles. Fuel cells suit silent watch and long-endurance drones. Solar power and energy harvesting systems supply small loads at remote outposts and sensor sites.
What leads the Application segment?
Land accounts for 38.2% of 2026 demand.
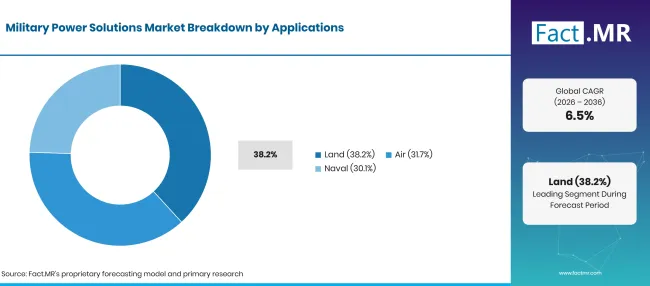
Military Power Solutions Market Breakdown Applications | Source: Fact.MR
| Application | Share (2026) |
|---|---|
| Land (Leading segment) | 38.2% |
| Other segments combined | 61.8%* |
| Total | 100.0% |
Source: Fact.MR analysis. Updated Nov 5, 2026
Ground forces run the widest mix of powered equipment, from tanks and infantry carriers to mobile radars and air defence batteries. The U.S. Army alone accounts for USD 197.4 billion of the proposed FY2026 defence budget [4]. Modern armored vehicle designs carry digital fire control, sensors and jammers that push onboard power needs well beyond older fleets. Air applications include aircraft generators, power conversion and distribution units, where weight and cooling limits drive design. Naval demand comes from shipboard generator sets and power systems for radar, combat management and future directed energy weapons. Both segments rely on long qualification cycles, so suppliers keep their positions for many years once selected.
What is accelerating Military Power Solutions Market adoption, and what is holding it back?
Rising defence budgets and the spread of electronics across every platform keep orders for generators, batteries and power conversion equipment growing. Field results with modular storage are also changing how armies plan energy. High system costs, fuel logistics and long qualification programmes slow the pace at which new technology reaches units.
Drivers Impact Analysis
| DRIVER | (~) % IMPACT ON CAGR | GEOGRAPHIC RELEVANCE | IMPACT TIMELINE |
|---|---|---|---|
| Modernization of military platforms and growing onboard electrical loads | +2.1% | Global | Long term (>=4 years) |
| Increasing use of mobile tactical generators and battlefield power systems | +1.7% | North America, Western Europe, East Asia | Medium term (2-4 years) |
| Expansion of advanced batteries and energy storage for defence electronics | +1.3% | North America, Western Europe, East Asia | Medium term (2-4 years) |
| Growing adoption of hybrid power systems and alternative energy technologies | +0.9% | Global | Long term (>=4 years) |
| Rising investment in resilient power infrastructure across military installations | +0.5% | North America, Western Europe, Asia-Pacific | Short term (<=2 years) |
Source: Fact.MR analysis. Updated Nov 5, 2026
Opportunity Impact Analysis
| OPPORTUNITY | (~) % IMPACT ON CAGR | GEOGRAPHIC RELEVANCE | IMPACT TIMELINE |
|---|---|---|---|
| Lightweight portable power systems for soldiers and tactical units | +1.1% | North America, Western Europe, East Asia | Medium term (2-4 years) |
| Hybrid generator and battery systems for remote military deployments | +0.8% | Global | Medium term (2-4 years) |
| Fuel cell integration for low-signature military power applications | +0.6% | North America, Western Europe, East Asia | Long term (>=4 years) |
| Solar and energy harvesting technologies for remote defence installations | +0.4% | Asia-Pacific, Latin America, Middle East | Long term (>=4 years) |
Source: Fact.MR analysis. Updated Nov 5, 2026
Restraints Impact Analysis
| RESTRAINT | (~) % IMPACT ON CAGR | GEOGRAPHIC RELEVANCE | IMPACT TIMELINE |
|---|---|---|---|
| High development and installation costs of advanced military power systems | -1.2% | Global | Short term (<=2 years) |
| Dependence on fuel availability and transportation across remote operating locations | -0.9% | Global | Medium term (2-4 years) |
| Complex integration and qualification requirements across military platforms | -0.6% | North America, Western Europe, East Asia | Medium term (2-4 years) |
| Battery performance limitations under extreme temperatures and demanding field conditions | -0.4% | Global | Long term (>=4 years) |
Source: Fact.MR analysis. Updated Nov 5, 2026
Which countries are scaling the Military Power Solutions Market through 2036?
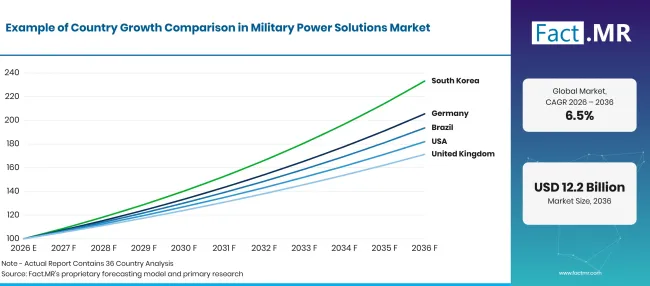
Military Power Solutions Market Growth Index | Source: Fact.MR
| Country | CAGR (2026 to 2036) |
|---|---|
| Germany | 7.5% |
| Brazil | 6.8% |
| United States | 6.2% |
| United Kingdom | 5.5% |
| Japan | 4.9% |
Source: Fact.MR analysis. Updated Nov 5, 2026
What supports adoption in Germany?
7.5% CAGR, backed by a sharp rise in Bundeswehr procurement funding.
In November 2025, the Bundestag budget committee approved the 2026 defence budget and the Bundeswehr special fund with a combined volume of more than EUR 108 billion [5]. Much of this goes to armoured vehicles, air defence and logistics fleets, each of which needs onboard generators and field power. German suppliers of mobile energy systems are well placed to win this work close to home.
How is Brazil developing demand?
6.8% CAGR, helped by an updated national defence policy that favours local capability.
Decree No. 12,725 of 18 November 2025 approved the National Defence Policy, the National Defence Strategy and the National Defence White Paper [6]. These documents set the priorities for the armed forces and for the domestic defence industry. Brazil’s long borders, Amazon garrisons and coastal patrol duties make off-grid power a recurring need for remote units.
What is shaping the United States’ adoption?
6.2% CAGR, as tactical microgrids and battlefield electrification reshape Army power planning.
NATO estimates that U.S. defence spending equalled 3.22% of GDP in 2025, with 29.69% of that spending going to equipment [1]. The Army’s Tactical Microgrid Standard (MIL-STD-3071) sets interoperability criteria for the hardware and software that link generation, storage and distribution in the field [7]. Vendors that certify to this standard gain access to the next round of Army power programmes.
What supports adoption in the United Kingdom?
5.5% CAGR, reflecting a staged increase in defence spending and a stronger domestic supply base.
The Strategic Defence Review 2025 commits the government to raise defence spending to 2.5% of GDP by 2027 [8]. Ministry of Defence spending with UK industry reached GBP 31.7 billion in 2024/25, a 6% rise in real terms [9]. This growing domestic spend supports British makers of vehicle power systems, naval generators and rugged electronics.
How does Japan perform?
4.9% CAGR, driven by a growing defence budget that leans toward unmanned and coastal defence assets.
Japan’s Ministry of Defense requested JPY 8,845.4 billion for FY2026, up 4.4% on the FY2025 budget [10]. The request includes about JPY 312.8 billion for unmanned defence capabilities, such as long-endurance drones and ground vehicles that work with them. Each new unmanned fleet brings demand for ground stations, charging equipment and compact power supplies.
Who leads the Military Power Solutions Market?
Competition splits into three groups with different strengths. Aerospace and naval power specialists such as RTX through Collins Aerospace and Rolls-Royce supply generation and distribution systems designed into aircraft and ships, and they hold those positions for the life of each platform. Power electronics firms such as Eaton, Vicor, Crane Company and Espey Manufacturing & Electronics Corp. form a second group that competes on converter density, MIL-STD qualification and reliability. Vicor showcased rugged power modules and VITA and SOSA aligned supplies at the Land Forces exposition in Perth in October 2026 [11].
The third group builds mobile field energy. VINCORION presented modular tactical power systems in 20 kW, 50 kW and 200 kW classes in June 2026, which can be networked to provide more than 1 MW [12]. Through 2036, the edge will go to suppliers that combine low weight with open interfaces and long-term support.
Which companies are the key providers?
Key companies include RTX Corporation (Collins Aerospace), Eaton Corporation, Vicor Corporation, Crane Company, Rolls-Royce, VINCORION and Espey Manufacturing & Electronics Corp.
- RTX Corporation (Collins Aerospace)
- Eaton Corporation
- Vicor Corporation
- Crane Company
- Rolls-Royce
- VINCORION
- Espey Manufacturing & Electronics Corp.
Bibliography
- [1] NATO. (2025, August 28). Defence Expenditure of NATO Countries (2014-2025).
- [2] U.S. Army. (2025, August 18). Best Practices on Operationalizing Battlefield Energy.
- [3] U.S. Army. (2026, June 10). Army energizes wearable power systems research for improved Soldier tactical power.
- [4] U.S. Department of War. (2025, June 26). Senior Officials Outline President’s Proposed FY26 Defense Budget.
- [5] Bundesministerium der Verteidigung. (2025, November 14). Investitionen in unsere Sicherheit: Verteidigungshaushalt 2026.
- [6] Ministério da Defesa. (2026, July 1). Políticas e Estratégias Nacionais.
- [7] U.S. Army Batteries. (2026, July 14). TMS: U.S. Army Batteries.
- [8] Ministry of Defence. (2025, June 2). The Strategic Defence Review 2025: Making Britain Safer: secure at home, strong abroad.
- [9] Ministry of Defence. (2025, September 11). British economy sees defence dividend as new figures reveal above inflation increase in spend with industry.
- [10] Ministry of Defense of Japan. (2025, September 24). Progress and Budget in Fundamental Reinforcement of Defense Capabilities: Overview of FY2026 Budget Request.
- [11] Vicor Corporation. (2026, September 15). Vicor to Showcase Power-Dense, Scalable DC-DC Converter Portfolio at Land Forces Event in Perth, Australia.
- [12] VINCORION. (2026, June 18). Mobile Energy Systems for Future-Proof Deployment Scenarios.
This Report Answers
- How is revenue split between non-portable and portable military power systems?
- Why do generators keep the top position among energy sources, and how is hybrid storage changing their role?
- What makes land platforms the main application, and how are air and naval needs developing?
- Where do batteries, fuel cells, solar power and energy harvesting fit into military energy plans?
- How do defence budgets in Germany, Brazil, the United States, the United Kingdom and Japan shape country growth?
- Which supplier groups compete in this space, and what will separate winners from the rest?
What does the Military Power Solutions Market cover?
This market tracks equipment used to generate, store, convert and distribute electrical power across military platforms and defence infrastructure. Generator sets, batteries, fuel cells and solar equipment form the main product categories.
Revenue is valued at the equipment level across land, air and naval applications. Power conversion units, distribution components and energy management systems are counted when sold as part of a military power solution.
What is included in the scope?
Portable tactical generators, fixed military generator sets and military-grade rechargeable and primary batteries are included.
Fuel cell systems, solar kits and energy harvesting devices built or adapted for defence use are counted.Power conversion units, distribution boxes, energy storage modules and microgrid controllers form part of the scope when sold for military platforms or installations.Equipment fitted to ground vehicles, aircraft and naval vessels is covered, along with field command posts and defence bases.
What is excluded from the scope?
Civilian generators, commercial consumer batteries and residential solar systems fall outside the scope unless designed or adapted for military use.
Vehicle engines and propulsion systems sold without an electrical generation function are not counted.Fuel purchases, grid electricity charges and general maintenance services are left out.
Stand-alone weapons, radios and electronic warfare equipment are excluded unless their power units can be identified separately.
How Was the Analysis Built?
The analysis draws on 120+ sources, 35+ company portfolios, 25+ countries, and more than 20 industry interviews.
- Primary Research: Primary research includes discussions with manufacturers, service providers, technology developers, distributors, end users, and subject-matter experts. These conversations examine purchasing priorities, product adoption, operational challenges, approval requirements, competitive positioning, and the factors that influence wider market acceptance.
- Desk Research: Desk research covers government statistics, regulatory publications, company filings, trade data, technical studies, industry associations, standards, public policy, and other authoritative sources. Every source used in the analysis is documented in the bibliography.
- Market Sizing and Forecasting: Market estimates combine historical performance, demand indicators, pricing and volume trends, segment shares, company participation, country-level growth, adoption patterns, investment activity, and barriers to market expansion.
- Data Validation and Update Cycle: Findings are validated by comparing primary interviews with public data, company activity, regulatory changes, trade patterns, and industry developments. Regular updates review new product launches, capacity changes, partnerships, approvals, and shifts in commercial adoption.
Segmentation
What is the report’s scope and coverage?
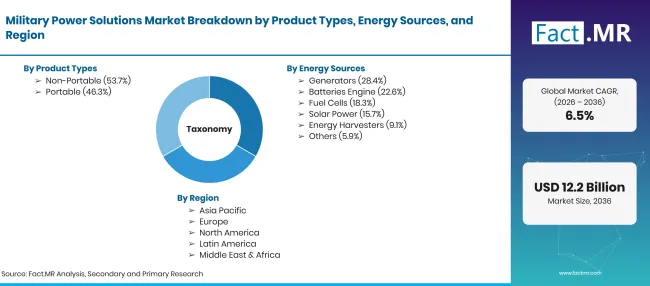
Military Power Solutions Market Taxonomy | Source: Fact.MR
| Attribute | Details |
|---|---|
| Quantitative Units | USD billion |
| Market Definition | Equipment that generates, stores, converts and distributes electrical power for defence platforms, military installations and tactical operations. |
| Product Type | Non-Portable; Portable |
| Energy Sources | Generators; Batteries; Fuel Cells; Solar Power; Energy Harvesters; Others |
| Application | Land; Air; Naval |
| Regions Covered | North America; Latin America; Western Europe; Eastern Europe; East Asia; South Asia & Pacific; Middle East & Africa |
| Countries Covered | Germany; Brazil; United States; United Kingdom; Japan |
| Companies Profiled | RTX Corporation (Collins Aerospace); Eaton Corporation; Vicor Corporation; Crane Company; Rolls-Royce; VINCORION; Espey Manufacturing & Electronics Corp. |
| Forecast Period | 2026 to 2036 |
| Approach | Hybrid top-down and bottom-up model built from defence expenditure patterns, platform power requirements, energy source and application mix, and supplier portfolio review. |
Source: Fact.MR analysis. Updated Nov 5, 2026
How is the market segmented?
-
By Product Type
- Non-Portable
- Portable
-
By Energy Sources
- Generators
- Batteries
- Fuel Cells
- Solar Power
- Energy Harvesters
- Others
-
By Application
- Land
- Air
- Naval
-
By Region
- North America
- Latin America
- Western Europe
- Eastern Europe
- East Asia
- South Asia & Pacific
- Middle East & Africa
Frequently Asked Questions
How large is the Military Power Solutions Market in 2026?
What growth rate will the Military Power Solutions Market record from 2026 to 2036?
Which product type leads the Military Power Solutions Market?
Which energy source holds the greatest share?
Which application contributes the most?
Which country will grow quickest?
Who are the main companies?
What holds the market back?
Who worked on this report


Preview the report firsthand - request a free sample
Free SampleGet the brochure for pricing and purchase details
Download PDF