- Market Value (2025): USD 4.0 Bn
- Estimated Value (2026): USD 4.6 Bn
- Forecast Value (2036): USD 19.9 Bn
- CAGR (2026-2036): 15.8%
What is the Perimeter Sensing Satellites Market forecast to be worth by 2036?
USD 4.6 Billion in 2026 to USD 19.9 Billion by 2036 at a 15.8% CAGR.
- The Perimeter Sensing Satellites Market reached USD 4.0 Billion in 2025.
- Demand is projected to increase from USD 4.6 Billion in 2026 to USD 19.9 Billion by 2036.
- The market is forecast to record 15.8% CAGR from 2026 to 2036 as defence teams and border agencies adopt faster satellite surveillance.
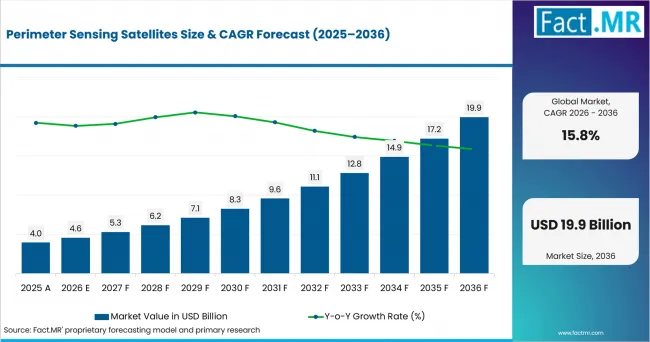
Perimeter Sensing Satellites Value Analysis | Source: Fact.MR
What are the defining numbers behind Perimeter Sensing Satellites Market growth?
An absolute opportunity of USD 15.3 Billion is expected between 2026 and 2036.
- Demand Drivers in the Market
- Defence space teams need persistent perimeter visibility as missile warning and theatre surveillance programs move toward wider sensor coverage.
- Border agencies need faster revisit over land borders because smuggling routes shift before patrol teams can cover wide terrain.
- Coast guards need maritime perimeter detection that links vessel behavior with RF and SAR observations during cloudy or night conditions.
- Critical infrastructure operators need remote watch around ports and energy assets where ground sensor coverage remains costly to extend.
- Key Segments Analyzed
- By Sensor: EO / optical is estimated to hold 31.0% share in 2026 because visual confirmation remains central to border and infrastructure watch missions.
- By Security Mission: Border monitoring is projected to account for 34.0% share in 2026 as agencies need recurring evidence over long border corridors.
- By Orbit: LEO sun-synchronous is anticipated to capture 43.0% share in 2026 due to repeatable daylight passes and predictable revisit planning.
- By Customer: Defence is forecast to represent 38.0% share in 2026 owing to mission budgets tied to ISR and strategic warning.
- Analyst Opinion at Fact.MR
- Shambhu Nath Jha, Principal Consultant at Fact.MR, states, "Perimeter sensing is becoming a tasking and trust problem beyond satellite-capacity alone. Agencies are expected to favor providers that combine sensor diversity with secure delivery and clear revisit commitments. The suppliers with stronger positions are those that connect imagery, radar, RF signals and alerting into one mission workflow."
- Strategic Implications
- Satellite operators should document revisit intervals by mission type so defence users can compare tasking reliability across border and maritime areas.
- Analytics providers should connect detection outputs to analyst review workflows so perimeter alerts become easier to approve and act on.
- Ground-segment teams should strengthen encryption, access control and audit logs before sensitive border data moves into shared systems.
- Channel partners should build training around EO, SAR and RF interpretation so agency users can read multi-sensor outputs consistently.
The USA is projected to post 17.6% CAGR through 2036, driven by defence-space buying and commercial GEOINT access. France is expected to record 17.2% CAGR through 2036, supported by sovereign space strategy and military observation demand. Finland is forecast to advance at 16.8% CAGR through 2036, attributable to NATO alignment and Arctic border coverage needs. Germany is anticipated to hold 16.5% CAGR through 2036, reinforced by its national space safety and security strategy. Japan is estimated to reach 14.8% CAGR through 2036, led by space-domain defence and island perimeter monitoring.
How does the Perimeter Sensing Satellites Market break down by segment?
EO / optical leads Sensor at 31.0% share in 2026; Defence leads Customer at 38.0% share.
Which Sensor dominates?
EO / optical is expected to hold 31.0% share in 2026.
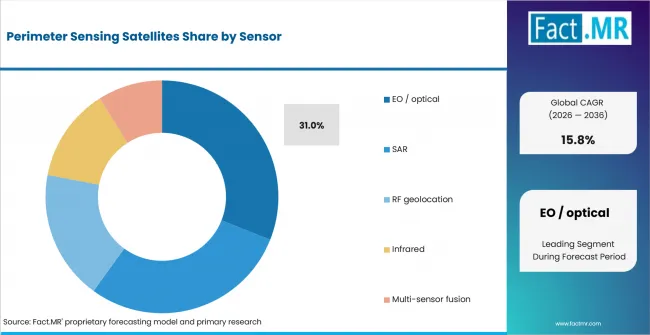
Perimeter Sensing Satellites Analysis By Sensor | Source: Fact.MR
EO / optical leads because security users still need visual confirmation of vehicles, vessels and infrastructure changes. Optical imagery is easier to brief to non-technical decision makers and supports evidence review after an alert is generated by radar or RF sensors.
The segment benefits from high-resolution tasking fleets that can support base surveillance and infrastructure monitoring. SAR and RF geolocation still gain share where weather, darkness or emissions intelligence carry greater mission value.
What leads the Security Mission segment?
Border monitoring is projected to account for 34.0% share in 2026.
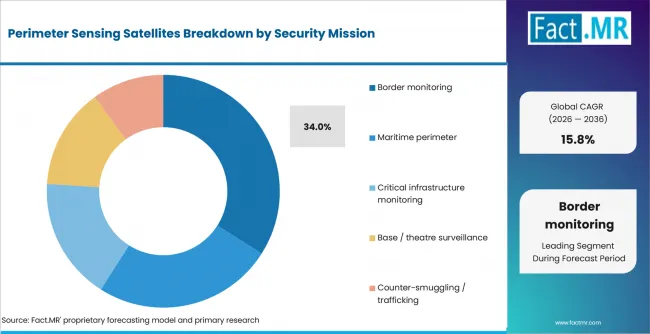
Perimeter Sensing Satellites Analysis By Security Mission | Source: Fact.MR
Border monitoring leads because the target area is wide and access conditions vary by terrain. Satellite-based sensing gives agencies a repeatable way to review corridor changes before ground teams are directed toward a specific location.
The mission fit is strongest where optical confirmation is combined with radar continuity and RF geolocation. Border users value data that narrows patrol workload and supports records for enforcement or security review.
How does Orbit shape demand?
LEO sun-synchronous is anticipated to lead with 43.0% share in 2026.
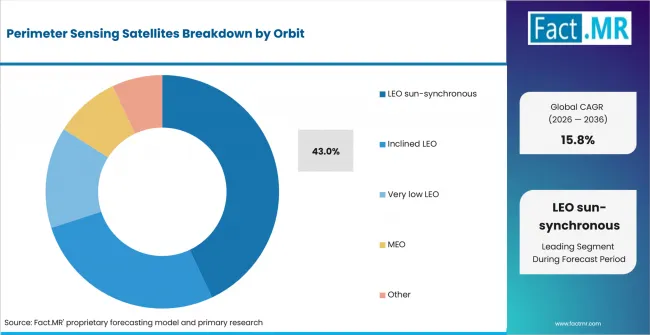
Perimeter Sensing Satellites Analysis By Orbit | Source: Fact.MR
LEO sun-synchronous orbit leads because repeatable pass timing supports routine perimeter review. Agencies can compare imagery under similar lighting conditions and build monitoring schedules around predictable revisit windows.
Inclined LEO remains relevant for rapid coverage over lower-latitude maritime and theatre missions. Very low LEO is expected to attract attention where higher image clarity justifies closer orbit management and shorter satellite life.
What supports demand for Defence within Customer?
Defence is forecast to represent 38.0% share in 2026.
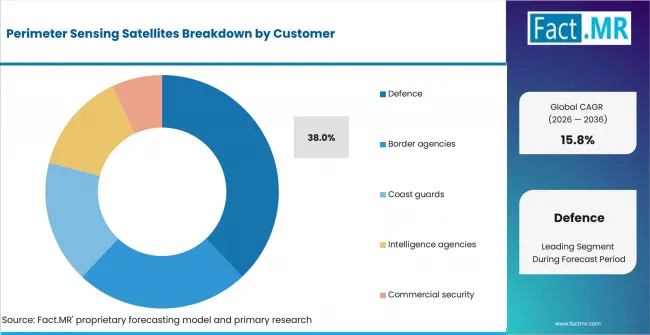
Perimeter Sensing Satellites Analysis By Customer | Source: Fact.MR
Defence leads because perimeter sensing supports warning, targeting support and operational awareness. These users require secure tasking and trusted delivery because satellite outputs often feed command workflows under time pressure.
Commercial security users are expected to expand gradually as platforms lower access barriers. Defence remains ahead because classified handling, mission assurance and all-weather collection have a direct bearing on supplier selection.
What is accelerating Perimeter Sensing Satellites Market adoption, and what is holding it back?
Demand is expected to rise through defence ISR needs, border monitoring and multi-sensor fusion. Growth is constrained by licensing review, secure-data handling and orbital congestion.
Drivers Impact Analysis
| DRIVER | (~) % IMPACT ON CAGR | GEOGRAPHIC RELEVANCE | IMPACT TIMELINE |
|---|---|---|---|
| Defence ISR and theatre surveillance demand | +1.8% | North America, Western Europe, East Asia | Short term (<= 2 years) |
| Border and maritime perimeter monitoring | +1.4% | Europe, North America, Asia Pacific | Medium term (2-4 years) |
| Multi-sensor fusion for faster alerting | +1.1% | Global | Medium term (2-4 years) |
| Commercial infrastructure security use | +0.7% | North America, Europe, Japan | Long term (>= 4 years) |
Opportunity Impact Analysis
| OPPORTUNITY | (~) % IMPACT ON CAGR | GEOGRAPHIC RELEVANCE | IMPACT TIMELINE |
|---|---|---|---|
| Sovereign low-orbit surveillance programs | +1.3% | USA, France, Germany, Japan | Medium term (2-4 years) |
| Commercial alerting for ports and energy assets | +0.9% | North America, Europe, Asia Pacific | Long term (>= 4 years) |
| RF geolocation combined with imagery | +0.8% | Global | Short term (<= 2 years) |
Restraints Impact Analysis
| RESTRAINT | (~) % IMPACT ON CAGR | GEOGRAPHIC RELEVANCE | IMPACT TIMELINE |
|---|---|---|---|
| Licensing and national security review | -0.6% | USA, Europe, Japan | Short term (<= 2 years) |
| Secure-data handling requirements | -0.5% | North America, Europe | Medium term (2-4 years) |
| Orbital congestion and tasking conflict | -0.4% | Global | Long term (>= 4 years) |
Which countries are scaling the Perimeter Sensing Satellites Market through 2036?
- The country comparison spans 2.8 percentage points across the five profiled markets.
- The USA remains 0.4 percentage point above France due to defence-space funding and commercial GEOINT access.
- France remains 0.4 percentage point above Finland as national space strategy supports secure observation programs.
- Finland remains 0.3 percentage point above Germany through NATO integration and Arctic border awareness needs.
- Germany remains 1.7 percentage points above Japan as space security investment expands across national defence planning.
- Japan closes the displayed range through space-domain defence programs and island perimeter monitoring demand.
Comparable CAGRs create different entry conditions due to government data access, mission security rules and sensor preference by geography. Full report coverage includes North America, Latin America, Western Europe, Eastern Europe, East Asia, South Asia & Pacific, Middle East & Africa.
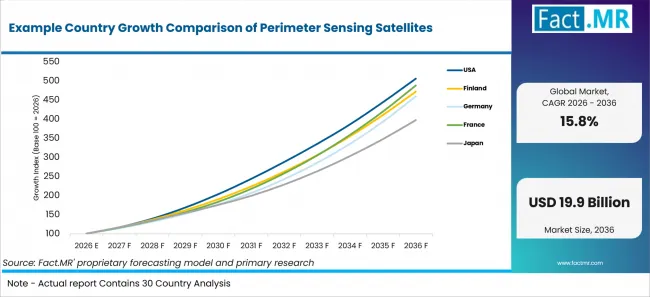
Example Country Growth Comparison Of Perimeter Sensing Satellites | Source: Fact.MR
| Country | CAGR (2026-2036) |
|---|---|
| USA | 17.6% |
| France | 17.2% |
| Finland | 16.8% |
| Germany | 16.5% |
| Japan | 14.8% |
What supports USA adoption?
17.6% CAGR, supported by commercial GEOINT access and defence-space programs.
The USA has a deep commercial satellite data base serving defence and intelligence missions. The U.S. Government Accountability Office reported in August 2026 that NRO bought commercial electro-optical imagery from Vantor, Planet Labs and BlackSky through its USD 4 billion Electro-Optical Commercial Layer contract. That buying channel gives perimeter sensing suppliers a clearer route into border, maritime and theatre surveillance workflows.
How is France scaling demand?
17.2% CAGR, backed by sovereign space strategy and military observation demand.
France is expanding national space policy around civil, dual-use and defence needs. The French Presidency said in December 2025 that France will dedicate more than EUR 16 billion to civil and dual-use space by 2030, in addition to the defence-space budget under its military programming law. The strategy strengthens France's sovereign space capabilities across security, surveillance, resilient infrastructure and other civil and dual-use priorities.
What supports Finland growth?
16.8% CAGR, driven by NATO alignment and Arctic border awareness.
Finland has a security geography that favors recurring satellite observation across sparsely populated northern areas. Finland's Ministry of Defence announced on April 1, 2025 that national defence spending would rise to at least 3% of GDP by 2029. The higher defence-spending path strengthens the funding environment for surveillance, situational-awareness and other defence capabilities relevant to Finland's northern and border-security requirements.
What is supporting Germany adoption?
16.5% CAGR, reinforced by space security investment and national defence planning.
Germany is placing space security inside national defence policy. The Federal Foreign Office said in November 2025 that the Federal Ministry of Defence plans around EUR 35 billion of investment in the space sector in coming years. The strategy links this investment to stronger military space capabilities, satellite-network resilience, protection of space systems and closer security cooperation with NATO and European partners.
How does Japan perform?
14.8% CAGR, led by space-domain defence and island perimeter monitoring.
Japan uses space systems to support maritime awareness and defence coverage across island chains. Japan’s Ministry of Finance reported in April 2025 that the FY2025 defence-related budget totaled JPY 8.7005 trillion. The budget provides broader funding context for continued investment in defence capabilities, including satellite communications, space-based surveillance and space-domain-awareness systems.
Who leads the Perimeter Sensing Satellites Market?
Planet Labs is active through optical Earth-observation capacity and high-revisit monitoring services. ICEYE strengthens the SAR layer with all-weather observation suited to maritime and border-monitoring missions. Capella Space competes through automated SAR tasking and secure government-ready data handling.
Capella Space announced in May 2025 that it had achieved CMMC Level 2 certification, authorizing the company to store, process and transmit U.S. government Controlled Unclassified Information. This capability strengthens Capella’s position in U.S. defence workflows where secure handling of CUI is required.
BlackSky supports facility and activity monitoring through high-cadence imagery and AI-enabled automated change detection. Vantor, now Vantor, remains relevant through very-high-resolution imagery and spatial-intelligence products. Spire Global adds RF detection and geolocation capabilities across land, sea and air, alongside maritime AIS data that supports vessel monitoring and maritime situational awareness.
Competition is expected to center on revisit reliability, sensor mix and secure delivery. Providers with clear tasking rules and analyst-ready alert products are better placed where agencies need fast confirmation beyond raw satellite scenes alone.
Which companies are the key providers?
Key companies include Planet Labs; ICEYE; Capella Space; BlackSky; Vantor; and Spire Global.
- Planet Labs
- ICEYE
- Capella Space
- BlackSky
- Vantor
- Spire Global
Bibliography
- Capella Space. (2025, May 5). Capella Space one of the first aerospace companies to achieve CMMC Level 2.
- European Space Agency. (2025, April 1). ESA Space Environment Report 2025.
- Federal Foreign Office. (2025, November 19). Outer space is vital to our security – the Federal Government presents the first Space Safety and Security Strategy.
- ICEYE. (2025, March 15). ICEYE launches four new satellites and introduces its new Generation 4 satellite.
- Ministry of Defence. (2025, April 1). Finland to raise defence spending to at least three percent of GDP. Finnish Government.
- Ministry of Finance, Japan. (2025, April). Japanese Public Finance Fact Sheet.
- Présidence de la République. (2025, December 2). Compte rendu du conseil des ministres du 2 décembre 2025.
- Secretary of the Air Force Public Affairs. (2026, April 21). Budget request directs record $338.8 billion to Air Force and Space Force to meet “challenges of today and tomorrow”. U.S. Air Force.
- U.S. Government Accountability Office. (2026, August 27). National security space: DOD has opportunities to improve its use of commercial data and related services (GAO-26-107959).
- Vantor. (2025, October 1). Vantor rebrands from Maxar Intelligence, unveils AI-powered platform.
This Report Answers
- The report explains where perimeter sensing satellites are used across sensor type and mission area. It also covers orbit, customer type and region.
- Segment analysis identifies the leading subsegments and the operational reasons security agencies prioritize them.
- Country analysis examines the listed markets and the defence or space-policy mechanisms supporting satellite perimeter monitoring.
- Competitive analysis reviews active providers across optical imaging, SAR, RF geolocation and multi-sensor alerting.
- Application analysis assesses how revisit, resolution and secure delivery influence supplier selection.
What does the Perimeter Sensing Satellites Market cover?
The Perimeter Sensing Satellites Market covers satellite-based sensing used to monitor borders, maritime perimeters, bases and critical infrastructure. It is adjacent to earth observation systems because both areas rely on recurring satellite data for location-specific decisions.
The assessment covers EO / optical, SAR, RF geolocation, infrared and multi-sensor fusion across LEO sun-synchronous, inclined LEO, very low LEO and MEO use. It also connects to software-defined defence satellites where payload reconfiguration and onboard data handling affect mission responsiveness.
What is included in the scope?
The scope includes commercial and government-facing satellite data services, tasking platforms, alert products and analytics tied to perimeter sensing. Related downstream needs include defence data labeling for training models that read objects and activity from imagery.
It includes mission workflows that connect sensing output with secure communications and operational review. Adjacent demand is reflected in satellite communication networks where secure data movement is part of field operations. Field teams also rely on mobile satellite services when terrestrial links have limited reach.
What is excluded from the scope?
General satellite manufacturing falls outside the scope when the service is centered on hardware supply. The scope includes satellite internet services only when they support an operational link around remote assets.
Standalone ground radar, patrol drones and local camera networks fall outside the scope unless they are part of a satellite sensing workflow. It remains separate from automatic identification systems when vessel identity data is sold as a standalone feed.
How Was the Analysis Built?
The analysis draws on 120+ sources, 35+ company portfolios, 25+ countries, and more than 20 industry interviews.
- Primary Research: Primary research includes discussions with satellite operators, data providers, security users, integrators and subject-matter experts. These conversations examine tasking priorities, revisit needs, data-handling requirements and the factors that influence wider acceptance.
- Desk Research: Desk research covers government statistics, regulatory publications, company filings, trade data, technical studies, industry associations, standards, public policy and other authoritative sources. Every source used in the analysis is documented in the bibliography.
- Market Sizing and Forecasting: Market estimates combine historical performance, demand indicators, pricing and volume trends, segment shares, company participation, country-level growth, adoption patterns, investment activity and barriers to market expansion.
- Data Validation and Update Cycle: Findings are validated by comparing primary interviews with public data, company activity, regulatory changes and industry developments. Regular updates review launches, access contracts, partnerships, approvals and shifts in commercial adoption.
What is the report's scope and coverage?
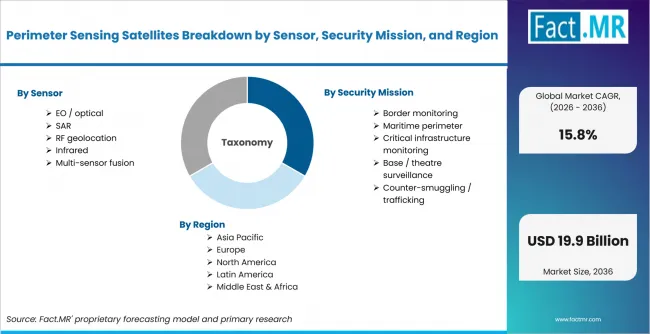
Perimeter Sensing Satellites Breakdown By Sensor, Security Mission, And Region | Source: Fact.MR
| Attribute | Details |
|---|---|
| Quantitative Units | USD Billion |
| Market Definition | Satellite platforms and data services used to sense, monitor and alert on physical perimeters across borders, maritime zones, bases, theatres and critical infrastructure. |
| Sensor | EO / optical; SAR; RF geolocation; Infrared; Multi-sensor fusion |
| Security Mission | Border monitoring; Maritime perimeter; Critical infrastructure monitoring; Base / theatre surveillance; Counter-smuggling / trafficking |
| Orbit | LEO sun-synchronous; Inclined LEO; Very low LEO; MEO; Other |
| Customer | Defence; Border agencies; Coast guards; Intelligence agencies; Commercial security |
| Regions Covered | North America; Latin America; Western Europe; Eastern Europe; East Asia; South Asia & Pacific; Middle East & Africa |
| Countries Covered | USA; Finland; Germany; France; Japan |
| Key Companies Profiled | Planet Labs; ICEYE; Capella Space; BlackSky; Vantor; Spire Global |
| Forecast Period | 2026 to 2036 |
| Approach | Hybrid top-down and bottom-up approach using satellite tasking needs; sensor mix; government and commercial customer demand; country adoption; and provider portfolio review. |
How is the market segmented?
-
By Sensor
- EO / optical
- SAR
- RF geolocation
- Infrared
- Multi-sensor fusion
-
By Security Mission
- Border monitoring
- Maritime perimeter
- Critical infrastructure monitoring
- Base / theatre surveillance
- Counter-smuggling / trafficking
-
By Orbit
- LEO sun-synchronous
- Inclined LEO
- Very low LEO
- MEO
- Other
-
By Customer
- Defence
- Border agencies
- Coast guards
- Intelligence agencies
- Commercial security
-
By Region
- North America
- Latin America
- Western Europe
- Eastern Europe
- East Asia
- South Asia & Pacific
- Middle East & Africa