- Market Value (2025): USD 4.2 Bn
- Estimated Value (2026): USD 4.4 Bn
- Forecast Value (2036): USD 6.8 Bn
- CAGR (2026-2036): 4.5%
What is the Process Oil Market forecast to be worth by 2036?
USD 4.4 billion in 2026 to USD 6.8 billion by 2036, at 4.5% CAGR.
- The process oil market crossed a valuation of USD 4.2 billion in 2025 as rubber processors and compounders kept mineral oil feedstock in regular use.
- Demand is projected to increase from USD 4.4 billion in 2026 to USD 6.8 billion by 2036.
- The market is forecast to record a 4.5% CAGR from 2026 to 2036 as tire manufacturers and plastics compounders require repeatable oil behavior.
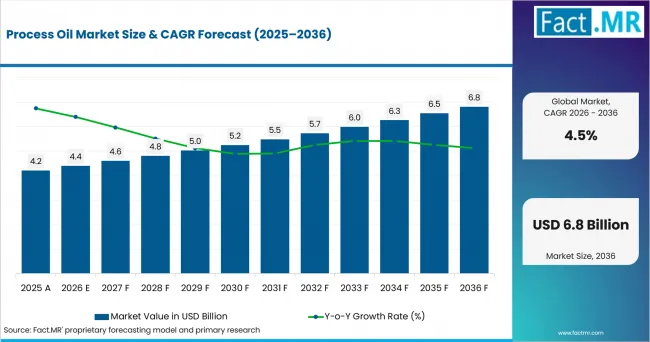
Process Oil Market Value Analysis | Source: Fact.MR
What are the defining numbers behind Process Oil Market growth?
USD 2.4 billion absolute opportunity by 2036, led by Naphthenic Process Oil and Rubber Processing Applications alongside Rubber Industry users.
- Demand Drivers in the Market
- Rubber compounders need oils that help filler dispersion and elasticity while keeping mixing cycles predictable at industrial scale.
- Tire manufacturers benefit from rubber additives and plasticizer systems when compound recipes must balance grip, durability and compliance.
- Plastics processors use compatible oils to support polymer flow, especially where flexible compounds move through extrusion or compounding lines.
- Adhesive and coating producers are expected to prefer stable oil grades where color, volatility and odour limits influence formulation approval.
- Key Segments Analyzed
- By Product: Naphthenic Process Oil is expected to hold 48.2% share in 2026 owing to solvency and compatibility across rubber and resin systems.
- By Application: Rubber Processing Applications are projected to account for 48.9% share in 2026 as tire and non-tire rubber recipes require plasticization.
- By End Use: Rubber Industry is anticipated to capture 62.3% share in 2026 due to compound volumes in tires, belts, hoses and seals.
- By Technology: Refining Technology is estimated to represent 39.4% share in 2026 because purity and aromatic control shape product acceptance.
- By Formulation: Mineral Oil Based Formulations are forecast to hold 68.7% share in 2026 as established specifications support large-volume procurement.
- By Distribution Channel: Direct Industrial Supply is expected to account for 57.9% share in 2026 since large plants require documents and consistent deliveries.
- Analyst Opinion at Fact.MR
- Shambhu Nath Jha, Principal Consultant at Fact.MR, states, “Process oil purchasing is not only a price decision. Tire and rubber plants need grades that behave consistently in mixers. Suppliers are expected to gain by combining feedstock discipline, documentation and technical support.”
- Strategic Implications
- Rubber producers should qualify alternate naphthenic and paraffinic grades before crude-linked cost movements force urgent reformulation.
- Tire manufacturers should keep PAH, volatility and compatibility records close to procurement files so plant teams can change grades safely.
- Investors should separate high-volume mineral oil demand from smaller bio based formulations where approvals are slower but margins are firmer.
Germany is expected to record 5.2% CAGR through 2036. Brazil is projected to advance at 4.7%. The USA, UK and Japan follow at 4.3%, 3.8% and 3.4%, respectively.
How does the Process Oil Market break down by segment?
Naphthenic Process Oil leads Product at 48.2%; Rubber Processing Applications lead Application at 48.9%.
Which product dominates?
Naphthenic Process Oil is projected to account for 48.2% share in 2026.
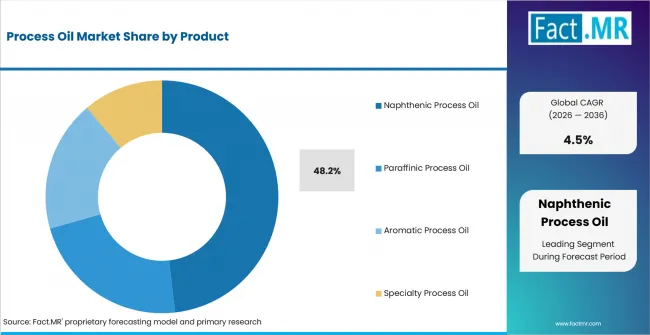
Process Oil Market Analysis By Product | Source: Fact.MR
Naphthenic grades lead because their solvency supports rubber and resin compatibility without broad recipe changes. Naphthenic base oils connect this demand with other applications that rely on similar feedstock control.
What leads the Application segment?
Rubber Processing Applications are expected to hold 48.9% share in 2026.
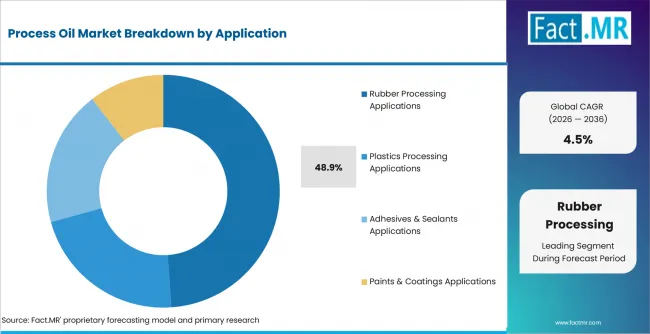
Process Oil Market Analysis By Application | Source: Fact.MR
Rubber processing leads application use because process oils enter mixing, extrusion and molding as performance aids. Rubber processing aids create an adjacent formulation layer for plant acceptance.
How does End Use shape demand?
Rubber Industry is anticipated to lead with 62.3% share in 2026.
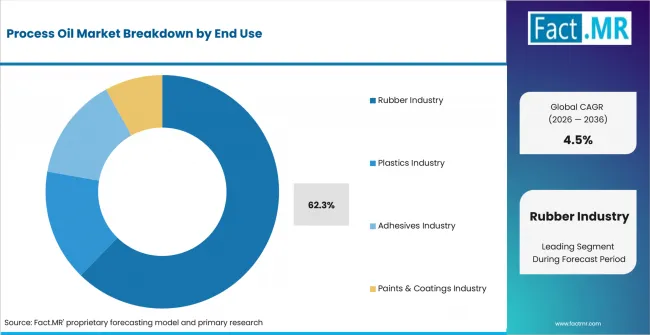
Process Oil Market Analysis By End Use | Source: Fact.MR
The rubber industry leads end use because tire and non-tire products carry the highest oil-loading need. USTMA projected total U.S. tire shipments of 338.9 million units in 2026, up 0.7% from 336.3 million units in 2025.
What supports Refining Technology within Technology?
Refining Technology is estimated to represent 39.4% share in 2026.
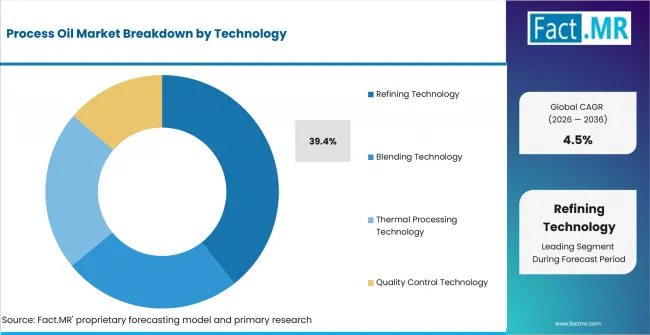
Process Oil Market Analysis By Technology | Source: Fact.MR
Refining technology leads the technology segment because buyers judge oils by aromatic content, color stability and impurity control. Base oil supply stays connected because refinery configuration controls available grades.
What supports Mineral Oil Based Formulations?
Mineral Oil Based Formulations are forecast to hold 68.7% share in 2026.
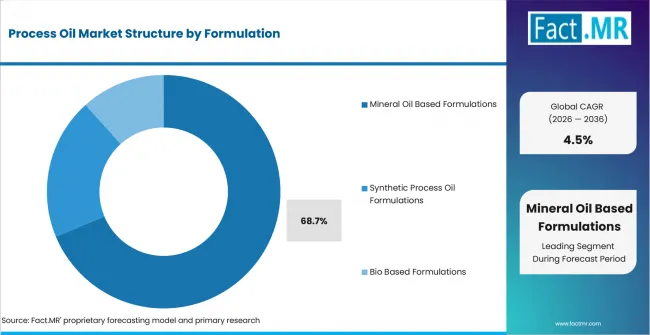
Process Oil Market Analysis By Formulation | Source: Fact.MR
Mineral oil based formulations hold the largest position because many rubber and plastics specifications already use them. White oil remains adjacent where purity and colour standards require highly refined mineral oil streams.
How does Direct Industrial Supply shape distribution?
Direct Industrial Supply is expected to account for 57.9% share in 2026.
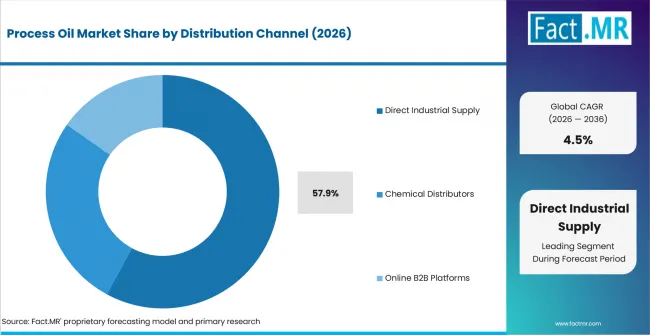
Process Oil Market Analysis By Distribution Channel | Source: Fact.MR
Direct industrial supply leads distribution because large rubber and tire plants need scheduled deliveries and batch traceability. Industrial lubricants provide an adjacent channel comparison for documented oil procurement.
What is accelerating Process Oil Market adoption, and what is holding it back?
Rubber compounding drives it; petroleum feedstock volatility restrains it.
Driver Impact Analysis
| DRIVER | (~) % IMPACT ON CAGR | GEOGRAPHIC RELEVANCE | IMPACT TIMELINE |
|---|---|---|---|
| Rubber compounding consistency | +1.4% | Germany, USA, Brazil | Short term (<= 2 years) |
| Tire replacement and OEM demand | +1.1% | USA, Japan, Germany | Short term (<= 2 years) |
| Plastic compound flexibility | +0.8% | Europe, North America, East Asia | Medium term (2-4 years) |
| Lower-PAH formulation shift | +0.7% | Europe and Japan | Medium term (2-4 years) |
| Direct industrial supply contracts | +0.5% | Large manufacturing clusters | Long term (>= 4 years) |
- Rubber compounding consistency: Process oils are expected to support stable mixing behavior across long production runs, especially in Industrial rubber applications.
- Plastic compound flexibility: Plastics processors use process oils where flexible compounds need easier flow and lower processing stress through Formulation additives.
- Lower-PAH formulation shift: European and Japanese buyers are anticipated to place more weight on cleaner chemistry and tire rubber additives documentation.
- Direct industrial supply contracts: Large buyers prefer direct supply because approved process oil grades must arrive with consistent documents and delivery reliability.
| OPPORTUNITY | (~) % IMPACT ON CAGR | GEOGRAPHIC RELEVANCE | IMPACT TIMELINE |
|---|---|---|---|
| Bio based formulation trials | +0.7% | Europe, Japan, USA | Medium term (2-4 years) |
| Specialty oil upgrades | +0.6% | Germany and Japan | Medium term (2-4 years) |
| Distributor technical services | +0.5% | Brazil, UK, South Korea | Short term (<= 2 years) |
| Battery separator and TPE uses | +0.4% | East Asia and North America | Long term (>= 4 years) |
- Bio based formulation trials: Bio based formulations are expected to create selective opportunity where customers ask for lower product footprints.
- Specialty oil upgrades: Specialty Process Oil is projected to benefit when coatings, adhesives and TPE producers need tighter color and volatility control.
- Distributor technical services: Regional distributors are expected to gain where smaller manufacturers need multiple grades and faster local support.
- Battery separator and TPE uses: High-purity process oils are anticipated to find wider use in battery separator and elastomer systems.
| RESTRAINT | (~) % IMPACT ON CAGR | GEOGRAPHIC RELEVANCE | IMPACT TIMELINE |
|---|---|---|---|
| Petroleum feedstock volatility | -1.0% | Global | Short term (<= 2 years) |
| Compliance and PAH documentation | -0.8% | Europe and Japan | Medium term (2-4 years) |
| Recipe requalification burden | -0.6% | Tire and rubber plants | Short term (<= 2 years) |
| Import and logistics exposure | -0.4% | Brazil, UK, South Korea | Medium term (2-4 years) |
- Petroleum feedstock volatility: Process oil prices remain sensitive to crude, refinery margins and naphtha movements.
- Compliance and PAH documentation: Rubber and consumer-goods applications require tighter records on aromatic content and restricted substances.
- Recipe requalification burden: Plants cannot switch approved process oils quickly when curing, hardness or color can change.
- Import and logistics exposure: Import-dependent markets face freight and currency risk when specialty grades move across regions.
Which countries are scaling Process Oil Market fastest?
- The country comparison spans 1.8 percentage points across the forecast period.
- Germany remains 0.5 percentage point above Brazil through rubber goods capacity and premium specification demand.
- Brazil remains 0.4 percentage point above the USA as local tire and vehicle activity keeps process oil consumption active.
- The USA remains 0.5 percentage point above the UK through deeper tire shipments and plastics processing scale.
- The UK remains 0.4 percentage point above Japan as local component makers still support process oil use despite output pressure.
- Japan closes the displayed range through mature tire replacement demand and strict formulation approval.
Comparable CAGRs create different entry conditions because rubber production scale, tire demand, refining access and feedstock volatility vary by country. Full report coverage includes North America, Latin America, Europe, East Asia, South Asia and Pacific, Middle East and Africa.
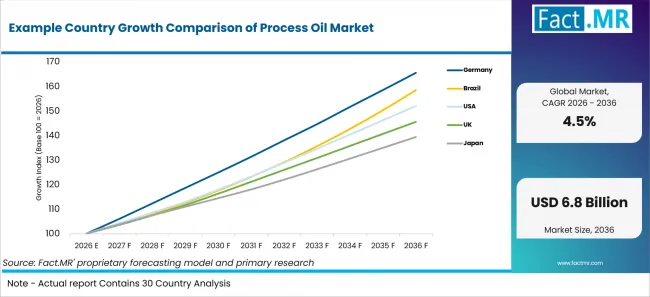
Example Country Growth Comparison Of Process Oil Market | Source: Fact.MR
| Country | CAGR (2026-2036) |
|---|---|
| Germany | 5.2% |
| Brazil | 4.7% |
| USA | 4.3% |
| UK | 3.8% |
| Japan | 3.4% |
What supports Germany adoption?
5.2% CAGR through 2036, supported by rubber goods scale and automotive production.
Germany’s growth is supported by a large automotive base and steady replacement demand. VDA reported 4.15 million passenger cars produced in 2025, while VDIK recorded nearly 2.86 million new registrations. Higher naphtha costs, strict low-PAH documentation and grade-testing expenses may restrain process oil adoption.
How is Brazil scaling process oil demand?
4.7% CAGR through 2036, driven by vehicle production and tire manufacturing needs.
Brazil’s growth reflects strong vehicle production and an established tire manufacturing base. Agência Brasil reported 2.6 million vehicles produced in 2025, while ANIP represents 11 companies and 19 factories. High interest rates, imported tire competition and currency-linked petroleum costs may limit premium process oil trials.
What underpins the USA outlook?
4.3% CAGR through 2036, shaped by tire shipments and plastics manufacturing scale.
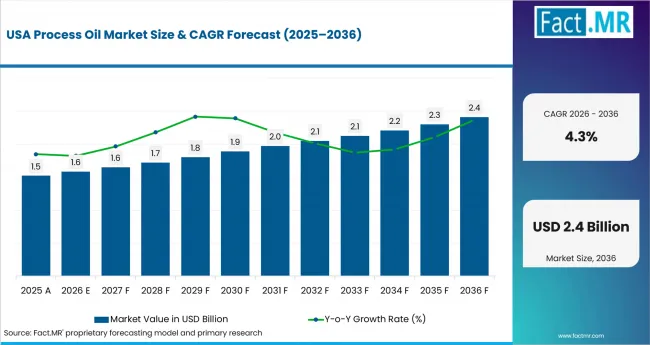
Process Oil Market Country Value Analysis | Source: Fact.MR
USA growth is supported by high tire shipment volumes and a sizeable plastics and rubber manufacturing base. USTMA projected total U.S. tire shipments of 338.9 million units in 2026, while U.S. Census Bureau data placed seasonally adjusted manufacturers’ shipments of plastics and rubber products at USD 25.008 billion in January 2025. Petroleum-price movements and lengthy recipe approvals may constrain supplier switching.
How is the UK developing demand?
3.8% CAGR through 2036, supported by rubber and plastic goods output and vehicle components.
UK growth is supported by vehicle production and exports of rubber and plastic products. SMMT reported that the UK produced 717,371 cars in 2025, while ONS data placed 2025 exports from the manufacture of rubber and plastic products at GBP 5,750.3 million. Import-price inflation, lower vehicle output and specialty-oil costs may restrain demand.
How does Japan perform?
3.4% CAGR through 2036, led by replacement tire demand and careful formulation approval.
Japan’s growth is supported by replacement tire demand and a large registered-vehicle base. JATMA reported 67.93 million replacement tire sales in Japan in 2025, while AIRIA reported, citing JADA, that new registered-vehicle sales totaled 2,845,316 units in fiscal 2025. Established production, petroleum-price exposure and strict formulation approvals may slow grade changes.
Who leads the Process Oil Market?
Shell International B.V., APAR Industries Limited, Nynas AB and Idemitsu Kosan are among the companies profiled for process-oil, base-stock, naphthenic and specialty-oil activity.
Shell International B.V. lists process oils for rubber, elastomer, plastic and adhesive manufacturing in its January 2026 product material. APAR Industries Limited supports process oil and base stock users through hydroprocessing technology and lubricant base oil expertise. Chevron Corporation, TotalEnergies and Idemitsu Kosan Co., Ltd. add refining and specialty oil depth for buyers that need cleaner formulations.
Gandhar Oil Refinery (India) Limited, Eastern Petroleum Pvt. Ltd., NYNAS AB, Repsol, Panama Petrochem Ltd. and H&R GROUP complete the visible specialty field. Competition is expected to hinge on grade consistency, batch records and formulation support.
Which companies are the key providers?
Key companies include Shell International B.V., APAR Industries Limited, Chevron Corporation, Gandhar Oil Refinery (India) Limited, Eastern Petroleum Pvt. Ltd., TotalEnergies, Idemitsu Kosan Co., Ltd., Eni / Enilive, Indian Oil Corporation Ltd, NYNAS AB, Repsol, Panama Petrochem Ltd., H&R GROUP, Behran Oil Co., LODHA Petro, HF Sinclair Corporation, Hindustan Petroleum Corporation Limited, GP Petroleums, Ergon, Inc. / Ergon Specialty Oils.
- Shell International B.V.
- APAR Industries Limited
- Chevron Corporation
- Gandhar Oil Refinery (India) Limited
- Eastern Petroleum Pvt. Ltd.
- TotalEnergies
- Idemitsu Kosan Co., Ltd.
- Eni / Enilive
- Indian Oil Corporation Ltd
- NYNAS AB
- Repsol
- Panama Petrochem Ltd.
- H&R GROUP
- Behran Oil Co.
- LODHA Petro
- HF Sinclair Corporation
- Hindustan Petroleum Corporation Limited
- GP Petroleums
- Ergon, Inc. / Ergon Specialty Oils
Bibliography
- Associação Nacional dos Fabricantes de Veículos Automotores. (2026, January 15). Produção e venda de autoveículos crescem em 2025 e Anfavea projeta nova alta em 2026.
- Associação Nacional da Indústria de Pneumáticos. (2026, May). Manifesto pela Indústria Nacional de Pneus e do Ecossistema da Borracha.
- Banco Central do Brasil. (2026, June 17). Copom reduz a taxa Selic para 14,25% a.a. – 279ª reunião – junho 2026.
- Statistisches Bundesamt (Destatis). (2026, July 20). Producer prices in June 2026: +1.8% on June 2025.
- Verband der Internationalen Kraftfahrzeughersteller e.V. (2026, January 6). New registrations: Strong finish to 2025 – significant increase in BEVs among international registrations.
- U.S. Census Bureau. (2026, August 4). Monthly full report on manufacturers’ shipments, inventories, & orders: June 2026.
- Nynas AB. (2025, February 17). Instant reduction.
- Office for National Statistics. (2026, August 13). UKProdTO: 22 - Manufacture of Rubber and Plastic Products EXPORT (£m) (Series JQ7L).
- Office for National Statistics. (2026, July 22). Producer price inflation, UK: June 2026, including services, April to June 2026.
- Shell plc. (2026, January 12). Process oils.
- Society of Motor Manufacturers and Traders. (2026, January 29). Tough year for auto but new models and Industrial Strategy can deliver growth.
- U.S. Energy Information Administration. (2026, June 9). Short-Term Energy Outlook: June 2026.
- U.S. Tire Manufacturers Association. (2026, March 4). USTMA February 2026 forecast predicts slightly higher 2026 tire shipments for U.S. tire market.
- Verband der Automobilindustrie. (2026, January 5). Passenger car production in 2025 slightly above previous year's level.
This Report Addresses
- The report covers Process Oil Market choices across Product and Application.
- Segment analysis covers Naphthenic Process Oil and Rubber Processing Applications as the share leaders within the 2026 market.
- Country outlook evaluates Germany and Brazil alongside the USA, UK and Japan, with country growth tied to tire, rubber and manufacturing indicators.
- Competitive analysis profiles Shell International B.V. and APAR Industries Limited alongside Chevron Corporation, Gandhar Oil Refinery (India) Limited and NYNAS AB.
- Technology assessment covers Refining Technology and Hydroprocessing Technology. Blending Technology and Quality Control Technology complete the process view.
What does the Process Oil Market cover?
Process oils are used as processing aids in rubber, plastics, adhesives, sealants and coatings where viscosity, filler dispersion, flexibility and formulation stability influence production performance.
The Process Oil Market covers naphthenic, paraffinic, aromatic and specialty process oils used across industrial formulations. Coverage extends to mineral oil based, synthetic and bio based formulations where the oil serves a compounding or processing role. The market also includes refining, blending, thermal processing and quality-control technologies alongside direct industrial supply, chemical distribution and online B2B channels.
What is included in the scope?
Process oils supplied to rubber processors, tire manufacturers, plastics compounders, adhesive producers and coating formulators are included where the oil directly supports industrial formulation or processing.
The scope includes Product, Application, End Use, Technology, Formulation and Distribution Channel. Coverage spans Naphthenic, Paraffinic, Aromatic and Specialty Process Oils. Rubber Processing, Plastics Processing, Adhesives and Sealants, and Paints and Coatings are included. Mineral Oil Based, Synthetic and Bio Based Formulations are covered alongside direct industrial and distributor-led supply.
What is excluded from the scope?
Finished lubricants and petroleum products that do not serve a formulation or processing role remain outside the Process Oil Market.
The scope excludes finished engine oils, consumer lubricants and general petroleum products that are not used as industrial formulation inputs. Standalone fuels, finished automotive lubricants and unrelated refinery products are excluded unless they function directly as process oils in rubber, plastics, adhesives, sealants or coatings.
How Was the Analysis Built?
The analysis draws on 120+ sources, 35+ company portfolios, 25+ countries, and more than 20 industry interviews.
- Primary Research: Primary research includes discussions with manufacturers, service providers, technology developers, distributors, end users, procurement teams, and subject-matter experts. These conversations examine purchasing priorities, product adoption, operational challenges, approval requirements, competitive positioning, and the factors that influence wider market acceptance.
- Desk Research: Desk research covers government statistics, regulatory publications, company filings, trade data, technical studies, industry associations, standards, public policy, and other authoritative sources. Every source used in the analysis is documented in the bibliography.
- Market Sizing and Forecasting: Market estimates combine historical performance, demand indicators, pricing and volume trends, segment shares, company participation, country-level growth, adoption patterns, investment activity, and barriers to market expansion.
- Data Validation and Update Cycle: Findings are validated by comparing primary interviews with public data, company activity, regulatory changes, trade patterns, and industry developments. Regular updates review new product launches, capacity changes, partnerships, approvals, procurement trends, and shifts in commercial adoption.
What is the report’s scope and coverage?
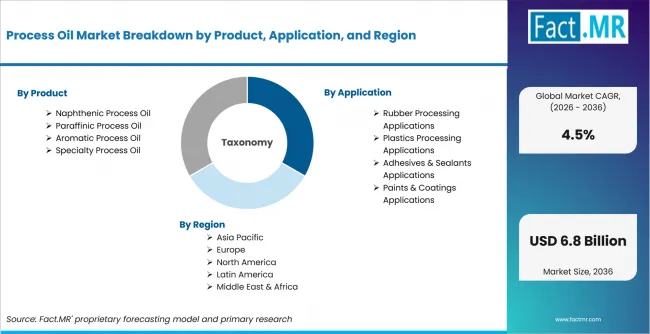
Process Oil Market Breakdown By Product, Application, And Region | Source: Fact.MR
| Attribute | Details |
|---|---|
| Quantitative Units | USD billion |
| Market Definition | Process oils used as processing aids in rubber, plastics, adhesives, sealants and coatings. |
| Product | Naphthenic Process Oil; Paraffinic Process Oil; Aromatic Process Oil; Specialty Process Oil. |
| Application | Rubber Processing; Plastics Processing; Adhesives and Sealants; Paints and Coatings. |
| End Use | Rubber Industry; Plastics Industry; Adhesives Industry; Paints and Coatings Industry. |
| Technology | Refining; Hydroprocessing; Solvent Refining; Blending; Thermal Processing; Quality Control. |
| Formulation | Mineral Oil Based; Synthetic Process Oil; Bio Based Formulations. |
| Distribution Channel | Direct Industrial Supply; OEM Contracts; Chemical Distributors; Online B2B Platforms. |
| Regions Covered | North America; Latin America; Europe; East Asia; South Asia and Pacific; Middle East and Africa |
| Countries Covered | Germany; Brazil; USA; UK; Japan |
| Key Companies Profiled | Shell International B.V., APAR Industries Limited, Chevron Corporation, Gandhar Oil Refinery (India) Limited, Eastern Petroleum Pvt. Ltd., TotalEnergies, Idemitsu Kosan Co., Ltd., Eni / Enilive, Indian Oil Corporation Ltd, NYNAS AB, Repsol, Panama Petrochem Ltd., H&R GROUP, Behran Oil Co., LODHA Petro, HF Sinclair Corporation, Hindustan Petroleum Corporation Limited, GP Petroleums, Ergon, Inc. / Ergon Specialty Oils. |
| Forecast Period | 2026 to 2036 |
| Approach | Hybrid top-down and bottom-up approach using demand indicators, country growth, supply factors and company portfolio review. |
How is the market segmented?
-
By Product:
- Naphthenic Process Oil
- Light Naphthenic Oil
- Heavy Naphthenic Oil
- Paraffinic Process Oil
- Light Paraffinic Oil
- Heavy Paraffinic Oil
- Aromatic Process Oil
- High Aromatic Oil
- Low Aromatic Oil
- Specialty Process Oil
- Hydrogenated Oils
- Bio Based Process Oils
- Naphthenic Process Oil
-
By Application:
- Rubber Processing Applications
- Tire Manufacturing
- Industrial Rubber Products
- Plastics Processing Applications
- Polymer Processing
- Plastic Compounding
- Adhesives & Sealants Applications
- Construction Adhesives
- Industrial Sealants
- Paints & Coatings Applications
- Architectural Coatings
- Industrial Coatings
- Rubber Processing Applications
-
By End Use:
- Rubber Industry
- Tire Manufacturers
- Non Tire Rubber Manufacturers
- Plastics Industry
- Polymer Manufacturers
- Plastic Compounders
- Adhesives Industry
- Construction Adhesives Manufacturers
- Industrial Adhesive Manufacturers
- Paints & Coatings Industry
- Industrial Paint Manufacturers
- Decorative Paint Manufacturers
- Rubber Industry
-
By Technology:
- Refining Technology
- Hydroprocessing Technology
- Solvent Refining Technology
- Blending Technology
- Precision Blending Systems
- Additive Blending Systems
- Thermal Processing Technology
- Heat Treatment Systems
- Temperature Control Systems
- Quality Control Technology
- Analytical Testing Systems
- Real Time Monitoring Systems
- Refining Technology
-
By Formulation:
- Mineral Oil Based Formulations
- Naphthenic Based Formulations
- Paraffinic Based Formulations
- Synthetic Process Oil Formulations
- Polyalphaolefin Based Systems
- Ester Based Oils
- Bio Based Formulations
- Plant Derived Oils
- Waste Derived Oils
- Mineral Oil Based Formulations
-
By Distribution Channel:
- Direct Industrial Supply
- OEM Supply Contracts
- Large Scale Procurement
- Chemical Distributors
- Regional Distributors
- Global Distribution Networks
- Online B2B Platforms
- Digital Chemical Marketplaces
- Manufacturer Direct Portals
- Direct Industrial Supply
-
By Region:
- North America
- Latin America
- Western Europe
- Eastern Europe
- East Asia
- South Asia and Pacific
- Middle East & Africa

