- Market Value (2025): USD 2564.1 Mn
- Estimated Value (2026): USD 2899.8Mn
- Forecast Value (2036): USD 9931.7 Mn
- CAGR (2026-2036): 13.1%
What is the Reconciliation Software Market forecast to be worth by 2036?
USD 2899.8 million in 2026 to USD 9931.7 million by 2036, at 13.1% CAGR.
- The Reconciliation Software Market crossed a valuation of USD 2564.1 million in 2025 while finance teams expanded automated matching across bank and payment records.
- Demand is projected to increase from USD 2899.8 million in 2026 to USD 9931.7 million by 2036.
- The market is forecast to record a 13.1% CAGR from 2026 to 2036 supported by governed exception handling across controller and payment operations teams.
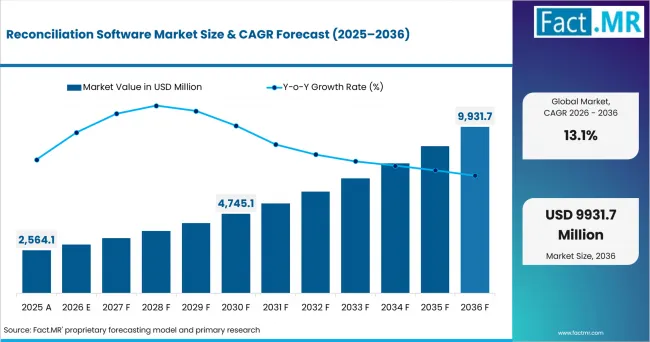
Reconciliation Software Market Market Value Analysis | Source: Fact.MR
What are the defining numbers behind Reconciliation Software Market growth?
USD 7,031.9 million absolute opportunity by 2036, led by Software and Cloud across BFSI accounts.
- Demand Drivers in the Market
- Financial controllers need consistent account evidence supported by approval workflows that preserve preparer actions and reviewer decisions inside one governed record.
- Payment operations teams need high-volume matching owing to settlement feeds that arrive from processors and banks in different formats. Internal ledgers add another source structure that matching workflows must normalize before teams investigate genuine financial record differences.
- Treasury teams need faster break visibility driven by intraday payment movement that reduces the usefulness of periodic spreadsheet checks and delayed investigation queues.
- Shared-service centers need reusable reconciliation rules shaped by multi-entity operating models that must control exceptions without rebuilding each process for every ledger.
- Key Segments Analyzed
- By Component: Software is expected to account for 26.7% share in 2026 supported by direct ownership of matching logic and exception routing. Audit evidence stays attached to controlled process records so reviewers trace rule changes and exception decisions inside one workflow.
- By Deployment: Cloud is projected to garner 47.5% share in 2026 owing to centralized upgrades and faster onboarding across distributed finance operations teams.
- By Organization Size: SME is anticipated to record 51.4% share in 2026 shaped by demand for configurable controls without extensive internal development programs.
- By Application: Workflow Automation is estimated to capture 30.9% share in 2026 attributable to approval routing and exception queues. Close-task coordination extends the control chain into period-end work where unresolved reconciliations affect review timing and reporting readiness.
- By End Use: BFSI is forecast to secure 44.8% share in 2026 driven by payment volumes and settlement controls. Regulatory expectations reinforce the need for traceable operating evidence that documents matching rules and the resolution path for unresolved items.
- Analyst Opinion at Fact.MR
- Shambhu Nath Jha, Fact.MR Senior Analyst states, “Reconciliation projects succeed or fail on data normalization and control ownership before matching rates enter the discussion. Adoption is expected to favor platforms that let operations teams change rules inside governed approval structures while preserving reviewer evidence. Suppliers should combine flexible ingestion with explainable matching logic and traceable exception resolution inside one control chain.”
- Strategic Implications
- Finance leaders should map every source file and control owner before selecting matching automation features or setting implementation milestones across business units.
- Payments operations heads should test processor and bank feeds together before adding ledger records to the same reconciliation process. This sequence helps prevent false breaks from becoming permanent manual investigation work that consumes finance capacity during recurring close cycles.
- Internal audit teams should require rule-change history and reviewer evidence before machine-assisted classification is allowed to influence exception prioritization decisions.
- Technology teams should design API and file-based ingestion together to support finance estates combining modern applications with older systems and scheduled exports.
FIS was selected by Commonwealth Bank of Australia in May 2026 to deploy Data Integrity Manager as a SaaS reconciliation platform processing more than 150 million transactions daily. Delivered on Microsoft Azure with third-party connectivity, the implementation reflects bank demand for unified reconciliation controls that scale transaction matching while preserving centralized exception visibility.
India is expected to record 14.9% CAGR between 2026 and 2036 supported by expanding instant-payment volumes and wider bank participation in interoperable rails. China is projected to post 14.2% CAGR during the forecast period attributable to high digital-payment activity and continued work on standardized transaction infrastructure. Australia is anticipated to advance at 12.9% CAGR over the forecast period reinforced by migration from batch account-to-account payments toward real-time rails. The United Kingdom is estimated to advance at 12.6% CAGR across the 2026 to 2036 period owing to reconciliation controls across high-value payments and structured transaction messages. The United States is forecast to record 12.4% CAGR over the forecast decade driven by reconciliation across ACH and wires alongside card and instant-payment records with different settlement schedules.
How does the Reconciliation Software Market break down by segment?
Software holds 26.7% share; Cloud leads with 47.5% share.
Which Component dominates?
Software accounts for 26.7% share in 2026
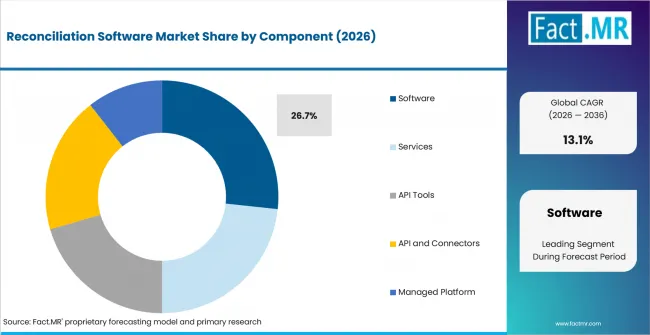
Reconciliation Software Market Analysis By Component | Source: Fact.MR
Software is expected to account for 26.7% share in 2026 supported by direct control over matching rules and exception workflows. Services remain relevant for process design and migration across finance estates that contain legacy controls and varied source formats. API Tools support structured access to changing source systems, while API Connectors shorten integration work for commonly used applications. Managed Platform models shift more operating responsibility to providers that also support recurring process administration and controlled change coordination. BlackLine’s February 2026 Form 10-K lists Account Reconciliations and Transaction Matching within its Studio360 application portfolio.
Which Deployment model accounts for the largest share?
Cloud leads with 47.5% share in 2026
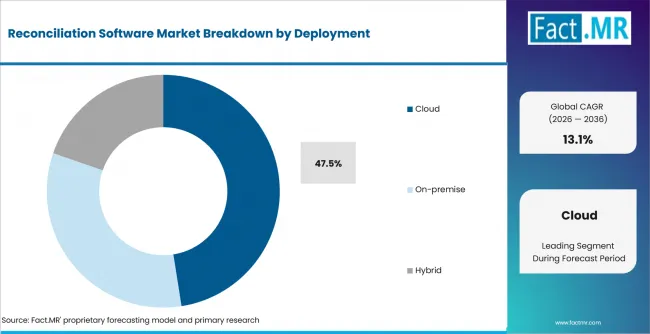
Reconciliation Software Market Analysis By Deployment | Source: Fact.MR
Cloud is projected to garner 47.5% share in 2026 owing to centralized releases and easier access across distributed finance teams. On-premise deployment remains relevant where institutions retain strict infrastructure controls and customized legacy integrations across regulated operating environments. Hybrid models connect hosted workflow layers with internal data estates that move on different migration schedules. In July 2026, ReconArt announced a Solana integration supporting stablecoin and automated payment reconciliation workflows. The launch demonstrates reconciliation coverage for newer payment records while finance teams manage staged infrastructure change.
How does Organization Size shape demand?
SME records 51.4% share in 2026.
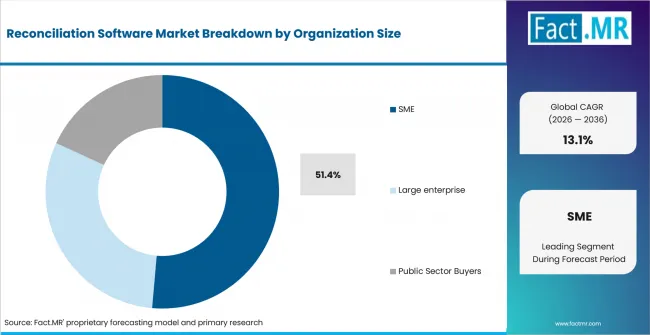
Reconciliation Software Market Analysis By Organization Size | Source: Fact.MR
SME is anticipated to record 51.4% share in 2026 shaped by demand for controlled reconciliation without lengthy internal development programs. Large enterprises need broader process inventories and stronger segregation of duties across entities that share centralized finance operations. Public Sector Buyers require auditable workflows that fit formal procurement and record-retention practices across agency finance environments. In March 2026, Trintech stated that six of the ten largest global banks use its technology for daily reconciliation and financial close controls. The customer base shows why large-account capability remains commercially relevant even though SME accounts retain the leading share position.
What supports Workflow Automation within Application?
Workflow Automation captures 30.9% share in 2026
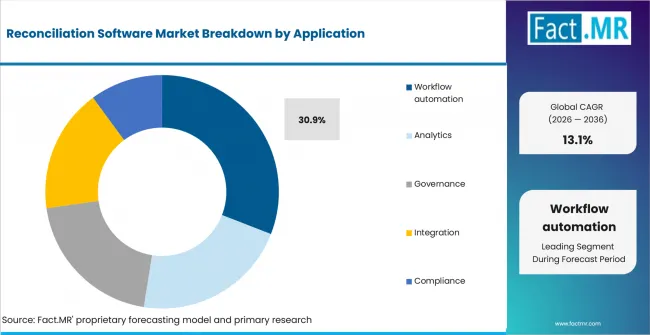
Reconciliation Software Market Analysis By Application | Source: Fact.MR
Workflow Automation is estimated to capture 30.9% share in 2026 attributable to break routing and approval control. Analytics helps teams compare match rates and exception aging across large reconciliation inventories that span many finance entities. Governance supports role ownership and rule-change review, while Integration connects source data with matching engines. Compliance functions preserve evidence for audit and control testing across recurring financial review and approval processes. In July 2026, the Federal Reserve Board reported 120.6 billion debit card payments during 2024. That record volume supports recurring processor and ledger matching work across finance operations teams with large reconciliation inventories.
Which End Use records the largest share?
BFSI holds 44.8% share in 2026
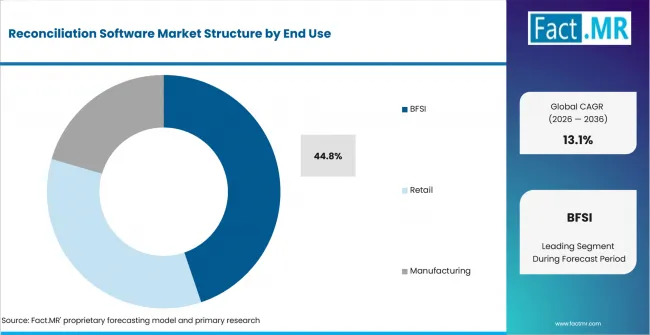
Reconciliation Software Market Analysis By End Use | Source: Fact.MR
BFSI is forecast to represent 44.8% share in 2026 driven by payment and securities controls that also extend into treasury and ledger reconciliation. Retail organizations need processor and bank settlement checks across store and online channels with different timing and fee records. Manufacturing companies align bank records with enterprise resource planning entries and multi-entity cash activity across distributed operations. In January 2026, the European Central Bank reported 55.7 billion euro-area retail payment system transactions during the first half of 2025. That scale keeps automated matching and exception management central to financial control programs inside regulated institutions.
What is accelerating Reconciliation Software Market adoption, and what is holding it back?
Rising transaction volumes drive it; legacy data normalization restrains it.
Drivers Impact Analysis
| DRIVER | (~) % IMPACT ON CAGR | GEOGRAPHIC RELEVANCE | IMPACT TIMELINE |
|---|---|---|---|
| Rising payment and settlement volumes | +2.4% | North America, Europe, Asia Pacific | Medium term (2-4 years) |
| Continuous close and exception automation | +1.8% | Global enterprise accounts | Medium term (2-4 years) |
| Operational resilience and audit traceability | +1.5% | Europe and United Kingdom | Short term (<= 2 years) |
| API and ERP connectivity requirements | +1.2% | North America and Asia Pacific | Medium term (2-4 years) |
| Cloud operating model adoption | +0.9% | United States, India, Australia | Long term (>= 4 years) |
Source: Fact.MR analysis. Updated Jul 8, 2026
- Payment and settlement volumes: Transaction growth increases the number of records that operations teams must compare across internal and external systems. The Federal Reserve processed 21.585 billion commercial ACH items during 2025 according to annual data published in February 2026. Demand is expected to favor platforms that ingest large recurring files without turning volume growth into larger manual exception teams.
- Continuous close operations: Finance organizations are moving recurring reconciliations closer to daily activity so breaks appear before period-end pressure concentrates. In July 2025, the European Commission reported agreement to shorten the EU securities settlement cycle from two business days to one business day. Adoption is projected to expand among reconciliation teams needing earlier data readiness and tighter exception response around shortened settlement windows.
- Operational resilience and audit evidence: Regulated institutions need reconciliation controls that preserve rule history and ownership. Review status and exception disposition should remain visible throughout the control process so auditors trace responsibility and resolution evidence. The European Supervisory Authorities reported 3,383 major technology incidents in June 2026 during the first Digital Operational Resilience Act incident review. Procurement is anticipated to place greater weight on control traceability during operational resilience reviews that extend into outsourced technology relationships.
- API and ERP connectivity: Reconciliation performance depends on reliable source access before matching logic starts producing useful results. In January 2026, the European Central Bank reported that instant credit transfers represented 23% of credit-transfer volume processed during the first half of 2025. Integration demand is estimated to widen owing to finance teams connecting faster payment rails with ERP records and bank data feeds through governed interfaces.
- Cloud operating models: Hosted reconciliation reduces local infrastructure work and gives distributed finance teams a common release level across entities. Centralized deployment also supports faster rule sharing when common processes span business units and jurisdictions. Demand is forecast to rise among organizations that accept provider-managed release cycles while retaining clear data controls and approval authority over reconciliation logic.
Opportunity Impact Analysis
| OPPORTUNITY | (~) % IMPACT ON CAGR | GEOGRAPHIC RELEVANCE | IMPACT TIMELINE |
|---|---|---|---|
| Instant-payment reconciliation controls | +1.1% | India, United States, Europe | Short term (<= 2 years) |
| Machine-assisted exception classification | +0.9% | North America and Europe | Medium term (2-4 years) |
| Managed reconciliation platforms | +0.7% | BFSI hubs and shared services | Medium term (2-4 years) |
| Public-sector financial control workflows | +0.5% | India, Australia, United Kingdom | Long term (>= 4 years) |
Source: Fact.MR analysis. Updated Jul 8, 2026
- Instant-payment reconciliation: Real-time rails create new control windows due to continuous payment confirmation across the operating day instead of inside a single scheduled batch cycle. Federal Reserve Financial Services reported 8.413 million settled FedNow payments during 2025 in its April 2026 statistics update. Opportunity is expected to expand around intraday controls that connect payment status with bank confirmation. Ledger posting evidence should enter the same workflow without delaying break investigation or separating payment confirmation from financial record review.
- Machine-assisted exception classification: Operations teams spend many staff hours separating genuine breaks from formatting differences and predictable tolerance issues. Assistive models are useful when suggestions remain tied to transparent rules and human approval across controlled exception investigation workflows. Providers are projected to gain work by reducing investigation noise while keeping every classification decision reviewable for audit and control testing.
- Managed reconciliation platforms: Some institutions want reconciliation software without maintaining every infrastructure layer or specialist support function internally. Managed delivery creates room for providers that combine platform operation with controlled change processes and service commitments. Opportunity is anticipated to widen among firms that have many legacy reconciliations but limited internal capacity for governed migration.
- Public-sector financial controls: Government payment programs and agency finance systems create reconciliation needs across disbursement files and bank confirmations. Beneficiary records add another evidence layer for exception review when finance teams compare payment instructions with bank confirmation records. In April 2026, India’s Press Information Bureau reported that UPI connected 691 banks by January 2026 across its interoperable payment network. Demand is estimated to rise among public bodies and regulated service operators needing traceable exception workflows across interoperable payment environments.
Restraints Impact Analysis
| RESTRAINT | (~) % IMPACT ON CAGR | GEOGRAPHIC RELEVANCE | IMPACT TIMELINE |
|---|---|---|---|
| Legacy data normalization cost | -1.2% | Global enterprise accounts | Medium term (2-4 years) |
| Model governance and auditability limits | -0.9% | Regulated financial services | Short term (<= 2 years) |
| Integration and change-management burden | -0.7% | Europe and North America | Medium term (2-4 years) |
| Data residency and SaaS procurement limits | -0.5% | Public sector and regulated sectors | Long term (>= 4 years) |
Source: Fact.MR analysis. Updated Jul 8, 2026
- Legacy data normalization cost: Reconciliation engines still need dependable field mapping across bank files and processor records. Ledgers and internal applications often introduce different data structures that require separate mapping work before stable matching rules are deployed. In January 2026, the European Central Bank reported 16.8 billion euro-area credit transfers during the first half of 2025. Adoption is expected to slow among organizations that underestimate normalization work before automated matching produces stable results.
- Model governance limits: Machine-assisted matching and exception classification add value only when finance teams understand how suggestions affect controlled decisions. Opaque recommendations weaken confidence during audit review and create additional validation work for internal control owners. Deployment is projected to remain selective among vendors unable to separate deterministic matching rules from assistive models or provide clear review histories.
- Integration and change burden: Reconciliation projects often touch banks and payment processors before records reach enterprise systems. Data warehouses and older finance applications add interface ownership questions during implementation when teams assign maintenance responsibility for source changes. In July 2025, Deutsche Bundesbank reported 337 million SEPA instant credit transfers during 2024 across Germany’s payment system. Implementation cycles are anticipated to lengthen under frequent source-format changes and shifting interface ownership that outpace finance teams’ control-mapping updates.
- Data residency and SaaS procurement: Cloud deployment does not remove jurisdictional obligations around financial records and outsourced ICT controls. Public agencies and regulated institutions often need detailed review of hosting locations and subcontractors before approving reconciliation workloads for hosted deployment. Recovery arrangements and access rights also require formal approval before deployment under internal resilience policies and third-party technology governance processes. Demand is estimated to progress more slowly among procurement teams unable to align provider architecture with local records policy and third-party risk requirements.
Which countries are scaling Reconciliation Software Market fastest?
India 14.9%; China 14.2%; Australia 12.9%; United Kingdom 12.6%; United States 12.4%.
Reconciliation Software Market is segmented into North America, Europe, Asia Pacific, Central and South America, and the Middle East and Africa.
| COUNTRY | CAGR |
|---|---|
| India | 14.9% |
| China | 14.2% |
| Australia | 12.9% |
| United Kingdom | 12.6% |
| United States | 12.4% |
| Germany | 12.1% |
| Japan | 11.8% |
Source: Fact.MR analysis. Updated Jul 8, 2026
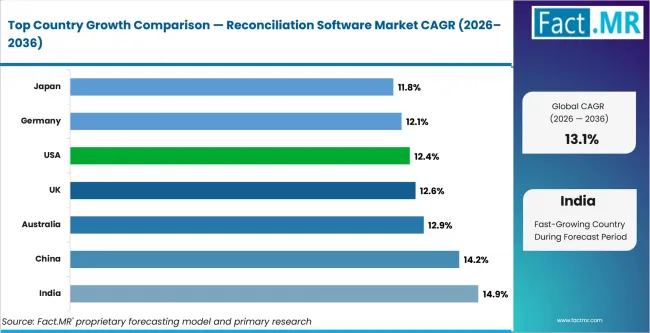
Reconciliation Software Market Cagr Analysis By Country | Source: Fact.MR
What is propelling India's expansion?
14.9% CAGR, driven by instant-payment scale and broad bank participation between 2026 and 2036.
India’s market is expanding as exceptionally high instant-payment volumes turn reconciliation into a continuous operational requirement for finance teams. In April 2026, the Press Information Bureau reported 21.70 billion UPI transactions during January 2026 across India’s interoperable payment network. The market is expected to record a 14.9% CAGR between 2026 and 2036 due to stronger connections between payment confirmations and ledger controls. Local providers gain a clearer route when implementations support high-volume payment data and bank-specific operating workflows.
How is China scaling Reconciliation Software demand?
14.2% CAGR, supported by high digital-payment activity and standardized transaction infrastructure during the forecast period.
China’s reconciliation requirements are expanding as digital payment systems generate large transaction trails that finance teams must match with enterprise records. In December 2025, official government reporting placed cumulative digital yuan transactions at 3.48 billion by the end of November. The market is projected to post a 14.2% CAGR during the forecast period due to reconciliation work around digital payment records and enterprise ledgers. Finance teams improve control when software handles localized formats and produces clear evidence near domestic transaction systems.
What supports the Australia outlook?
12.9% CAGR, reinforced by migration from batch account-to-account payments toward real-time rails over the forecast period.
Australia’s outlook is shaped by a major payment-system transition that requires finance teams to maintain control continuity across legacy and real-time rails. The Reserve Bank of Australia reported that the industry intends to decommission BECS by June 2030. Demand is anticipated to advance at a 12.9% CAGR during the forecast period due to reconciliation needs around New Payments Platform migration and legacy system retirement. Providers gain an advantage when migration tools preserve rule consistency and exception visibility throughout the transition.
What underpins growth in the United Kingdom?
12.6% CAGR, backed by high-value payment controls and richer structured payment data between 2026 and 2036.
United Kingdom demand is strengthening as record CHAPS activity increases the operational importance of rapid matching and dependable exception investigation. Bank of England statistics show that CHAPS processed a record 53.3 million payments during 2025. The market is estimated to post a 12.6% CAGR across the 2026 to 2036 period due to growing payment-control requirements. Bank operations teams gain stronger oversight when payment details connect directly with ledger evidence and exception ownership.
How is Reconciliation Software demand developing in the United States?
12.4% CAGR, driven by diverse payment rails and complex enterprise finance estates throughout the forecast period.
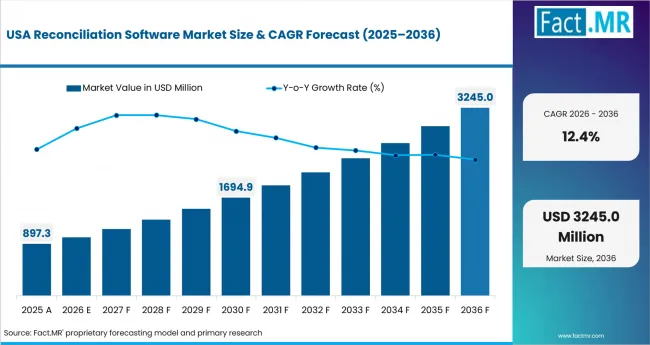
Reconciliation Software Market Country Value Analysis | Source: Fact.MR
United States demand is deepening as high wholesale payment volumes combine with fragmented enterprise systems and varied settlement schedules. The market is forecast to record a 12.4% CAGR over the forecast decade due to demand for common control layers across payment records with different operating rhythms. Vendors improve account access by normalizing varied sources while giving operations teams direct ownership of rules and exception workflows.
Who are the principal Reconciliation Software Market providers?
BlackLine and Trintech anchor direct finance reconciliation coverage, while AutoRek and SmartStream Technologies strengthen payment and capital-markets controls.
BlackLine competes through account reconciliation and transaction matching workflows, while Trintech supports reconciliation and financial close processes. In September 2025, AutoRek launched ARIA to support matching and exception work. Competition is expected to center on deployment fit and source-system connectivity across finance operations. Suppliers will also compete on matching-rule governance and implementation support across recurring reconciliation workflows.
Which companies are the key providers?
BlackLine, Trintech, AutoRek, SmartStream Technologies, Duco, FIS, ReconArt
- BlackLine
- Trintech
- AutoRek
- SmartStream Technologies
- Duco
- FIS
- ReconArt
Bibliography
- AutoRek. (2025, September 9). AutoRek ARIA: Multi-skilled AI agent launches for financial reconciliation operations. AutoRek.
- Bank of England. (2026, July). Payment and settlement statistics. Bank of England.
- BlackLine, Inc. (2026, February 26). Annual report on Form 10-K for the year ended December 31, 2025. BlackLine, Inc.
- Deutsche Bundesbank. (2025, July 23). Card payments are growing steadily. Deutsche Bundesbank.
- Duco. (2026, May 27). Duco launches the first agentic operations platform for financial services. Duco.
- European Central Bank. (2026, January 29). Payments statistics: First half of 2025. European Central Bank.
- European Commission. (2025, July 3). A shorter settlement cycle. Directorate-General for Financial Stability, Financial Services and Capital Markets Union.
- European Supervisory Authorities. (2026, June 3). ESAs publish the first report on DORA major ICT-related incidents. European Banking Authority.
- Federal Reserve Board. (2026, February 26). Commercial Automated Clearinghouse transactions processed by the Federal Reserve: Annual data. Board of Governors of the Federal Reserve System.
- Federal Reserve Board. (2026, July 2). National payment volumes, top-line data, calendar years 2015–2024. Board of Governors of the Federal Reserve System.
- Federal Reserve Financial Services. (2026, April 21). FedNow Service volume and value statistics. Federal Reserve Banks.
- Federal Reserve Financial Services. (2026, January 26). Fedwire Funds Service: Annual statistics. Federal Reserve Banks.
- FIS. (2026, May 10). FIS selected to streamline reconciliations for Australia’s largest bank. FIS.
- Government of China. (2025, December 29). China to enhance digital yuan management with deposit-like features. State Council of the People’s Republic of China.
- Press Information Bureau. (2026, April 11). From queues to QR codes: India’s payment revolution. Government of India.
- ReconArt. (2026, July 3). ReconArt integrates with Solana to support stablecoin remittance and agentic payments reconciliation. ReconArt.
- Reserve Bank of Australia. (2025, September). Payments System Board annual report 2025. Reserve Bank of Australia.
- SmartStream Technologies. (2025, June 18). BSP PNG | BSP Financial Group: Smart reconciliations. SmartStream Technologies.
- Trintech. (2026, March 12). 6 of the top 10 global banks trust Trintech to power daily reconciliation and financial close. Trintech.
This Report Addresses
- The report provides strategic intelligence on Reconciliation Software across Component and Deployment choices that shape finance-control operating models.
- Segment analysis covers Software and Cloud as the largest 2026 share categories across the first two segmentation dimensions.
- Regional outlook evaluates India and China alongside Australia, while the United Kingdom and United States complete the country comparison.
- Competitive analysis profiles BlackLine and Trintech alongside AutoRek and SmartStream Technologies across reconciliation and exception-control capabilities. Duco and FIS are followed by ReconArt in the provider set that represents active 2026 reconciliation software coverage.
- Component assessment covers Software and Services alongside API Tools and API Connectors used across financial record matching workflows. Managed Platform models complete the component coverage used across reconciliation operations that need provider-supported technology and service delivery.
- Application assessment covers Workflow Automation and Analytics alongside Governance and Integration across recurring finance control processes and exception management. Compliance requirements complete the application coverage across recurring financial controls that preserve review evidence and documented decision history.
What does the Reconciliation Software Market cover?
Software and Services together with API Tools and Managed Platform offerings used to match financial records and control exceptions.
The Reconciliation Software Market covers software and related services used to compare financial records across bank and payment systems while routing unmatched items into controlled investigation workflows. Core purchased functions include transaction matching and account reconciliation, with exception management and approval workflows preserving reviewer evidence for unresolved financial record differences.
The market differs from broad accounting suites owing to commercial value centered on record comparison and controlled mismatch resolution across recurring finance controls. General ledger software and payment processing platforms remain outside the boundary unless reconciliation functionality is sold as a defined module or managed service.
What is included in the scope?
Reconciliation software used across finance and payment operations together with treasury and shared-service control environments.
The scope includes Software and Services alongside API Tools and API Connectors, while Managed Platform offerings sit within broader Office of the CFO software workflows. Deployment coverage spans Cloud and On-premise models together with Hybrid structures, while real-time payment systems provide context for continuous transaction confirmation and exception control. Organization coverage includes SME and Large Enterprise accounts together with Public Sector Buyers managing different procurement and implementation requirements. Workflow Automation and Analytics sit alongside Governance and Integration functions supporting matching and exception investigation. Financial analytics platforms frame downstream analysis, while Compliance remains included when reconciliation workflows preserve review evidence. End-use coverage spans BFSI and Retail together with Manufacturing accounts managing recurring matching and controlled exception work.
What is excluded from the scope?
General ledger suites and standalone payment processing platforms are outside the scope when reconciliation is not sold as a defined function.
The scope excludes bookkeeping applications and ERP finance modules that do not provide a defined reconciliation control function. Payment gateways remain outside the scope under the same boundary condition when their commercial function centers on transaction routing. Fraud screening and transaction monitoring products are also excluded unless reconciliation and exception resolution form a separately purchased workflow inside the offering.
How was the analysis built?
120+ sources, 40+ company portfolios, 25+ countries, 20+ interviews.
- Primary Research
- Primary research includes interviews with financial controllers and reconciliation managers involved in recurring account controls. Treasury operations teams and payment operations heads provide workflow input on reconciliation timing and recurring exception investigation responsibilities. Shared-service leaders and implementation partners add migration evidence, while finance technology procurement teams inform selection criteria.
- Desk Research
- Desk research reviews central-bank payment statistics and securities settlement rules that change reconciliation timing across regulated finance and payment operations. Operational-resilience guidance and provider portfolios clarify control requirements that affect audit evidence and technology selection across financial institutions. Technical documentation and deployment materials show product boundaries, while customer announcements and official company developments confirm current commercial activity.
- Market-Sizing and Forecasting
- Forecasting uses market values and CAGR alongside transaction-volume direction and payment-rail change across the selected country markets. Reconciliation inventory complexity and cloud deployment mix shape adoption assumptions across organizations with different existing control structures and technology resources. Process migration activity and organization profile are assessed together with governed exception automation across end-use accounts.
- Data Validation and Update Cycle
- Forecast assumptions are validated through provider checks and technical interviews that test product scope and deployment status. Buyer requirements and implementation constraints are reviewed against portfolio mapping and official evidence that confirms market activity and operating conditions. Portfolio mapping and regulatory review support updates when payment infrastructure or control expectations change across the countries included in the forecast.
Segmentation
What is the report’s scope and coverage?
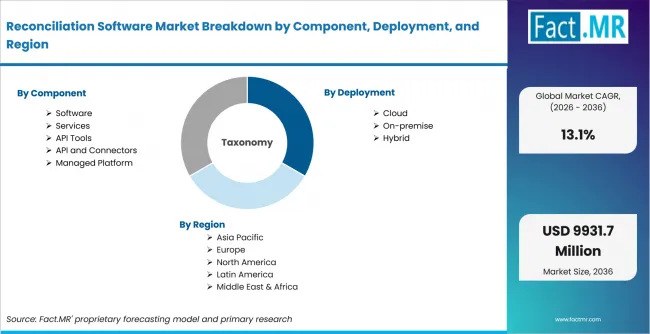
Reconciliation Software Market Breakdown By Component, Deployment, And Region | Source: Fact.MR
| Attribute | Details |
|---|---|
| Quantitative Units | USD million |
| Market Definition | Reconciliation software used to match financial records across bank, payment, ledger, treasury, and enterprise systems while routing unmatched items through controlled exception workflows. |
| Component | Software; Services; API Tools; API Connectors; Managed Platform |
| Deployment | Cloud; On-premise; Hybrid |
| Organization Size | SME; Large Enterprise; Public Sector Buyers |
| Application | Workflow Automation; Analytics; Governance; Integration; Compliance |
| End Use | BFSI; Retail; Manufacturing |
| Regions Covered | North America; Europe; Asia Pacific; Central and South America; Middle East and Africa |
| Countries Covered | India; China; Australia; United Kingdom; United States |
| Key Companies Profiled | BlackLine; Trintech; AutoRek; SmartStream Technologies; Duco; FIS; ReconArt |
| Forecast Period | 2026 to 2036 |
| Approach | Hybrid top-down and bottom-up approach using payment and settlement activity; reconciliation inventory complexity; cloud adoption; source-system connectivity; exception volumes; implementation cycles; organization profiles and supplier validation |
Source: Fact.MR analysis. Updated Jul 8, 2026
How is the market segmented?
-
By Component
- Software
- Services
- API Tools
- API Connectors
- Managed Platform
-
By Deployment
- Cloud
- On-premise
- Hybrid
-
By Organization Size
- SME
- Large Enterprise
- Public Sector Buyers
-
By Application
- Workflow Automation
- Analytics
- Governance
- Integration
- Compliance
-
By End Use
- BFSI
- Retail
- Manufacturing
-
By Region
- North America
- United States
- Canada
- Europe
- Germany
- United Kingdom
- France
- Italy
- Spain
- Asia Pacific
- India
- China
- Japan
- South Korea
- Australia
- Latin America
- Brazil
- Argentina
- Mexico
- Chile
- Middle East & Africa
- UAE
- Saudi Arabia
- South Africa
- North America
Frequently Asked Questions
Which component is estimated to dominate in 2026?
Which deployment model is anticipated to lead?
What share is SME projected to record in 2026?
Which application is forecast to lead in 2026?
Which end use is estimated to lead in 2026?
Which country is estimated to post the notable CAGR?
What CAGR is China projected to record during the forecast period?
How quickly is Australia anticipated to expand over the assessment period?
What CAGR is estimated for the United Kingdom market?
What growth rate is forecast for the United States market?
What factor is expected to drive adoption most strongly?
Which challenge is projected to restrain adoption most?
Why is Cloud anticipated to remain commercially relevant?
Why is BFSI estimated to record notable share?
Who worked on this report


Preview the report firsthand - request a free sample
Free SampleGet the brochure for pricing and purchase details
Download PDF