- Market Value (2025): USD 3.8 Bn
- Estimated Value (2026): USD 4.1 Bn
- Forecast Value (2036): USD 9.2 Bn
- CAGR (2026-2036): 8.4%
What is the Remote Inspection & NDT Services Market forecast to be worth by 2036?
USD 4.1 billion in 2026 to USD 9.2 billion by 2036 at 8.4% CAGR.
- The remote inspection and NDT services market reached USD 3.8 billion in 2025 when oil, gas and infrastructure operators widened remote asset checks.
- Demand is projected to increase from USD 4.1 billion in 2026 to USD 9.2 billion by 2036.
- The market is forecast to record 8.4% CAGR from 2026 to 2036 while asset owners reduce confined-space entry and unplanned downtime.
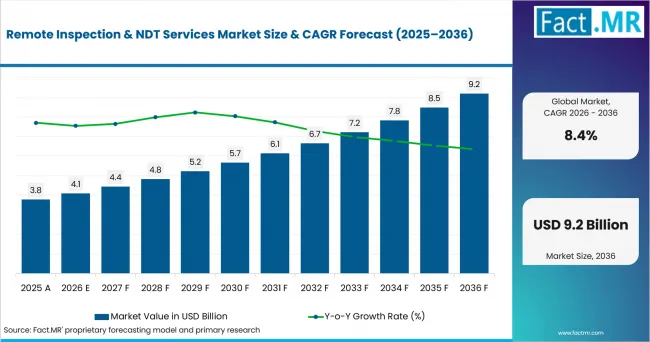
Remote Inspection & Ndt Services Market Value Analysis | Source: Fact.MR
What are the defining numbers behind Remote Inspection & NDT Services Market growth?
USD 5.1 billion absolute opportunity by 2036, led by Ultrasonic testing and Drones/UAV alongside Oil & gas.
- Demand Drivers in the Market
- PHMSA reported on August 3, 2026 that U.S. gas transmission and gathering systems had 413,360 miles of pipe in 2025, providing asset-base context for recurring pipeline inspection.
- Marine survey teams need UAV inspection drones and crawler access so confined tanks and offshore structures are checked with lower exposure time.
- Utility owners need repeatable imaging to document welds, pressure equipment and grid assets before outages become safety events.
- Infrastructure agencies need drone bridge inspection services and remote visual records for bridge, tunnel and tower portfolios that require frequent condition evidence.
- Key Segments Analyzed
- By Technique: Ultrasonic testing is expected to hold 29.0% share in 2026 due to its role in wall-thickness and weld checks.
- By Platform: Drones/UAV are projected to account for 34.0% share in 2026 because aerial access reduces rope work and scaffolding.
- By End-Use Industry: Oil & gas is anticipated to capture 31.0% share in 2026 owing to pipeline and offshore inspection cycles.
- Analyst Opinion at Fact.MR
- Shambhu Nath Jha, SeniorPrincipal Consultant at Fact.MR, states, “Remote inspection and NDT services are drawing attention because asset owners now ask for proof that access risk and defect sizing are handled together. Adoption is expected to depend on providers that combine certified technicians with robotic access and clean inspection records. The clearest commercial case comes from reliable data handover, not equipment access alone.”
- Strategic Implications
- Asset owners should align inspection intervals with failure modes before platform choice locks the work plan.
- Drone teams should document wind, lighting and confined-space limits before inspection evidence is accepted.
- Investors should separate asset-integrity specialists from general testing firms that lack remote field capability.
Canada is projected to record 10.2% CAGR through 2036 owing to pipeline density and gas-linked inspection work. The United States is expected to post 9.4% CAGR as regulated energy corridors and bridge owners expand remote evidence use. France is anticipated to advance at 9.3% CAGR due to energy production recovery and aerospace-linked manufacturing. Norway is forecast to record 9.1% CAGR as offshore fields sustain inspection needs. Germany is estimated to reach 8.0% CAGR through power assets and industrial maintenance. The United Kingdom is projected to post 7.8% CAGR as offshore energy assets and power networks require safer inspection routes.
How does the Remote Inspection & NDT Services Market break down by segment?
Ultrasonic testing leads at 29.0%; Drones/UAV lead at 34.0%.
Which technique dominates?
Ultrasonic testing is projected to account for 29.0% share in 2026.
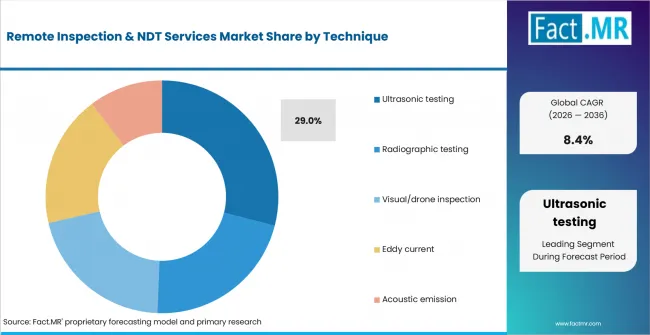
Remote Inspection & Ndt Services Market Analysis By Technique | Source: Fact.MR
Ultrasonic testing is estimated to lead Technique because it measures wall loss and weld quality without taking assets out of service. Radiographic testing supports weld evidence where acceptance records need images. Visual and drone inspection adds condition context before costly access work begins. Eddy current and acoustic emission serve narrower cases where surface cracking or active damage needs targeted proof.
What leads the Platform segment?
Drones/UAV are expected to hold 34.0% share in 2026.
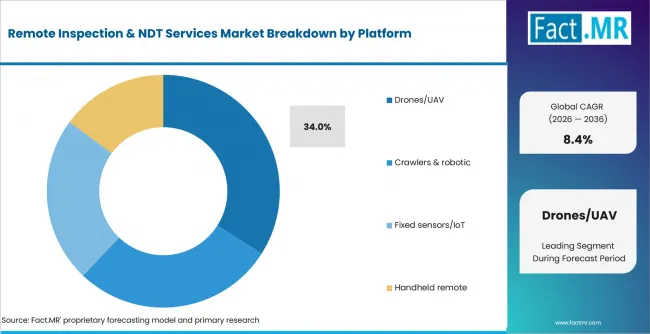
Remote Inspection & Ndt Services Market Analysis By Platform | Source: Fact.MR
Drones/UAV are forecast to lead Platform because drone services reach tanks, towers and offshore surfaces with less scaffolding. Industrial drone inspection follows where high-value assets need repeat images and defect maps. Crawlers and robotic units serve enclosed routes that require contact inspection. Fixed sensors and IoT systems support watch programs on high-risk assets.
How does End-Use Industry shape demand?
Oil & gas is anticipated to lead with 31.0% share in 2026.
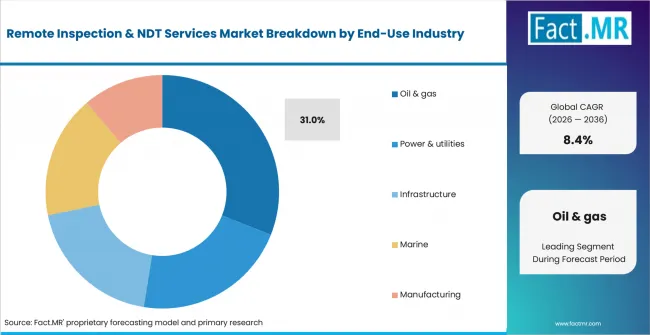
Remote Inspection & Ndt Services Market Analysis By End Use Industry | Source: Fact.MR
Oil & gas is anticipated to lead End-Use Industry demand because pipelines and offshore platforms need repeated integrity evidence. Intertek expanded its real-time corrosion under insulation screening offering on February 25, 2026, using radiographic inspection to assess insulated piping without removing insulation and identify anomalies as small as 250 microns. Power and utilities follow through outage-linked inspection work.
What is accelerating Remote Inspection & NDT Services Market adoption, and what is holding it back?
Safer asset access drives it; certification and data acceptance restrain it.
Drivers Impact Analysis
| DRIVER | (~) % IMPACT ON CAGR | GEOGRAPHIC RELEVANCE | IMPACT TIMELINE |
|---|---|---|---|
| Remote access to hazardous assets | +2.4% | United States, Canada, Norway | Short term (<= 2 years) |
| Pipeline integrity documentation | +2.0% | United States, Canada, Germany | Short term (<= 2 years) |
| Drone and crawler deployment | +1.6% | France, United Kingdom, Norway | Medium term (2-4 years) |
| Power and utility outage planning | +1.3% | Germany, United Kingdom, France | Medium term (2-4 years) |
| Data traceability for asset history | +1.1% | Global regulated assets | Long term (>= 4 years) |
- Remote access to hazardous assets: Remote inspection reduces confined-space entry and rope access. Operators still need certified judgment, but drones and crawlers move the first pass away from direct exposure. This is expected to move more inspection budgets toward remote access teams.
- Pipeline integrity documentation: Pipeline owners need repeatable wall-thickness and corrosion records. Remote NDT helps connect readings with maintenance history. Procurement is projected to favor providers that return clean data packages.
- Drone and crawler deployment: Drones capture evidence before crews enter assets. Crawlers add contact inspection where surfaces permit movement. Service teams are anticipated to combine both tools more often.
- Data traceability for asset history: Inspection files influence repair ranking and future access planning. Providers with clear data handover are forecast to gain better renewal prospects. Poorly structured reports lose value during audits.
Opportunity Impact Analysis
| OPPORTUNITY | (~) % IMPACT ON CAGR | GEOGRAPHIC RELEVANCE | IMPACT TIMELINE |
|---|---|---|---|
| AI-supported defect mapping | +1.4% | Marine, offshore and infrastructure | Medium term (2-4 years) |
| Real-time CUI screening | +1.1% | Oil & gas and chemicals | Medium term (2-4 years) |
| Remote survey centers | +0.9% | Marine and offshore hubs | Long term (>= 4 years) |
| Lifecycle integrity platforms | +0.7% | Regulated asset owners | Long term (>= 4 years) |
- AI-supported defect mapping: Automated image review is expected to shorten the path from capture to maintenance planning. Bureau Veritas used AI and machine learning in its June 2025 AGS 3D launch. Similar tools are anticipated to strengthen evidence packages for remote inspection.
- Real-time CUI screening: Insulated pipe screening is projected to help operators narrow follow-up inspection work. Remote methods reduce insulation removal when the first pass shows no anomaly. Field teams still need conventional checks when defect sizing requires direct access.
- Remote survey centers: Marine and offshore teams are building workflows around digital review. Adoption is projected to improve where classification and client acceptance are aligned. Service providers still need field teams that gather usable images and thickness readings.
- Lifecycle integrity platforms: Asset owners want inspection records tied to risk-based plans. Providers that manage inspection and data are expected to win multi-year work. The benefit is clearest where assets face repeat inspection cycles.
Restraints Impact Analysis
| RESTRAINT | (~) % IMPACT ON CAGR | GEOGRAPHIC RELEVANCE | IMPACT TIMELINE |
|---|---|---|---|
| Certification and personnel limits | -1.2% | United States, Germany, United Kingdom | Short term (<= 2 years) |
| Data acceptance by asset owners | -0.9% | Regulated oil, gas and marine assets | Short term (<= 2 years) |
| Harsh field conditions | -0.7% | Norway, Canada, United Kingdom | Medium term (2-4 years) |
| Robotic access limits | -0.5% | Confined tanks, pipelines, offshore assets | Long term (>= 4 years) |
- Certification and personnel limits: Remote platforms do not remove the need for qualified inspectors. Scaling is expected to slow where technician supply is tight. Service providers must keep training and certification records ready for audit review.
- Data acceptance by asset owners: Remote evidence must match codes and client reporting rules. Missing calibration records force repeat inspections. The restraint is strongest when asset owners have older procedures that name conventional methods.
- Harsh field conditions: Weather and restricted geometry often disrupt drones and crawlers. Providers are expected to keep conventional inspection capacity available. That backup capacity protects field schedules when remote access fails.
- Robotic access limits: Some assets have bends, coatings or obstructions that limit movement. Field teams must confirm route feasibility before selling a remote method. Overpromising access remains a risk during early bids.
Which countries are scaling Remote Inspection & NDT Services Market fastest?
- The country comparison spans 2.40 percentage points.
- Canada stays 0.80 point above the United States through pipelines and gas output.
- The United States stays 0.12 point above France due to energy and infrastructure checks.
- France stays 0.22 point above Norway through energy recovery and aerospace output.
- Norway stays 1.03 points above Germany because offshore fields need safety evidence.
- Germany stays 0.23 point above the United Kingdom through power and maintenance depth.
- The United Kingdom closes the range through offshore energy and power networks.
Comparable CAGRs create different entry conditions across the six countries. Full coverage spans North America, Latin America, Europe, East Asia, South Asia and Pacific, Middle East and Africa.
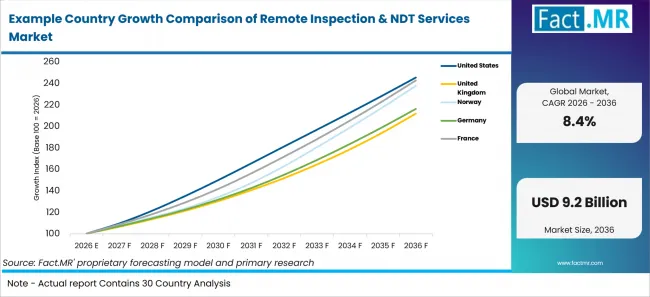
Example Country Growth Comparison Of Remote Inspection & Ndt Services Market | Source: Fact.MR
| Country | CAGR (2026-2036) |
|---|---|
| Canada | 10.2% |
| United States | 9.4% |
| France | 9.3% |
| Norway | 9.1% |
| Germany | 8.0% |
| United Kingdom | 7.8% |
What supports Canada adoption?
10.2% CAGR, supported by pipeline density and gas-linked inspection needs.
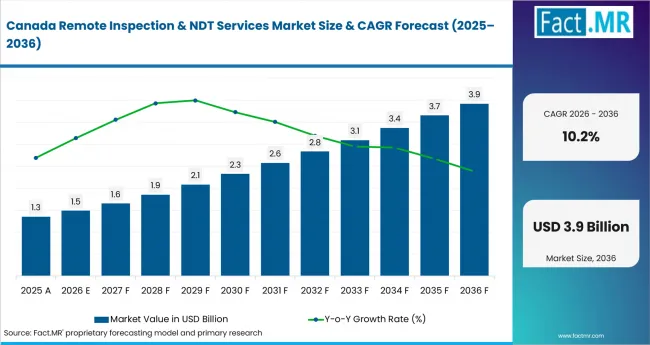
Remote Inspection & Ndt Services Market Country Value Analysis | Source: Fact.MR
Canada has a large gas asset and production base that requires recurring integrity management. Statistics Canada reported in April 2026 that Canadian marketable natural gas production reached 8.2 billion gigajoules in 2025, up 3.4% from 2024.
How is the United States scaling demand?
9.4% CAGR, driven by regulated energy corridors and infrastructure inspection needs.
U.S. growth reflects a market where remote evidence must satisfy asset owners that manage pipelines, bridges, refineries and terminals. Pipeline integrity programs create recurring demand for ultrasonic and radiographic checks. Infrastructure owners are projected to add drone records where shorter closures and safer access improve repair planning.
What is driving France’s growth from 2026 to 2036?
9.3% CAGR, backed by energy recovery and aerospace-linked output.
France’s growth is supported by improving energy conditions and aerospace-linked industrial activity. The country’s energy infrastructure and transport-equipment supply chains require reliable inspection, traceability and maintenance records. These requirements are expected to support demand for qualified service providers across aerospace, energy and related industrial applications through 2036.
How is Norway developing demand?
9.1% CAGR, shaped by offshore fields and petroleum safety checks.
Norway has a large offshore petroleum asset base with costly access routes. The Norwegian Offshore Directorate reported on February 20, 2026 that Norway produced 239.2 million Sm3 oil equivalent of marketable petroleum in 2025.
How does Germany perform?
8.0% CAGR, led by power assets and industrial maintenance needs.
Germany's industrial and power asset base creates recurring condition-monitoring requirements. Bundesnetzagentur reported on January 5, 2026 that actual electricity generation amounted to 437.6 TWh in 2025.
What supports United Kingdom growth?
7.8% CAGR, supported by offshore energy and power-network inspection.
The United Kingdom combines mature North Sea assets with a changing power-generation system. DESNZ reported on May 28, 2026 that low-carbon generation by major power producers reached 64.1% in the three months to March 2026.
Who leads the Remote Inspection & NDT Services Market?
SGS, Bureau Veritas, Applus+, Intertek, MISTRAS Group and TÜV Rheinland each publicly offer inspection or NDT capabilities relevant to this market.
SGS signed an agreement to acquire Applied Technical Services on July 2, 2025. ATS is a specialized testing, inspection, calibration and forensics provider with 2,100 employees and 85 facilities across the United States. Bureau Veritas strengthens marine and offshore inspection through AI-enabled digital survey tools, while Applus+ and Intertek deploy advanced NDT, remote inspection and robotic technologies to collect inspection data from pipelines and other difficult-to-access assets.
Which companies are the key providers?
Key companies include SGS, Bureau Veritas, Applus+, Intertek, MISTRAS Group and TÜV Rheinland.
- SGS
- Bureau Veritas
- Applus+
- Intertek
- MISTRAS Group
- TÜV Rheinland
Bibliography
- Bureau Veritas Marine & Offshore. (2025, June 12). Bureau Veritas launches AI-powered Augmented Surveyor 3D, for next-generation remote inspection.
- Bundesnetzagentur. (2026, January 5). Bundesnetzagentur publishes 2025 electricity market data.
- Department for Energy Security and Net Zero. (2026, July 30). Energy Trends: UK electricity. GOV.UK.
- Intertek. (2026, February 25). Intertek expands global inspection offering with real-time corrosion under insulation screening solution.
- Norwegian Offshore Directorate. (2026, February 20). Production forecasts. Norwegianpetroleum.no.
- Pipeline and Hazardous Materials Safety Administration. (2026, August 3). Annual report mileage for natural gas transmission & gathering systems.
- Service des données et études statistiques. (2026, April 22). Bilan énergétique de la France en 2025 - Données provisoires.
- SGS. (2025, July 2). SGS has signed an agreement to acquire ATS, a major American player.
- Statistics Canada. (2026, April 8). Natural gas in 2025: Record production, rising consumption and expanding exports.
This Report Answers
- The report provides strategic intelligence on the Remote Inspection & NDT Services Market across Technique and Platform choices that shape remote fieldwork.
- Segment analysis covers Ultrasonic testing and Drones/UAV as the share leaders within the 2026 market.
- Country outlook evaluates Canada and the United States alongside France and Norway. Germany and the United Kingdom complete the growth comparison.
- Competitive analysis profiles SGS and Bureau Veritas alongside Applus+ and Intertek. MISTRAS Group and TÜV Rheinland complete the provider set.
- Process assessment covers ultrasonic, radiographic and visual inspection. Eddy current and acoustic emission complete the technique view.
What does the Remote Inspection & NDT Services Market cover?
Remote inspection and NDT services cover field testing, robotic access and digital evidence used to judge asset condition without destructive sampling.
The Remote Inspection & NDT Services Market covers ultrasonic testing, radiographic testing and remote visual inspection for assets that remain in service or require safer access. Coverage extends to drones, crawlers, fixed sensors and handheld remote tools. It includes oil and gas alongside power and utilities. Infrastructure, marine and manufacturing end uses are included when service teams deliver condition evidence. Adjacent work in aerial inspection services is included only when it produces formal asset-condition evidence.
What is included in the scope?
The scope includes inspection services that generate defect, corrosion, wall-loss or visual condition evidence for industrial assets.
Included work covers remote NDT campaigns, drone-assisted inspections and robotic crawlers. Fixed sensor programs and remote condition checks are included when they produce inspection evidence. It also includes radiographic testing services where images are reviewed for weld or component acceptance. Adjacent industrial diagnostic tools are included when the service provider delivers inspection evidence and analysis for asset owners.
What is excluded from the scope?
General facility maintenance, manual visual checks without NDT evidence and unrelated testing services remain outside the scope of this market.
The scope excludes laboratory-only material testing when no remote field inspection is involved. It also excludes drones sold as hardware without inspection service delivery. General photography, security surveillance and construction progress monitoring are excluded unless they support formal asset-condition evidence. Company revenue without a clear link to remote inspection or NDT service delivery is also excluded.
How Was the Analysis Built?
The analysis draws on 120+ sources, 35+ company portfolios, 25+ countries, and more than 20 industry interviews.
- Primary Research: Primary research includes discussions with manufacturers, service providers, technology developers, distributors, end users, procurement teams, and subject-matter experts. These conversations examine purchasing priorities, product adoption, operational challenges, approval requirements, competitive positioning, and the factors that influence wider market acceptance.
- Desk Research: Desk research covers government statistics, regulatory publications, company filings, trade data, technical studies, industry associations, standards, public policy, and other authoritative sources. Every source used in the analysis is documented in the bibliography.
- Market Sizing and Forecasting: Market estimates combine historical performance, demand indicators, pricing and volume trends, segment shares, company participation, country-level growth, adoption patterns, investment activity, and barriers to market expansion.
- Data Validation and Update Cycle: Findings are validated by comparing primary interviews with public data, company activity, regulatory changes, trade patterns, and industry developments. Regular updates review new product launches, capacity changes, partnerships, approvals, procurement trends, and shifts in commercial adoption.
What is the report’s scope and coverage?
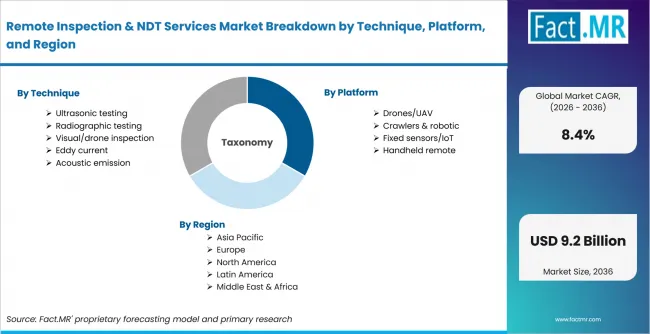
Remote Inspection & Ndt Services Market Breakdown By Technique, Platform, And Region | Source: Fact.MR
| Attribute | Details |
|---|---|
| Quantitative Units | USD billion |
| Market Definition | Remote inspection and NDT services used to examine industrial assets without damaging the asset or requiring full dismantling. The scope includes remote visual inspection, ultrasonic testing, radiography, robotic access and sensor-enabled condition checks. |
| Technique | Ultrasonic testing; Radiographic testing; Visual/drone inspection; Eddy current; Acoustic emission |
| Platform | Drones/UAV; Crawlers & robotic; Fixed sensors/IoT; Handheld remote |
| End-Use Industry | Oil & gas; Power & utilities; Infrastructure; Marine; Manufacturing |
| Regions Covered | North America; Latin America; Europe; East Asia; South Asia and Pacific; Middle East and Africa |
| Countries Covered | Canada; United States; France; Norway; Germany; United Kingdom |
| Key Companies Profiled | SGS; Bureau Veritas; Applus+; Intertek; MISTRAS Group; TÜV Rheinland |
| Forecast Period | 2026 to 2036 |
| Approach | Hybrid top-down and bottom-up approach using asset-integrity spending; inspection intervals; energy and infrastructure asset bases; remote-access adoption; NDT technique mix; country adoption patterns and company portfolio review |
How is the market segmented?
-
By Technique:
- Ultrasonic testing
- Radiographic testing
- Visual/drone inspection
- Eddy current
- Acoustic emission
-
By Platform:
- Drones/UAV
- Crawlers & robotic
- Fixed sensors/IoT
- Handheld remote
-
By End-Use Industry:
- Oil & gas
- Power & utilities
- Infrastructure
- Marine
- Manufacturing
-
By Region:
- North America
- Latin America
- Europe
- East Asia
- South Asia and Oceania
- Middle East and Africa