- Market Value (2025): USD 803.7 Mn
- Estimated Value (2026): USD 902.8 Mn
- Forecast Value (2036): USD 2887.7 Mn
- CAGR (2026-2036): 12.3%
What is the Retail Self-scanning Solutions Market forecast to be worth by 2036?
USD 902.8 million in 2026 to USD 2887.7 million by 2036, at a 12.3% CAGR.
- The retail self-scanning solutions market was valued at USD 803.7 million in 2025.
- Demand is projected to increase from USD 902.8 million in 2026 to USD 2887.7 million in 2036.
- The market is forecast to expand at a 12.3% CAGR during 2026 to 2036 as store networks extend self-scanning and invest in more dependable transaction management.
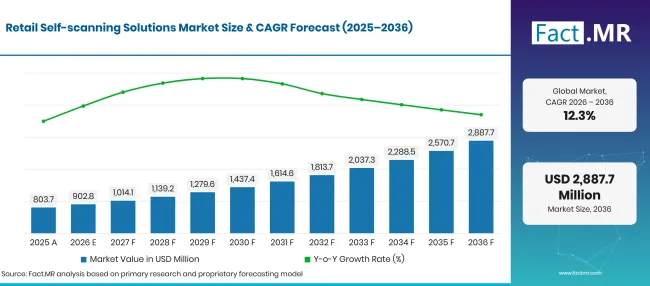
Retail Self Scanning Solutions Market Forecast Global | Source: Fact.MR
| Year | Basis | Market Value (USD million) |
|---|---|---|
| 2025 | Actual | 803.7 |
| 2026 | Estimate | 902.8 |
| 2036 | Forecast | 2887.7 |
| CAGR 2026 to 2036 | Forecast period | 12.3% |
Source: Fact.MR analysis. Updated Oct 27, 2026
What are the defining numbers behind Retail Self-scanning Solutions Market growth?
The forecast adds USD 1984.9 million in annual revenue between 2026 and 2036. Equipment remains the single largest component, but the more consequential spending decision is how to operate that equipment across hundreds of ordinary transactions and multiple stores. Pricing interfaces, basket recovery and staff interventions create service and software demand after installation. Retailers that fail to control those costs can expand their device estate without improving checkout economics.
- Demand Drivers in the Market
- The barcode transition sets a concrete timetable for parts of the market. GS1's December 2025 guidance calls for systems to handle both linear and 2D product identifiers by the end of 2027. [3] This is an industry readiness ambition rather than a legal deadline, but it exposes a gap between owning an imaging scanner and processing the information correctly. Demand for barcode software will extend to data interpretation and point-of-sale integration, not just replacement hardware.
- Merchandise loss is another barrier to rollout. ECR Retail Loss examined the influence of staffing, design and technology on fixed self-checkout accuracy in its 2026 study. [4] The research does not quantify losses from all forms of mobile self-scanning. Even within that limit, the implication is clear: a higher proportion of customer-operated transactions creates more occasions for missed scans, interventions and control failures. Those operating costs belong in the investment case from the outset.
- Price and promotion mismatches often become visible only when the shopper reaches payment. At that point, the customer has already invested time in the basket and is less tolerant of a restart. Providers that connect scanning with the retailer's live pricing and loyalty rules address a more expensive failure than a slow code read. In self-service kiosks, staff access and the location of payment controls can determine whether a problem is resolved quickly or becomes a queue.
- A multi-store rollout adds another layer of risk: a configuration error can be repeated across the estate. Device monitoring and controlled software releases help retailers distinguish an isolated scanner fault from a systemic payment or pricing problem. The most useful measures are incomplete transactions, repeat assistance requests and reconciliation errors, not the headline installation count.
- Key Segments Analyzed
- By Component: Hardware holds 42.3% of revenue in 2026. Renewal cycles and device servicing remain material even as software becomes more important to operating performance.
- By Technology: Barcode Scanning leads with 44.0% in 2026. Its position makes support for existing product identifiers and the transition to 2D codes a central purchasing issue.
- By Application: Supermarkets/Hypermarkets contribute 45.0% of 2026 revenue. Their varied baskets and promotion rules expose more transaction exceptions than a narrowly stocked store.
- By Deployment Mode: On-Premises accounts for 56.8% of revenue in 2026. Continuity of in-store transactions still carries weight alongside the appeal of central management.
- By End-User: Retailers represent 65.0% of revenue in 2026. They control the investment and absorb the operational consequences, although shoppers perform the scans.
- Analyst Opinion at Fact.MR
- Shambhu Nath Jha, Lead Consultant, Fact.MR
- The market is moving from a device-led buying decision to a transaction-led one. A scanner that reads quickly does not create value if the customer cannot pay the price shown on the shelf, correct an item or obtain assistance without starting again. That makes completed transactions, staff interventions and reconciliation accuracy stronger indicators of deployment quality than equipment counts. Hardware will remain a substantial share of spending, but the differentiation increasingly lies in integration and support. Providers capable of solving the same recurring problems across an entire retail estate are better positioned for renewal and expansion. There is little economic case for a faster reader when unresolved price or payment exceptions remain the binding constraint.
- Strategic Implications
- Store economics should determine the assistance model before another device is added. The cost of an intervention depends on how quickly staff are alerted, whether they can identify the issue and whether the basket survives the interruption. During peak periods, several simultaneous exceptions can turn nominally independent checkouts back into a staffed service bottleneck.
- Investment in fixed RFID readers makes sense only where the retailer has suitable tagging coverage and a reliable way to resolve ambiguous reads. A high-value or consistently tagged merchandise category may support the case; a mixed assortment with weak tag controls may not. The relevant comparison is the cost per accurate transaction, including exceptions and maintenance.
- When shelf labels, loyalty offers and basket totals disagree, shoppers tend to discover the problem at the worst point in the transaction. Integration with smart shelves matters only if product identities and pricing updates remain consistent through to payment. A connected shelf is not a solution to inconsistent pricing governance elsewhere in the store.
- Service accountability is frequently underestimated in mixed-vendor checkout estates. A scanner replacement does not repair a pricing-interface fault; a software update may not restore an interrupted payment. Contracts that assign responsibility across these boundaries can shorten outages and stop the same defect recurring in multiple stores.
Brazil has the fastest CAGR among the five profiled countries, followed by Japan and Germany. The United States represents a comparatively mature deployment opportunity. This is not one uniform adoption curve: newer installations face integration and support costs, while established estates increasingly need improvements to completed transactions and controls. Country strategies should reflect where the operating constraint actually sits.
How does the Retail Self-scanning Solutions Market break down by segment?
Hardware 42.3%; Barcode Scanning 44.0%; Supermarkets/Hypermarkets 45.0%; On-Premises 56.8%; Retailers 65.0% in 2026.
Why does hardware remain the largest component of self-scanning revenue?
The Hardware segment leads Component with a 42.3% revenue share in 2026.
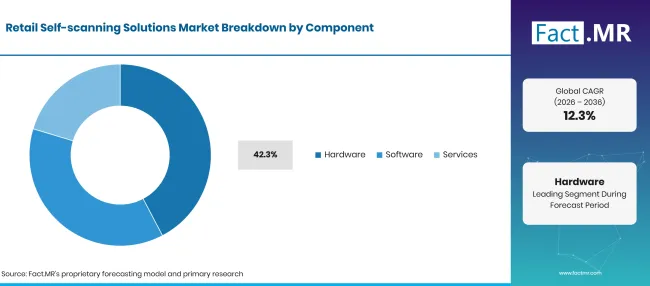
Retail Self Scanning Solutions Market Breakdown Component | Source: Fact.MR
| Component | Share (2026) |
|---|---|
| Hardware (Leading segment) | 42.3% |
| Other segments combined | 57.7% |
| Total | 100.0% |
Source: Fact.MR analysis. Updated Oct 27, 2026
Hardware holds 42.3% of revenue, making device reliability and renewal cycles commercially important even as software spending grows. For store-owned handheld units, charging, loss prevention, breakage and turnaround between shopping trips become recurring operating costs. Fixed equipment faces a different burden, including screen access, payment peripherals and service disruption during repairs. A reader's quoted capability alone does not describe either cost profile. Bring-your-own-phone scanning changes the capital requirement but not the responsibility for a completed purchase. The retailer still needs dependable product records, payment and support; the device's ownership simply moves outside the store. The economics of mobile and store-owned hardware should therefore be compared across the full transaction rather than by upfront scanner cost.
What keeps barcode scanning central as retail codes become more capable?
The Barcode Scanning segment leads Technology with a 44.0% revenue share in 2026.
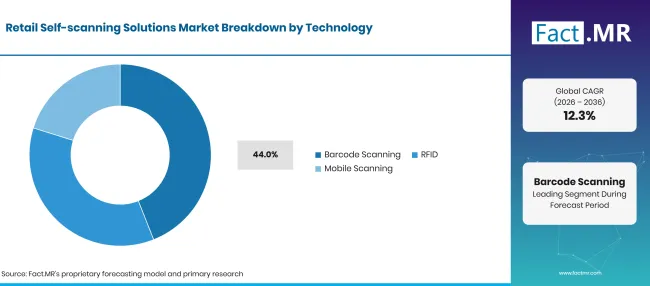
Retail Self Scanning Solutions Market Breakdown Technology | Source: Fact.MR
| Technology | Share (2026) |
|---|---|
| Barcode Scanning (Leading segment) | 44.0% |
| Other segments combined | 56.0% |
| Total | 100.0% |
Source: Fact.MR analysis. Updated Oct 27, 2026
Barcode Scanning leads with 44.0% of revenue because retailers already operate around recognised product identifiers. The near-term issue is compatibility. A new code format creates little value if the basket records the wrong item, quantity or price. Retailers need the data interpreted consistently across checkout, returns and price promotions before the richer code becomes operationally useful. GS1 explicitly envisages linear barcodes and 2D codes operating together; an imaging scanner alone does not establish readiness. [3] That turns the transition into an integration and testing programme. Stores must check the codes that suppliers actually print, how point-of-sale software handles them and what happens when information is missing or duplicated.
Why do supermarkets and hypermarkets present the largest application opportunity?
Supermarkets/Hypermarkets account for 45.0% of application revenue in 2026.
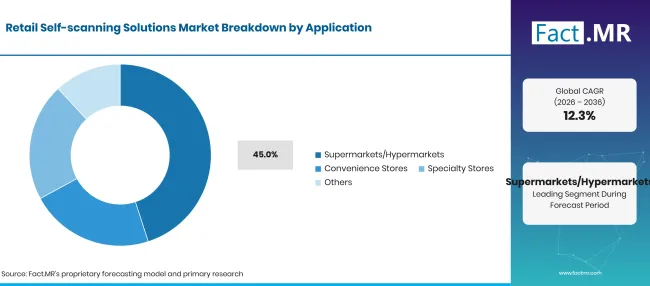
Retail Self Scanning Solutions Market Breakdown Application | Source: Fact.MR
| Application | Share (2026) |
|---|---|
| Supermarkets/Hypermarkets (Leading segment) | 45.0% |
| Other segments combined | 55.0% |
| Total | 100.0% |
Source: Fact.MR analysis. Updated Oct 27, 2026
Supermarkets and hypermarkets account for 45.0% of application revenue, placing mixed baskets at the centre of the market. Loose produce, multiples, weighed goods and changing offers create more opportunities for a basket mismatch than a narrow assortment. Scanning during the shopping trip can improve the final payment experience, but only if these exceptions are managed before the shopper reaches checkout. One unresolved item can disrupt an entire basket. A quantity correction, unreadable label or age-restricted purchase may require an employee even when the remaining products scan normally. The economics therefore depend on intervention frequency and response time as well as customer throughput. Store layout can amplify or reduce the cost of each exception.
Why does on-premises deployment retain a leading position?
The On-Premises segment leads Deployment Mode with a 56.8% revenue share in 2026.
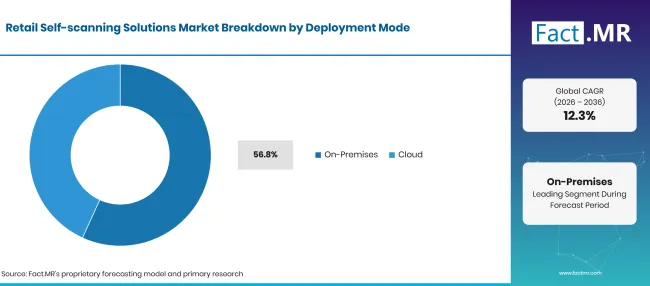
Retail Self Scanning Solutions Market Breakdown Deployment Mode | Source: Fact.MR
| Deployment Mode | Share (2026) |
|---|---|
| On-Premises (Leading segment) | 56.8% |
| Other segments combined | 43.2% |
| Total | 100.0% |
Source: Fact.MR analysis. Updated Oct 27, 2026
On-Premises systems retain a 56.8% share because checkout continuity is a store-level requirement. Processing locally can limit dependence on an outside connection, but not if core pricing or payment functions still require a remote service. The distinction is operational rather than ideological: the right arrangement is the one that completes transactions and reconciles them reliably during routine failures. Large chains need central oversight and consistent updates, while individual stores need dependable execution. Those needs can coexist. The more useful procurement questions concern recovery procedures, configuration control and who owns an outage, rather than treating 'cloud' and 'local' as complete descriptions of the operating architecture.
How do retailer priorities shape a service operated by shoppers?
The Retailers segment leads End-User with a 65.0% revenue share in 2026.
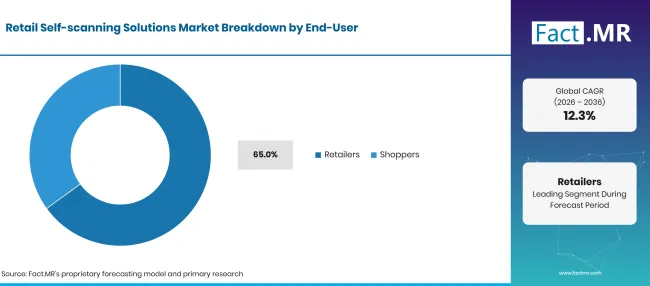
Retail Self Scanning Solutions Market Breakdown End User | Source: Fact.MR
| End-User | Share (2026) |
|---|---|
| Retailers (Leading segment) | 65.0% |
| Other segments combined | 35.0% |
| Total | 100.0% |
Source: Fact.MR analysis. Updated Oct 27, 2026
Retailers account for 65.0% of revenue because they purchase and maintain the service, set price rules and bear the costs of errors and shrink. A favourable customer experience helps adoption, but it cannot compensate for transactions the store cannot reconcile. The investment decision is therefore a balance of completed sales, staffing and control costs, not simply faster passage through a queue. Shoppers decide whether to use the service but do not ordinarily buy its underlying infrastructure. Their tolerance for uncertainty is low: they need to see what is in the basket, correct an error and finish payment. Retailers have to preserve those simple actions while applying controls that prevent unrecorded goods from leaving the store. Adoption is more durable when neither objective dominates the other.
What makes a self-scanning rollout sustainable after the initial launch?
A rollout is tested when a transaction goes wrong at a busy hour. Missing prices, abandoned payment attempts and requests for assistance are routine operating events, not edge cases. If resolving them sends customers to a staffed lane, the store loses part of the labour and capacity benefit that justified self-scanning in the first place.
The next investment decision should follow the operating evidence. High levels of incomplete baskets may point to a poor interface; recurrent price disputes point to product-data problems; frequent approvals may point to staffing and policy. Adding devices will not solve all three. Integration, support and merchandise loss are major constraints on scale, particularly when pilots are copied into stores with different layouts or product mixes.
Drivers Impact Analysis
| DRIVER | (~) % IMPACT ON CAGR | GEOGRAPHIC RELEVANCE | IMPACT TIMELINE |
|---|---|---|---|
| Expansion of customer-operated scanning across store networks | +1.3% | Germany, Japan, Brazil, United States | 2026 to 2032 |
| Integration of scanning with pricing, loyalty and payment | +0.9% | Global | 2026 to 2031 |
| Preparation for linear and 2D barcode coexistence | +0.6% | Europe, North America, Asia Pacific | 2026 to 2029 |
| Replacement and renewal of heavily used scanning hardware | +0.7% | Germany, United States, United Kingdom, Japan | 2027 to 2034 |
| Operational software supporting consistent multi-store deployment | +0.5% | Retail chains worldwide | 2027 to 2036 |
Source: Fact.MR analysis. Updated Oct 27, 2026
Opportunity Impact Analysis
| OPPORTUNITY | (~) % IMPACT ON CAGR | GEOGRAPHIC RELEVANCE | IMPACT TIMELINE |
|---|---|---|---|
| Better exception handling and staff assistance tools | +0.8% | Europe, North America, Japan | 2026 to 2031 |
| Mobile scanning tied to an existing retailer application | +0.6% | Brazil, Europe, United States | 2027 to 2034 |
| RFID-enabled purchasing in suitable tagged merchandise categories | +0.4% | Japan, Europe, North America | 2028 to 2036 |
| Managed monitoring and support for distributed store estates | +0.7% | Global | 2027 to 2033 |
Source: Fact.MR analysis. Updated Oct 27, 2026
Restraints Impact Analysis
| RESTRAINT | (~) % IMPACT ON CAGR | GEOGRAPHIC RELEVANCE | IMPACT TIMELINE |
|---|---|---|---|
| Merchandise loss and inaccurate basket capture | -0.9% | Global | 2026 to 2036 |
| Integration with fragmented pricing and payment systems | -0.6% | Retailers with mixed technology estates | 2026 to 2031 |
| Frequent customer interventions and insufficient assistance | -0.5% | High-traffic grocery and convenience stores | 2026 to 2032 |
| Upfront equipment and rollout costs | -0.4% | Brazil and cost-sensitive retail formats worldwide | 2026 to 2030 |
Source: Fact.MR analysis. Updated Oct 27, 2026
Which countries are scaling the Retail Self-scanning Solutions Market through 2036?
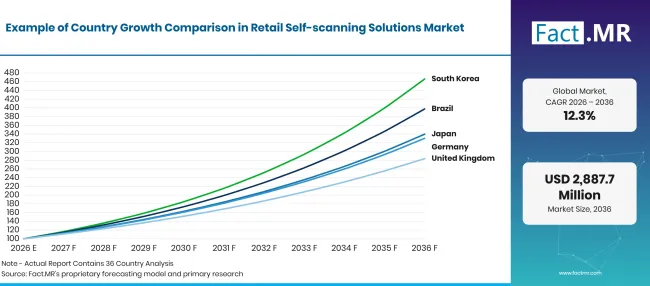
Retail Self Scanning Solutions Market Growth Index | Source: Fact.MR
| Country | CAGR (2026 to 2036) |
|---|---|
| Germany | 12.7% |
| Brazil | 14.8% |
| United States | 9.6% |
| United Kingdom | 11.0% |
| Japan | 13.0% |
Source: Fact.MR analysis. Updated Oct 27, 2026
How does Germany's installed mobile scanning base change the opportunity?
Germany: 12.7% CAGR from 2026 to 2036. An established service footprint creates room for extension and improvement.
EHI recorded mobile self-scanning in 3,646 German stores in its 2025 count, including handheld, cart-mounted and smartphone formats. [2] Germany is therefore past a purely experimental stage in at least part of its retail base. Installed coverage creates a sizeable market for maintenance, consistent software updates and improvements that reduce friction across several scanning formats.
The next growth step need not be another installation. Operators can compare abandoned baskets, time spent waiting for help and price disputes across stores to identify which locations are underperforming. A provider able to remove a recurrent problem from an established service has a measurable renewal argument without relying on higher device numbers.
What supports Brazil's faster forecast expansion?
Brazil: 14.8% CAGR from 2026 to 2036. Growth depends on making the store-level investment practical to deploy and support.
Brazil leads the five-country forecast at 14.8%, but the starting economics of each store will matter more than a national growth rate. Integration with existing payment and retail software can turn an affordable reader into an expensive rollout. A viable deployment must budget for local support and the staff time used to clear transaction exceptions, not only purchase and installation.
Scale will favour configurations that can be repeated without recreating the integration work at every outlet. Where retailers already have widely used customer applications, mobile scanning may reduce dedicated-device requirements. That saving holds only if the application keeps basket records accurate and payment recovery straightforward.
Where can United States retailers improve the return on established deployments?
United States: 9.6% CAGR from 2026 to 2036. Transaction completion offers a more useful growth test than device numbers alone.
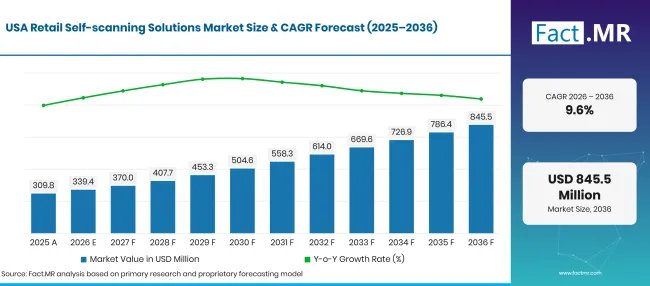
Retail Self Scanning Solutions Market Forecast Usa | Source: Fact.MR
The United States market is projected at USD 339.4 million in 2026. Within that substantial installed opportunity, renewal spending should be assessed against the actual cause of checkout delays. Some stores need additional capacity; others need better price synchronisation or faster staff interventions. Treating all of these as hardware shortages risks directing capital to the wrong constraint.
The stronger competitive offer is the one that helps a retailer change operating capacity without compromising transaction control. Service reliability, flexible assistance arrangements and consistent data across the estate can justify renewal even where adding another terminal yields little improvement. That is a different proposition from the first deployment sale.
Why should United Kingdom deployments treat assistance as part of the product?
United Kingdom: 11.0% CAGR from 2026 to 2036. Clear intervention routines help connect customer convenience with transaction control.
ECR's 2026 fixed-checkout research included responses from 39 retailers and explored the interaction of technology, design and staff interventions. [4] It is not a UK-specific estimate of mobile-scanning loss, and should not be read as one. Its relevance to the UK market is the operating problem it isolates: customers who need help must be able to complete the sale without excessive disruption.
Intervention design affects both labour and satisfaction. Alerts that reach the wrong employee or lose the original basket create repeated work; clear escalation rules let staff resolve exceptions quickly. The point is not to remove human involvement at any cost, but to reserve it for events where it improves accuracy or preserves a sale.
How can Japan turn compact scanning services into a dependable shopping routine?
Japan: 13.0% CAGR from 2026 to 2036. Clear interaction and quick recovery support deployment across varied store layouts.
Japan's 13.0% forecast points to a different deployment challenge: maintaining a usable service in stores where space and customer flow can be constrained. Adding a scanning point will not improve throughput if the assistance area obstructs checkout or the interface leaves customers uncertain about payment. Compact hardware and clear interaction design have direct operating implications in that setting.
A retailer's technology choice should follow merchandise and operating requirements. Barcode, RFID and mobile arrangements impose different demands on tagging, devices and support, but the customer should encounter consistent prices and payment behaviour. Providers that can maintain that consistency across more than one format have a stronger case for extension across a retail estate.
Who leads the Retail Self-scanning Solutions Market?
The competitive divide is no longer simply among equipment vendors. Retailers also compare who can keep their basket and payment data correct throughout the transaction. NCR Voyix's 2025 annual report describes offerings that combine barcode scanning, computer vision and RFID, with cloud management alongside local operation. [5] These are supplier-reported capabilities, not independently measured store outcomes; deployment performance remains the decisive test.
Corporate continuity also matters when long-running store contracts are renewed. NCR Corporation became NCR Voyix Corporation in 2023. [5] Wincor Nixdorf was acquired in 2016 and now represents a legacy identity within Diebold Nixdorf, not a separate contemporary rival. [1] Retailers need clarity about the current party responsible for service and software support, especially when equipment and payment integrations cross supplier boundaries.
Which companies are the key providers?
Key Companies: Zebra Technologies, Datalogic, Honeywell International, NCR Corporation, Fujitsu Limited, Diebold Nixdorf, Toshiba Global Commerce Solutions, Seiko Epson Corporation, Panasonic, and Wincor Nixdorf.
- Zebra Technologies
- Datalogic
- Honeywell International
- NCR Corporation
- Fujitsu Limited
- Diebold Nixdorf
- Toshiba Global Commerce Solutions
- Seiko Epson Corporation
- Panasonic
- Wincor Nixdorf
Bibliography
- [1] Diebold, Incorporated. (2016, August 15). Diebold completes Wincor Nixdorf acquisition. [Press release].
- [2] EHI Retail Institute. (2025, November 5). Jede 18. Kasse ist eine SB-Kasse.
- [3] GS1. (2025, December). 2D barcodes at retail point-of-sale implementation guideline (Release 1.1.0).
- [4] Hopkins, M. (2026, June 16). Self-checkout loss report 2026. ECR Retail Loss.
- [5] NCR Voyix Corporation. (2026). 2025 annual report (Form 10-K). U.S. Securities and Exchange Commission.
This Report Answers
- Why does Hardware retain the largest component share?
- How does the transition to 2D barcodes affect scanning investment?
- What makes supermarket and hypermarket deployments commercially distinct?
- How do local processing and cloud management influence deployment choices?
- Which assistance and reconciliation requirements shape expansion across countries?
What does the Retail Self-scanning Solutions Market cover?
The report covers Retail Self-scanning Solutions across components, technologies, applications, deployment modes and end users. It examines the relationship between customer-operated scanning and the wider transaction, including product records, pricing, payment and assistance. Country coverage includes Germany, Brazil, the United States, the United Kingdom and Japan. The competitive assessment considers equipment suppliers and transaction-platform providers, with legacy corporate identities distinguished from current organisations. Fixed-checkout studies are used with their original scope and are not treated as direct measurements of all mobile scanning formats.
What is included in the scope?
Included scope comprises Hardware, Software and Services supporting customer-operated retail scanning. Technology categories are Barcode Scanning, RFID and Mobile Scanning, applied across Supermarkets/Hypermarkets, Convenience Stores, Specialty Stores and Others. Deployment coverage includes On-Premises and Cloud arrangements, with Retailers and Shoppers treated as distinct end-user relationships. Associated basket handling, checkout integration, device management and implementation support are considered where they form part of the self-scanning solution.
What is excluded from the scope?
The market excludes the retail value of goods purchased through self-scanning systems, general online commerce revenue and standalone payment services without a self-scanning function. Warehouse inventory readers, industrial tracking systems and staff-only scanning equipment fall outside scope unless incorporated into the covered customer service. General shelf infrastructure and store management software are discussed only where their interfaces affect self-scanning, without including their unrelated revenues.
How Was the Analysis Built?
The analysis draws on 120+ sources, 35+ company portfolios, 25+ countries, and more than 20 industry interviews.
- Primary Research: Primary research includes discussions with manufacturers, service providers, technology developers, distributors, end users, and subject-matter experts. These conversations examine purchasing priorities, product adoption, operational challenges, approval requirements, competitive positioning, and the factors that influence wider market acceptance.
- Desk Research: Desk research covers government statistics, regulatory publications, company filings, trade data, technical studies, industry associations, standards, public policy, and other authoritative sources. Every source used in the analysis is documented in the bibliography.
- Market Sizing and Forecasting: Market estimates combine historical performance, demand indicators, pricing and volume trends, segment shares, company participation, country-level growth, adoption patterns, investment activity, and barriers to market expansion.
- Data Validation and Update Cycle: Findings are validated by comparing primary interviews with public data, company activity, regulatory changes, trade patterns, and industry developments. Regular updates review new product launches, capacity changes, partnerships, approvals, and shifts in commercial adoption.
Segmentation
What is the report’s scope and coverage?
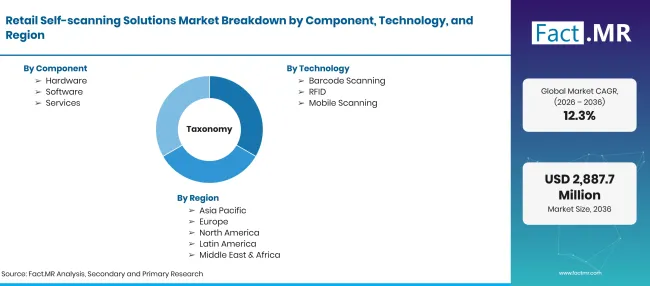
Retail Self Scanning Solutions Market Taxonomy 1 | Source: Fact.MR
| Attribute | Details |
|---|---|
| Quantitative Units | USD Million |
| Market Definition | Hardware, software, and related services that allow retail customers to scan products and complete purchases using handheld scanners, mobile applications, and self-service checkout systems. |
| Component | Hardware; Software; Services |
| Technology | Barcode Scanning; RFID; Mobile Scanning; Others |
| Application | Supermarkets/Hypermarkets; Convenience Stores; Specialty Stores; Others |
| Deployment Mode | On-Premises; Cloud |
| End-User | Retailers; Consumers; Others |
| Regions Covered | North America; Latin America; Western Europe; Eastern Europe; East Asia; South Asia & Pacific; Middle East & Africa |
| Countries Covered | United States; Germany; United Kingdom; Japan; Brazil |
| Companies Profiled | Zebra Technologies; Datalogic; Honeywell International; NCR Corporation; Fujitsu Limited; Diebold Nixdorf; Toshiba Global Commerce Solutions; Seiko Epson Corporation; Panasonic; Wincor Nixdorf |
| Forecast Period | 2026 to 2036 |
| Market Analysis Approach | Top-down and bottom-up assessment of retail installations, scanning hardware, software integration, transaction management, maintenance services, and store-level adoption. |
Source: Fact.MR analysis. Updated Oct 27, 2026
How is the market segmented?
-
By Component
- Hardware
- Software
- Services
-
By Technology
- Barcode Scanning
- RFID
- Mobile Scanning
-
By Application
- Supermarkets/Hypermarkets
- Convenience Stores
- Specialty Stores
- Others
-
By Deployment Mode
- On-Premises
- Cloud
-
By End-User
- Retailers
- Shoppers
-
By Region
- North America
- Latin America
- Western Europe
- Eastern Europe
- East Asia
- South Asia & Pacific
- Middle East & Africa
Frequently Asked Questions
How large is the retail self-scanning solutions market?
What is the projected growth rate?
Which component and technology categories lead the market?
Which application and deployment categories hold the largest shares?
Which country grows fastest among those profiled?
Who worked on this report


Preview the report firsthand - request a free sample
Free SampleGet the brochure for pricing and purchase details
Download PDF