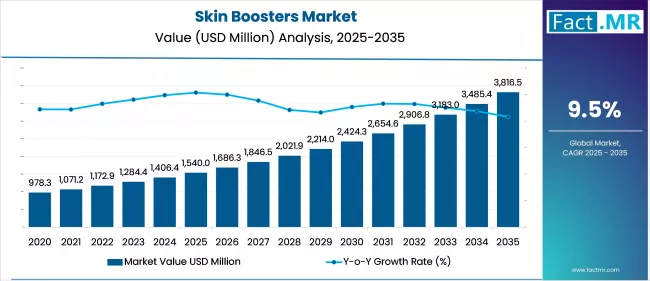
Skin Boosters Market
Skin Boosters Market Analysis, By Type (Mesotherapy, Micro-needle, and Others), By Gender, By Ingredient, By Delivery Method, By End Use, and Region - Market Insights 2025 to 2035
The Mesotherapy segment is projected to grow at a CAGR of 9.5%, whereas another segment Micro-needle is likely to grow at 8.9%. In terms of countries South Korea is projected to grow at 8.5%, followed by Italy at 10.7% and China to grow at 11.3%.
Skin Boosters Market Outlook (2025 to 2035)
The global skin boosters market is expected to reach USD 3,816 million by 2035, up from USD 1,406 million in 2024. During the forecast period (2025-2035), the industry is projected to register a CAGR of 9.5%.
The growing demand for minimally invasive treatments, increasing awareness of preventive skincare, and social media-driven beauty standards are driving the advancement of the skin boosters market. Moreover, clinical applications for acne scars, post-laser recovery, and innovations such as stabilized HA and needle-free delivery are driving market growth.
What are the drivers of skin boosters market?
One of the primary reasons the skin boosters market is growing is the increasing demand for minimally invasive and aesthetically pleasing treatments. Many individuals are making less conscious choices to address skin issues, and non-surgical options, such as hyaluronic acid-based injectables, which help combat aging, dryness, and dull skin, represent a timely solution as they naturally hydrate and revitalize the skin.
The increasing awareness of the younger population of the concepts of preventive skin remedies and early treatment procedures drives demand. Additionally, the beauty standards promoted by social media and influencers are encouraging men and women to undergo more advanced skin care procedures.
At a clinical level, dermatologists are using boosters in the treatment of acne scars and in post-laser skin healing, which has increased their clinical relevance. Advancing technologies such as stabilized HA formulations and needle-free delivery systems are improving accessibility and safety of the product and, therefore, boosting market expansion in both professional and home-based sectors.
What are the regional trends of skin boosters market?
Europe dominates the worldwide skin boosters industry, with nations such as France, Germany, and the UK demonstrating a high level of acceptance of aesthetic dermatology procedures. With the presence of established brands and developed medical aesthetic infrastructure, Europe is a hub of innovation and clinical implementation.
The Asia Pacific region is becoming a rapidly expanding area, with South Korea, Japan, and China gaining prominence. These nations already have increased cosmetic awareness, particularly among millennials and Generation Y, and are influenced by K-beauty trends that emphasize skin luminosity and hydration. Global brands and local players are expanding their portfolios to address such cultural preferences.
Constant growth is being observed in North America and more particularly in the U.S. and Canada. Minimally invasive procedures are widely practiced, supported by a sufficient number of certified aesthetic clinics that contribute to market advancement. In the meantime, new opportunities are opening up in Latin America and the Middle East, where the growing demand is being met by tourist-oriented markets such as Brazil and the UAE, respectively.
What are the challenges and restraining factors of skin boosters market?
The lack of uniformity in regulations by various countries is one of the significant challenges of the skin boosters market. Differences in product licensure, labeling, and use practices impose an obstacle to global companies aiming to expand or introduce a new formulation.
Cost is another limiting factor. Middle-income consumers may lack access to high-quality boosters due to the expense of procedures, particularly in North America and Western Europe. Many treatments also require follow-up within 6 to 9 months, making them a recurring expense that some may struggle to manage during economic downturns.
Some potential users may be discouraged by the possibility of adverse reactions, including skin irritation, swelling or the formation of cutaneous nodules, although such occurrences are uncommon. The inadequate supply of trained practitioners in emerging markets influences patient outcomes and the credibility of the market. Finally, growing concerns about aesthetic advertising and claims, particularly on social media sites, may restrict marketing flexibility, impacting brand visibility and consumer conversion.
Country-Wise Outlook
The Global Trendsetter South Korea in Aesthetic Dermatology
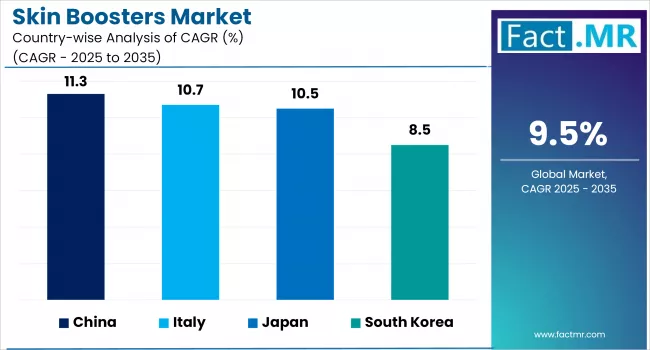
South Korea is a popular skin booster market as the country has an unrivaled culture of aestheticism and high demand for consumers towards minimally invasive procedures. The hyaluronic acid (HA)-based skin boosters, on which the country has a strong foundation in dermatology, coupled with a beauty-conscious populace, lead to a high level of acceptance of products that improve skin hydration, elasticity, and overall glow.
Increasing awareness about photo aging and skin stress due to pollution is the other factor that supports the market. Cross-linked HA injectable, microneedle delivery system, and PRP+HA combination therapy are among the common technological advances.
Korea has also access to the AI-enabled facial analysis tools and digital skincare diagnostics and can engage in hyper-personalized treatment plans. Innovation is promoted by ensuring that the provision of regulatory support by the Ministry of Food and Drug Safety (MFDS) which promote product development while maintaining safety standards in product approval.
Where Premium Wellness Meets Aesthetic Medicine Italy
The trend of combining aesthetics and luxury skincare, driven by the increasing interest of middle-aged consumers to be rejuvenated and have a collagen-enhancing treatment, the skin boosters market of Italy flourishes. Milan, Rome and Florence have aesthetic clinics and a wellness-oriented concept of medispas that offer intradermal injectable aimed at improving elasticity and radiance.
Polynucleotide based bio-revitalization, amino acid based injectable and HA with vitamins and antioxidants are some of the key growth drivers. Skin mapping tools based on AI, consultative platforms based around applications and laser or ultrasound based treatments are gaining traction. The Italian compliances with the EU MDR regulations boost patient reassurance and promote innovation among high-quality aesthetic products.
Digital Beauty and Urban Wellness Drive Growth in China
The market of skin boosters in China is growing rapidly due to the increasing disposable income, urbanization, and online-based beauty culture among millennials and Gen Z demographics. There is an upsurge in the demand of the preventative anti-aging therapy and quick result skin care solutions in Tier 1 and Tier 2 cities.
Treatments currently in demand include cross-linked HA, mesotherapy boosters targeting hydration and skin tone, and the use of peptide enriched formulations. Widespread availability of tele-dermatology platform solutions, skin health trackers and conferencing apps enhance consumer access. Healthy China 2030 and the reform of regulations by the National Medical Products Administration (NMPA) simplify the approval process of products and reinforce increased involvement in this expanding market.
Category-Wise Analysis
Mesotherapy emerges as the delivery method of choice in skin rejuvenation treatments
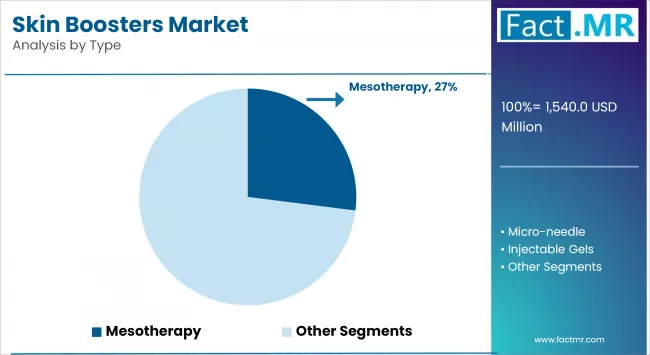
Mesotherapy is considered a key practice in aesthetic dermatology, utilizing a minimally invasive method to introduce active substances to the mesodermal layer of the skin. This process improves hydration, elasticity and luminosity, which is why it is often taken in prophylaxis and corrective care of the skin.
It is also versatile in its use, with applications ranging from anti-ageing to pigmentation correction, among others, which has enhanced its role in meeting the varied patient requirements. Enhancements to injection devices and the introduction of needle-free products have further improved patient comfort and contributed to the growing success of these products in outpatient and clinical spa settings.
MedSpas drive the aesthetic skin booster boom through personalized wellness experiences
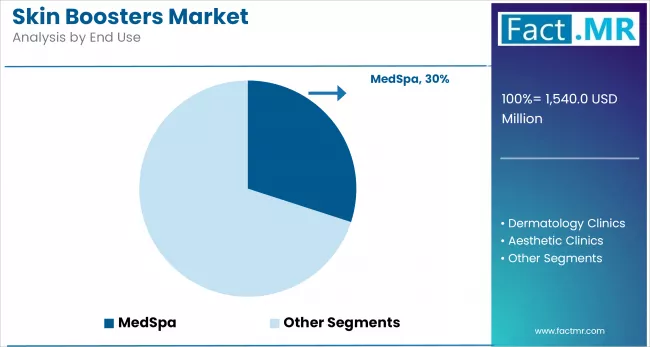
Medical spas (MedSpas) have emerged as an essential destination for the use of skin boosters, blending elements of spa and clinical environments. These facilities combine dermatology practices with traditional beauty salons and offer evidence-based, non-surgical treatments in a spa-like atmosphere.
Rejuvenation solutions, such as skin boosters that consist of injectable substances like hyaluronic acid, are often offered in combination, forming a higher-cost and high-value service package. In many regions, particularly in North America and Europe, regulatory requirements mandate the presence of certified practitioners, which has contributed to improved safety standards and increased consumer trust in these establishments.
Hyaluronic acid remains the gold standard ingredient for deep skin hydration and volume restoration
Hyaluronic acid (HA) remains a leading ingredient in the skin boosters market due to its biocompatibility and ability to bind water. Due to its natural composition, HA is a glycosaminoglycan that can carry up to 1,000 times its weight in water, making it suitable for reviving the hydration, firmness, and elasticity of the skin.
It is used both as a single-ingredient booster and within complex formulations that include peptides and vitamins. Ongoing research and development into cross-linked and non-cross-linked HA continue to support improvements in durability and effectiveness, while increasing demand in the Asia-Pacific and Latin America is contributing to a broader market reach.
Competitive Analysis
The skin boosters market is characterized by fragmented competition, where established aesthetic solution providers compete with newer entrants that focus more on wellness than aesthetics. A central area of competition is innovation, as companies aim to develop advanced formulations that improve hydration and skin elasticity while minimizing side effects. Investment in research and development is increasing, with a focus on creating longer-lasting results and reducing downtime, which continues to influence purchasing decisions.
Regional approaches, such as launching product variants and partnering with dermatology clinics and med-spas to enhance presence in the channel, are also being employed by market participants. The subsequent popularity of aesthetic procedures among younger customers has redirected attention to inexpensive and easy-to-perform actions, increasing competition across product categories.
Highly conventional fillers are being replaced in the market by bio-remodeling injectables and non-invasive skin treatment procedures. Regulatory compliance and safety transparency are turning into a key differentiating factor, especially in developed markets such as Europe and North America.
Key players in the skin boosters market include Merz Aesthetics, IBSA - Institute Biochemical SA (IBSA Derma), Allergan Plc, Bloomage Biotechnology, Filorga, Galderma, Teoxane, Professional Derma SA, and other notable players.
Recent Development
- In July 2025, Filorga unveiled its AGE-PURIFY range, targeting both wrinkles and skin imperfections. This anti-aging program promises visible results after seven days, catering to combination skin prone to imperfections, and includes four new skincare products designed to address multiple skin concerns simultaneously.
- In January 2025, Merz Aesthetics introduced Ultherapy PRIME® in the EMEA region at the IMCAS World Congress. This evolution of their non-invasive skin lifting technology offers personalized treatments with real-time imaging, enhancing the precision and effectiveness of skin rejuvenation procedures.
Fact.MR has provided detailed information about the price points of key manufacturers in the Skin Boosters Market, positioned across regions, including sales growth, production capacity, and speculative technological expansion, in its recently published report.
Methodology and Industry Tracking Approach
Fact.MR analyzed the skin boosters market in detail, computing the survey of 3,800 stakeholders in 18 countries in 2025. The survey, which ended in October 2020, involved the opinions of more than 80 experts in each of the regions; in this way, the views of dermatologists, the scientists of cosmetic formulation, and scientists of aesthetic devices were included. This paper set out to learn about the development of injectable skincare technologies based on treatment with hydration, collagen stimulation, and bio compatible delivery systems.
The significant trends in the period July 2024-June 2025 were the emergence of bio-remodeling injectables, the presence of AI-assisted skin diagnostics to tumor booster selection, and app-synchronized clinical treatment planning. Eco-friendly moves like biodegradable packaging, preservative-free recipes, and refilling applicator systems also picked up as well, especially in the likes of eco-friendly city spaces. Models that are subscription-based skin rejuvenation kits and clinic-integrated electronic at-home monitoring tools were understood as models of preference to the consumer.
Segmentation of Skin boosters market
-
By Type :
- Mesotherapy
- Micro-needle
- Injectable Gels
- Non-invasive Serums
- Bioremodeling Boosters
-
By End Use :
- MedSpa
- Dermatology Clinics
- Aesthetic Clinics
- Hospitals
- Wellness Centers
-
By Gender :
- Male
- Female
-
By Ingredient :
- Hyaluronic Acid
- Poly-L-lactic Acid
- PRP (Platelet Rich Plasma)
- Amino Acids & Vitamins
- Others
-
By Delivery Method :
- Micro-needle Injections
- Syringe-based Delivery
- Cannula Injections
- Topical Applications
- Others
-
By Region :
- North America
- Latin America
- Western Europe
- Eastern Europe
- East Asia
- South Asia & Pacific
- Middle East & Africa
Table of Content
- Executive Summary
- Global Market Outlook
- Demand-side Trends
- Supply-side Trends
- Technology Roadmap Analysis
- Analysis and Recommendations
- Market Overview
- Market Coverage / Taxonomy
- Market Definition / Scope / Limitations
- Market Background
- Market Dynamics
- Drivers
- Restraints
- Opportunity
- Trends
- Scenario Forecast
- Demand in Optimistic Scenario
- Demand in Likely Scenario
- Demand in Conservative Scenario
- Opportunity Map Analysis
- Product Life Cycle Analysis
- Supply Chain Analysis
- Supply Side Participants and their Roles
- Producers
- Mid-Level Participants (Traders/ Agents/ Brokers)
- Wholesalers and Distributors
- Value Added and Value Created at Node in the Supply Chain
- List of Component Suppliers
- List of Existing and Potential Buyers
- Supply Side Participants and their Roles
- Investment Feasibility Matrix
- Value Chain Analysis
- Profit Margin Analysis
- Wholesalers and Distributors
- Retailers
- PESTLE and Porter’s Analysis
- Regulatory Landscape
- By Key Regions
- By Key Countries
- Production and Consumption Statistics
- Import and Export Statistics
- Market Dynamics
- Global Market Analysis 2020 to 2024 and Forecast, 2025 to 2035
- Historical Market Size Value (USD Mn) & Volume (Units) Analysis, 2020 to 2024
- Current and Future Market Size Value (USD Mn) & Volume (Units) Projections, 2025 to 2035
- Y-o-Y Growth Trend Analysis
- Absolute $ Opportunity Analysis
- Global Market Pricing Analysis 2020 to 2024 and Forecast 2025 to 2035
- Global Market Analysis 2020 to 2024 and Forecast 2025 to 2035, By Type
- Introduction / Key Findings
- Historical Market Size Value (USD Mn) & Volume (Units) Analysis By Type, 2020 to 2024
- Current and Future Market Size Value (USD Mn) & Volume (Units) Analysis and Forecast By Type, 2025 to 2035
- Mesotherapy
- Micro-needle
- Injectable Gels
- Non-invasive Serums
- Bioremodeling Boosters
- Y-o-Y Growth Trend Analysis By Type, 2020 to 2024
- Absolute $ Opportunity Analysis By Type, 2025 to 2035
- Global Market Analysis 2020 to 2024 and Forecast 2025 to 2035, By End Use
- Introduction / Key Findings
- Historical Market Size Value (USD Mn) & Volume (Units) Analysis By End Use, 2020 to 2024
- Current and Future Market Size Value (USD Mn) & Volume (Units) Analysis and Forecast By End Use, 2025 to 2035
- MedSpa
- Dermatology Clinics
- Aesthetic Clinics
- Hospitals
- Wellness Centers
- Y-o-Y Growth Trend Analysis By End Use, 2020 to 2024
- Absolute $ Opportunity Analysis By End Use, 2025 to 2035
- Global Market Analysis 2020 to 2024 and Forecast 2025 to 2035, By Gender
- Introduction / Key Findings
- Historical Market Size Value (USD Mn) & Volume (Units) Analysis By Gender, 2020 to 2024
- Current and Future Market Size Value (USD Mn) & Volume (Units) Analysis and Forecast By Gender, 2025 to 2035
- Male
- Female
- Y-o-Y Growth Trend Analysis By Gender, 2020 to 2024
- Absolute $ Opportunity Analysis By Gender, 2025 to 2035
- Global Market Analysis 2020 to 2024 and Forecast 2025 to 2035, By Ingredient
- Introduction / Key Findings
- Historical Market Size Value (USD Mn) & Volume (Units) Analysis By Ingredient, 2020 to 2024
- Current and Future Market Size Value (USD Mn) & Volume (Units) Analysis and Forecast By Ingredient, 2025 to 2035
- Hyaluronic Acid
- Poly-L-lactic Acid
- PRP (Platelet Rich Plasma)
- Amino Acids & Vitamins
- Others
- Y-o-Y Growth Trend Analysis By Ingredient, 2020 to 2024
- Absolute $ Opportunity Analysis By Ingredient, 2025 to 2035
- Global Market Analysis 2020 to 2024 and Forecast 2025 to 2035, By Delivery Method
- Introduction / Key Findings
- Historical Market Size Value (USD Mn) & Volume (Units) Analysis By Delivery Method, 2020 to 2024
- Current and Future Market Size Value (USD Mn) & Volume (Units) Analysis and Forecast By Delivery Method, 2025 to 2035
- Micro-needle Injections
- Syringe-based Delivery
- Cannula Injections
- Topical Applications
- Others
- Y-o-Y Growth Trend Analysis By Delivery Method, 2020 to 2024
- Absolute $ Opportunity Analysis By Delivery Method, 2025 to 2035
- Global Market Analysis 2020 to 2024 and Forecast 2025 to 2035, By Region
- Introduction
- Historical Market Size Value (USD Mn) & Volume (Units) Analysis By Region, 2020 to 2024
- Current Market Size Value (USD Mn) & Volume (Units) Analysis and Forecast By Region, 2025 to 2035
- North America
- Latin America
- Western Europe
- East Asia
- South Asia Pacific
- Eastern Europe
- Middle East & Africa
- Market Attractiveness Analysis By Region
- North America Market Analysis 2020 to 2024 and Forecast 2025 to 2035, By Country
- Historical Market Size Value (USD Mn) & Volume (Units) Trend Analysis By Market Taxonomy, 2020 to 2024
- Market Size Value (USD Mn) & Volume (Units) Forecast By Market Taxonomy, 2025 to 2035
- By Country
- U.S.
- Canada
- Mexico
- By Type
- By End Use
- By Gender
- By Ingredient
- By Delivery Method
- By Country
- Market Attractiveness Analysis
- By Country
- By Type
- By End Use
- By Gender
- By Ingredient
- By Delivery Method
- Key Takeaways
- Latin America Market Analysis 2020 to 2024 and Forecast 2025 to 2035, By Country
- Historical Market Size Value (USD Mn) & Volume (Units) Trend Analysis By Market Taxonomy, 2020 to 2024
- Market Size Value (USD Mn) & Volume (Units) Forecast By Market Taxonomy, 2025 to 2035
- By Country
- Brazil
- Chile
- Rest of Latin America
- By Type
- By End Use
- By Gender
- By Ingredient
- By Delivery Method
- By Country
- Market Attractiveness Analysis
- By Country
- By Type
- By End Use
- By Gender
- By Ingredient
- By Delivery Method
- Key Takeaways
- Western Europe Market Analysis 2020 to 2024 and Forecast 2025 to 2035, By Country
- Historical Market Size Value (USD Mn) & Volume (Units) Trend Analysis By Market Taxonomy, 2020 to 2024
- Market Size Value (USD Mn) & Volume (Units) Forecast By Market Taxonomy, 2025 to 2035
- By Country
- Germany
- Italy
- France
- U.K.
- Spain
- Russia
- BENELUX
- Rest of Europe
- By Type
- By End Use
- By Gender
- By Ingredient
- By Delivery Method
- By Country
- Market Attractiveness Analysis
- By Country
- By Type
- By End Use
- By Gender
- By Ingredient
- By Delivery Method
- Key Takeaways
- East Asia Market Analysis 2020 to 2024 and Forecast 2025 to 2035, By Country
- Historical Market Size Value (USD Mn) & Volume (Units) Trend Analysis By Market Taxonomy, 2020 to 2024
- Market Size Value (USD Mn) & Volume (Units) Forecast By Market Taxonomy, 2025 to 2035
- By Country
- China
- Japan
- South Korea
- By Type
- By End Use
- By Gender
- By Ingredient
- By Delivery Method
- By Country
- Market Attractiveness Analysis
- By Country
- By Type
- By End Use
- By Gender
- By Ingredient
- By Delivery Method
- Key Takeaways
- South Asia Pacific Market Analysis 2020 to 2024 and Forecast 2025 to 2035, By Country
- Historical Market Size Value (USD Mn) & Volume (Units) Trend Analysis By Market Taxonomy, 2020 to 2024
- Market Size Value (USD Mn) & Volume (Units) Forecast By Market Taxonomy, 2025 to 2035
- By Country
- India
- ASEAN Countries
- Australia & New Zealand
- Rest of South Asia Pacific
- By Type
- By End Use
- By Gender
- By Ingredient
- By Delivery Method
- By Country
- Market Attractiveness Analysis
- By Country
- By Type
- By End Use
- By Gender
- By Ingredient
- By Delivery Method
- Key Takeaways
- Eastern Europe Market Analysis 2020 to 2024 and Forecast 2025 to 2035, By Country
- Historical Market Size Value (USD Mn) & Volume (Units) Trend Analysis By Market Taxonomy, 2020 to 2024
- Market Size Value (USD Mn) & Volume (Units) Forecast By Market Taxonomy, 2025 to 2035
- By Country
- Russia
- Poland
- Hungary
- Balkan & Baltics
- Rest of Eastern Europe
- By Type
- By End Use
- By Gender
- By Ingredient
- By Delivery Method
- By Country
- Market Attractiveness Analysis
- By Country
- By Type
- By End Use
- By Gender
- By Ingredient
- By Delivery Method
- Key Takeaways
- Middle East & Africa Market Analysis 2020 to 2024 and Forecast 2025 to 2035, By Country
- Historical Market Size Value (USD Mn) & Volume (Units) Trend Analysis By Market Taxonomy, 2020 to 2024
- Market Size Value (USD Mn) & Volume (Units) Forecast By Market Taxonomy, 2025 to 2035
- By Country
- KSA
- Other GCC Countries
- Turkiye
- South Africa
- Rest of MEA
- By Type
- By End Use
- By Gender
- By Ingredient
- By Delivery Method
- By Country
- Market Attractiveness Analysis
- By Country
- By Type
- By End Use
- By Gender
- By Ingredient
- By Delivery Method
- Key Takeaways
- Key Countries Market Analysis
- South Jorea
- Pricing Analysis
- Market Share Analysis, 2024
- By Type
- By End Use
- By Gender
- By Ingredient
- By Delivery Method
- Italy
- Pricing Analysis
- Market Share Analysis, 2024
- By Type
- By End Use
- By Gender
- By Ingredient
- By Delivery Method
- China
- Pricing Analysis
- Market Share Analysis, 2024
- By Type
- By End Use
- By Gender
- By Ingredient
- By Delivery Method
- Russia
- Pricing Analysis
- Market Share Analysis, 2024
- By Type
- By End Use
- By Gender
- By Ingredient
- By Delivery Method
- Germany
- Pricing Analysis
- Market Share Analysis, 2024
- By Type
- By End Use
- By Gender
- By Ingredient
- By Delivery Method
- South Jorea
- Market Structure Analysis
- Competition Dashboard
- Competition Benchmarking
- Market Share Analysis of Top Players
- By Regional
- By Type
- By End Use
- By Gender
- By Ingredient
- By Delivery Method
- Competition Analysis
- Competition Deep Dive
- Merz Aesthetics
- Overview
- Product Portfolio
- Profitability by Market Segments (Product/Age /Sales Channel/Region)
- Sales Footprint
- Strategy Overview
- Marketing Strategy
- Product Strategy
- Channel Strategy
- IBSA - Institute Biochemical SA (IBSA Derma)
- Overview
- Product Portfolio
- Profitability by Market Segments (Product/Age /Sales Channel/Region)
- Sales Footprint
- Strategy Overview
- Marketing Strategy
- Product Strategy
- Channel Strategy
- Allergan Plc
- Overview
- Product Portfolio
- Profitability by Market Segments (Product/Age /Sales Channel/Region)
- Sales Footprint
- Strategy Overview
- Marketing Strategy
- Product Strategy
- Channel Strategy
- Bloomage Biotechnology
- Overview
- Product Portfolio
- Profitability by Market Segments (Product/Age /Sales Channel/Region)
- Sales Footprint
- Strategy Overview
- Marketing Strategy
- Product Strategy
- Channel Strategy
- Filorga
- Overview
- Product Portfolio
- Profitability by Market Segments (Product/Age /Sales Channel/Region)
- Sales Footprint
- Strategy Overview
- Marketing Strategy
- Product Strategy
- Channel Strategy
- Galderma
- Overview
- Product Portfolio
- Profitability by Market Segments (Product/Age /Sales Channel/Region)
- Sales Footprint
- Strategy Overview
- Marketing Strategy
- Product Strategy
- Channel Strategy
- Teoxanne
- Overview
- Product Portfolio
- Profitability by Market Segments (Product/Age /Sales Channel/Region)
- Sales Footprint
- Strategy Overview
- Marketing Strategy
- Product Strategy
- Channel Strategy
- Professional Derma SA
- Overview
- Product Portfolio
- Profitability by Market Segments (Product/Age /Sales Channel/Region)
- Sales Footprint
- Strategy Overview
- Marketing Strategy
- Product Strategy
- Channel Strategy
- Merz Aesthetics
- Competition Deep Dive
- Assumptions & Acronyms Used
- Research Methodology
List Of Table
- Table 1: Global Market Value (USD Mn) Forecast by Region, 2020 to 2035
- Table 2: Global Market Volume (Units) Forecast by Region, 2020 to 2035
- Table 3: Global Market Value (USD Mn) Forecast by Type, 2020 to 2035
- Table 4: Global Market Volume (Units) Forecast by Type, 2020 to 2035
- Table 5: Global Market Value (USD Mn) Forecast by End Use, 2020 to 2035
- Table 6: Global Market Volume (Units) Forecast by End Use, 2020 to 2035
- Table 7: Global Market Value (USD Mn) Forecast by Gender, 2020 to 2035
- Table 8: Global Market Volume (Units) Forecast by Gender, 2020 to 2035
- Table 9: Global Market Value (USD Mn) Forecast by Ingredient, 2020 to 2035
- Table 10: Global Market Volume (Units) Forecast by Ingredient, 2020 to 2035
- Table 11: Global Market Value (USD Mn) Forecast by Delivery Method, 2020 to 2035
- Table 12: Global Market Volume (Units) Forecast by Delivery Method, 2020 to 2035
- Table 13: North America Market Value (USD Mn) Forecast by Country, 2020 to 2035
- Table 14: North America Market Volume (Units) Forecast by Country, 2020 to 2035
- Table 15: North America Market Value (USD Mn) Forecast by Type, 2020 to 2035
- Table 16: North America Market Volume (Units) Forecast by Type, 2020 to 2035
- Table 17: North America Market Value (USD Mn) Forecast by End Use, 2020 to 2035
- Table 18: North America Market Volume (Units) Forecast by End Use, 2020 to 2035
- Table 19: North America Market Value (USD Mn) Forecast by Gender, 2020 to 2035
- Table 20: North America Market Volume (Units) Forecast by Gender, 2020 to 2035
- Table 21: North America Market Value (USD Mn) Forecast by Ingredient, 2020 to 2035
- Table 22: North America Market Volume (Units) Forecast by Ingredient, 2020 to 2035
- Table 23: North America Market Value (USD Mn) Forecast by Delivery Method, 2020 to 2035
- Table 24: North America Market Volume (Units) Forecast by Delivery Method, 2020 to 2035
- Table 25: Latin America Market Value (USD Mn) Forecast by Country, 2020 to 2035
- Table 26: Latin America Market Volume (Units) Forecast by Country, 2020 to 2035
- Table 27: Latin America Market Value (USD Mn) Forecast by Type, 2020 to 2035
- Table 28: Latin America Market Volume (Units) Forecast by Type, 2020 to 2035
- Table 29: Latin America Market Value (USD Mn) Forecast by End Use, 2020 to 2035
- Table 30: Latin America Market Volume (Units) Forecast by End Use, 2020 to 2035
- Table 31: Latin America Market Value (USD Mn) Forecast by Gender, 2020 to 2035
- Table 32: Latin America Market Volume (Units) Forecast by Gender, 2020 to 2035
- Table 33: Latin America Market Value (USD Mn) Forecast by Ingredient, 2020 to 2035
- Table 34: Latin America Market Volume (Units) Forecast by Ingredient, 2020 to 2035
- Table 35: Latin America Market Value (USD Mn) Forecast by Delivery Method, 2020 to 2035
- Table 36: Latin America Market Volume (Units) Forecast by Delivery Method, 2020 to 2035
- Table 37: Western Europe Market Value (USD Mn) Forecast by Country, 2020 to 2035
- Table 38: Western Europe Market Volume (Units) Forecast by Country, 2020 to 2035
- Table 39: Western Europe Market Value (USD Mn) Forecast by Type, 2020 to 2035
- Table 40: Western Europe Market Volume (Units) Forecast by Type, 2020 to 2035
- Table 41: Western Europe Market Value (USD Mn) Forecast by End Use, 2020 to 2035
- Table 42: Western Europe Market Volume (Units) Forecast by End Use, 2020 to 2035
- Table 43: Western Europe Market Value (USD Mn) Forecast by Gender, 2020 to 2035
- Table 44: Western Europe Market Volume (Units) Forecast by Gender, 2020 to 2035
- Table 45: Western Europe Market Value (USD Mn) Forecast by Ingredient, 2020 to 2035
- Table 46: Western Europe Market Volume (Units) Forecast by Ingredient, 2020 to 2035
- Table 47: Western Europe Market Value (USD Mn) Forecast by Delivery Method, 2020 to 2035
- Table 48: Western Europe Market Volume (Units) Forecast by Delivery Method, 2020 to 2035
- Table 49: East Asia Market Value (USD Mn) Forecast by Country, 2020 to 2035
- Table 50: East Asia Market Volume (Units) Forecast by Country, 2020 to 2035
- Table 51: East Asia Market Value (USD Mn) Forecast by Type, 2020 to 2035
- Table 52: East Asia Market Volume (Units) Forecast by Type, 2020 to 2035
- Table 53: East Asia Market Value (USD Mn) Forecast by End Use, 2020 to 2035
- Table 54: East Asia Market Volume (Units) Forecast by End Use, 2020 to 2035
- Table 55: East Asia Market Value (USD Mn) Forecast by Gender, 2020 to 2035
- Table 56: East Asia Market Volume (Units) Forecast by Gender, 2020 to 2035
- Table 57: East Asia Market Value (USD Mn) Forecast by Ingredient, 2020 to 2035
- Table 58: East Asia Market Volume (Units) Forecast by Ingredient, 2020 to 2035
- Table 59: East Asia Market Value (USD Mn) Forecast by Delivery Method, 2020 to 2035
- Table 60: East Asia Market Volume (Units) Forecast by Delivery Method, 2020 to 2035
- Table 61: South Asia Pacific Market Value (USD Mn) Forecast by Country, 2020 to 2035
- Table 62: South Asia Pacific Market Volume (Units) Forecast by Country, 2020 to 2035
- Table 63: South Asia Pacific Market Value (USD Mn) Forecast by Type, 2020 to 2035
- Table 64: South Asia Pacific Market Volume (Units) Forecast by Type, 2020 to 2035
- Table 65: South Asia Pacific Market Value (USD Mn) Forecast by End Use, 2020 to 2035
- Table 66: South Asia Pacific Market Volume (Units) Forecast by End Use, 2020 to 2035
- Table 67: South Asia Pacific Market Value (USD Mn) Forecast by Gender, 2020 to 2035
- Table 68: South Asia Pacific Market Volume (Units) Forecast by Gender, 2020 to 2035
- Table 69: South Asia Pacific Market Value (USD Mn) Forecast by Ingredient, 2020 to 2035
- Table 70: South Asia Pacific Market Volume (Units) Forecast by Ingredient, 2020 to 2035
- Table 71: South Asia Pacific Market Value (USD Mn) Forecast by Delivery Method, 2020 to 2035
- Table 72: South Asia Pacific Market Volume (Units) Forecast by Delivery Method, 2020 to 2035
- Table 73: Eastern Europe Market Value (USD Mn) Forecast by Country, 2020 to 2035
- Table 74: Eastern Europe Market Volume (Units) Forecast by Country, 2020 to 2035
- Table 75: Eastern Europe Market Value (USD Mn) Forecast by Type, 2020 to 2035
- Table 76: Eastern Europe Market Volume (Units) Forecast by Type, 2020 to 2035
- Table 77: Eastern Europe Market Value (USD Mn) Forecast by End Use, 2020 to 2035
- Table 78: Eastern Europe Market Volume (Units) Forecast by End Use, 2020 to 2035
- Table 79: Eastern Europe Market Value (USD Mn) Forecast by Gender, 2020 to 2035
- Table 80: Eastern Europe Market Volume (Units) Forecast by Gender, 2020 to 2035
- Table 81: Eastern Europe Market Value (USD Mn) Forecast by Ingredient, 2020 to 2035
- Table 82: Eastern Europe Market Volume (Units) Forecast by Ingredient, 2020 to 2035
- Table 83: Eastern Europe Market Value (USD Mn) Forecast by Delivery Method, 2020 to 2035
- Table 84: Eastern Europe Market Volume (Units) Forecast by Delivery Method, 2020 to 2035
- Table 85: Middle East & Africa Market Value (USD Mn) Forecast by Country, 2020 to 2035
- Table 86: Middle East & Africa Market Volume (Units) Forecast by Country, 2020 to 2035
- Table 87: Middle East & Africa Market Value (USD Mn) Forecast by Type, 2020 to 2035
- Table 88: Middle East & Africa Market Volume (Units) Forecast by Type, 2020 to 2035
- Table 89: Middle East & Africa Market Value (USD Mn) Forecast by End Use, 2020 to 2035
- Table 90: Middle East & Africa Market Volume (Units) Forecast by End Use, 2020 to 2035
- Table 91: Middle East & Africa Market Value (USD Mn) Forecast by Gender, 2020 to 2035
- Table 92: Middle East & Africa Market Volume (Units) Forecast by Gender, 2020 to 2035
- Table 93: Middle East & Africa Market Value (USD Mn) Forecast by Ingredient, 2020 to 2035
- Table 94: Middle East & Africa Market Volume (Units) Forecast by Ingredient, 2020 to 2035
- Table 95: Middle East & Africa Market Value (USD Mn) Forecast by Delivery Method, 2020 to 2035
- Table 96: Middle East & Africa Market Volume (Units) Forecast by Delivery Method, 2020 to 2035
List Of Figures
- Figure 1: Global Market Volume (Units) Forecast 2020 to 2035
- Figure 2: Global Market Pricing Analysis
- Figure 3: Global Market Value (USD Mn) Forecast 2020 to 2035
- Figure 4: Global Market Value Share and BPS Analysis by Type, 2025 and 2035
- Figure 5: Global Market Y-o-Y Growth Comparison by Type, 2025 to 2035
- Figure 6: Global Market Attractiveness Analysis by Type
- Figure 7: Global Market Value Share and BPS Analysis by End Use, 2025 and 2035
- Figure 8: Global Market Y-o-Y Growth Comparison by End Use, 2025 to 2035
- Figure 9: Global Market Attractiveness Analysis by End Use
- Figure 10: Global Market Value Share and BPS Analysis by Gender, 2025 and 2035
- Figure 11: Global Market Y-o-Y Growth Comparison by Gender, 2025 to 2035
- Figure 12: Global Market Attractiveness Analysis by Gender
- Figure 13: Global Market Value Share and BPS Analysis by Ingredient, 2025 and 2035
- Figure 14: Global Market Y-o-Y Growth Comparison by Ingredient, 2025 to 2035
- Figure 15: Global Market Attractiveness Analysis by Ingredient
- Figure 16: Global Market Value Share and BPS Analysis by Delivery Method, 2025 and 2035
- Figure 17: Global Market Y-o-Y Growth Comparison by Delivery Method, 2025 to 2035
- Figure 18: Global Market Attractiveness Analysis by Delivery Method
- Figure 19: Global Market Value (USD Mn) Share and BPS Analysis by Region, 2025 and 2035
- Figure 20: Global Market Y-o-Y Growth Comparison by Region, 2025 to 2035
- Figure 21: Global Market Attractiveness Analysis by Region
- Figure 22: North America Market Incremental $ Opportunity, 2025 to 2035
- Figure 23: Latin America Market Incremental $ Opportunity, 2025 to 2035
- Figure 24: Western Europe Market Incremental $ Opportunity, 2025 to 2035
- Figure 25: East Asia Market Incremental $ Opportunity, 2025 to 2035
- Figure 26: South Asia Pacific Market Incremental $ Opportunity, 2025 to 2035
- Figure 27: Eastern Europe Market Incremental $ Opportunity, 2025 to 2035
- Figure 28: Middle East & Africa Market Incremental $ Opportunity, 2025 to 2035
- Figure 29: North America Market Value Share and BPS Analysis by Country, 2025 and 2035
- Figure 30: North America Market Value Share and BPS Analysis by Type, 2025 and 2035
- Figure 31: North America Market Y-o-Y Growth Comparison by Type, 2025 to 2035
- Figure 32: North America Market Attractiveness Analysis by Type
- Figure 33: North America Market Value Share and BPS Analysis by End Use, 2025 and 2035
- Figure 34: North America Market Y-o-Y Growth Comparison by End Use, 2025 to 2035
- Figure 35: North America Market Attractiveness Analysis by End Use
- Figure 36: North America Market Value Share and BPS Analysis by Gender, 2025 and 2035
- Figure 37: North America Market Y-o-Y Growth Comparison by Gender, 2025 to 2035
- Figure 38: North America Market Attractiveness Analysis by Gender
- Figure 39: North America Market Value Share and BPS Analysis by Ingredient, 2025 and 2035
- Figure 40: North America Market Y-o-Y Growth Comparison by Ingredient, 2025 to 2035
- Figure 41: North America Market Attractiveness Analysis by Ingredient
- Figure 42: North America Market Value Share and BPS Analysis by Delivery Method, 2025 and 2035
- Figure 43: North America Market Y-o-Y Growth Comparison by Delivery Method, 2025 to 2035
- Figure 44: North America Market Attractiveness Analysis by Delivery Method
- Figure 45: Latin America Market Value Share and BPS Analysis by Country, 2025 and 2035
- Figure 46: Latin America Market Value Share and BPS Analysis by Type, 2025 and 2035
- Figure 47: Latin America Market Y-o-Y Growth Comparison by Type, 2025 to 2035
- Figure 48: Latin America Market Attractiveness Analysis by Type
- Figure 49: Latin America Market Value Share and BPS Analysis by End Use, 2025 and 2035
- Figure 50: Latin America Market Y-o-Y Growth Comparison by End Use, 2025 to 2035
- Figure 51: Latin America Market Attractiveness Analysis by End Use
- Figure 52: Latin America Market Value Share and BPS Analysis by Gender, 2025 and 2035
- Figure 53: Latin America Market Y-o-Y Growth Comparison by Gender, 2025 to 2035
- Figure 54: Latin America Market Attractiveness Analysis by Gender
- Figure 55: Latin America Market Value Share and BPS Analysis by Ingredient, 2025 and 2035
- Figure 56: Latin America Market Y-o-Y Growth Comparison by Ingredient, 2025 to 2035
- Figure 57: Latin America Market Attractiveness Analysis by Ingredient
- Figure 58: Latin America Market Value Share and BPS Analysis by Delivery Method, 2025 and 2035
- Figure 59: Latin America Market Y-o-Y Growth Comparison by Delivery Method, 2025 to 2035
- Figure 60: Latin America Market Attractiveness Analysis by Delivery Method
- Figure 61: Western Europe Market Value Share and BPS Analysis by Country, 2025 and 2035
- Figure 62: Western Europe Market Value Share and BPS Analysis by Type, 2025 and 2035
- Figure 63: Western Europe Market Y-o-Y Growth Comparison by Type, 2025 to 2035
- Figure 64: Western Europe Market Attractiveness Analysis by Type
- Figure 65: Western Europe Market Value Share and BPS Analysis by End Use, 2025 and 2035
- Figure 66: Western Europe Market Y-o-Y Growth Comparison by End Use, 2025 to 2035
- Figure 67: Western Europe Market Attractiveness Analysis by End Use
- Figure 68: Western Europe Market Value Share and BPS Analysis by Gender, 2025 and 2035
- Figure 69: Western Europe Market Y-o-Y Growth Comparison by Gender, 2025 to 2035
- Figure 70: Western Europe Market Attractiveness Analysis by Gender
- Figure 71: Western Europe Market Value Share and BPS Analysis by Ingredient, 2025 and 2035
- Figure 72: Western Europe Market Y-o-Y Growth Comparison by Ingredient, 2025 to 2035
- Figure 73: Western Europe Market Attractiveness Analysis by Ingredient
- Figure 74: Western Europe Market Value Share and BPS Analysis by Delivery Method, 2025 and 2035
- Figure 75: Western Europe Market Y-o-Y Growth Comparison by Delivery Method, 2025 to 2035
- Figure 76: Western Europe Market Attractiveness Analysis by Delivery Method
- Figure 77: East Asia Market Value Share and BPS Analysis by Country, 2025 and 2035
- Figure 78: East Asia Market Value Share and BPS Analysis by Type, 2025 and 2035
- Figure 79: East Asia Market Y-o-Y Growth Comparison by Type, 2025 to 2035
- Figure 80: East Asia Market Attractiveness Analysis by Type
- Figure 81: East Asia Market Value Share and BPS Analysis by End Use, 2025 and 2035
- Figure 82: East Asia Market Y-o-Y Growth Comparison by End Use, 2025 to 2035
- Figure 83: East Asia Market Attractiveness Analysis by End Use
- Figure 84: East Asia Market Value Share and BPS Analysis by Gender, 2025 and 2035
- Figure 85: East Asia Market Y-o-Y Growth Comparison by Gender, 2025 to 2035
- Figure 86: East Asia Market Attractiveness Analysis by Gender
- Figure 87: East Asia Market Value Share and BPS Analysis by Ingredient, 2025 and 2035
- Figure 88: East Asia Market Y-o-Y Growth Comparison by Ingredient, 2025 to 2035
- Figure 89: East Asia Market Attractiveness Analysis by Ingredient
- Figure 90: East Asia Market Value Share and BPS Analysis by Delivery Method, 2025 and 2035
- Figure 91: East Asia Market Y-o-Y Growth Comparison by Delivery Method, 2025 to 2035
- Figure 92: East Asia Market Attractiveness Analysis by Delivery Method
- Figure 93: South Asia Pacific Market Value Share and BPS Analysis by Country, 2025 and 2035
- Figure 94: South Asia Pacific Market Value Share and BPS Analysis by Type, 2025 and 2035
- Figure 95: South Asia Pacific Market Y-o-Y Growth Comparison by Type, 2025 to 2035
- Figure 96: South Asia Pacific Market Attractiveness Analysis by Type
- Figure 97: South Asia Pacific Market Value Share and BPS Analysis by End Use, 2025 and 2035
- Figure 98: South Asia Pacific Market Y-o-Y Growth Comparison by End Use, 2025 to 2035
- Figure 99: South Asia Pacific Market Attractiveness Analysis by End Use
- Figure 100: South Asia Pacific Market Value Share and BPS Analysis by Gender, 2025 and 2035
- Figure 101: South Asia Pacific Market Y-o-Y Growth Comparison by Gender, 2025 to 2035
- Figure 102: South Asia Pacific Market Attractiveness Analysis by Gender
- Figure 103: South Asia Pacific Market Value Share and BPS Analysis by Ingredient, 2025 and 2035
- Figure 104: South Asia Pacific Market Y-o-Y Growth Comparison by Ingredient, 2025 to 2035
- Figure 105: South Asia Pacific Market Attractiveness Analysis by Ingredient
- Figure 106: South Asia Pacific Market Value Share and BPS Analysis by Delivery Method, 2025 and 2035
- Figure 107: South Asia Pacific Market Y-o-Y Growth Comparison by Delivery Method, 2025 to 2035
- Figure 108: South Asia Pacific Market Attractiveness Analysis by Delivery Method
- Figure 109: Eastern Europe Market Value Share and BPS Analysis by Country, 2025 and 2035
- Figure 110: Eastern Europe Market Value Share and BPS Analysis by Type, 2025 and 2035
- Figure 111: Eastern Europe Market Y-o-Y Growth Comparison by Type, 2025 to 2035
- Figure 112: Eastern Europe Market Attractiveness Analysis by Type
- Figure 113: Eastern Europe Market Value Share and BPS Analysis by End Use, 2025 and 2035
- Figure 114: Eastern Europe Market Y-o-Y Growth Comparison by End Use, 2025 to 2035
- Figure 115: Eastern Europe Market Attractiveness Analysis by End Use
- Figure 116: Eastern Europe Market Value Share and BPS Analysis by Gender, 2025 and 2035
- Figure 117: Eastern Europe Market Y-o-Y Growth Comparison by Gender, 2025 to 2035
- Figure 118: Eastern Europe Market Attractiveness Analysis by Gender
- Figure 119: Eastern Europe Market Value Share and BPS Analysis by Ingredient, 2025 and 2035
- Figure 120: Eastern Europe Market Y-o-Y Growth Comparison by Ingredient, 2025 to 2035
- Figure 121: Eastern Europe Market Attractiveness Analysis by Ingredient
- Figure 122: Eastern Europe Market Value Share and BPS Analysis by Delivery Method, 2025 and 2035
- Figure 123: Eastern Europe Market Y-o-Y Growth Comparison by Delivery Method, 2025 to 2035
- Figure 124: Eastern Europe Market Attractiveness Analysis by Delivery Method
- Figure 125: Middle East & Africa Market Value Share and BPS Analysis by Country, 2025 and 2035
- Figure 126: Middle East & Africa Market Value Share and BPS Analysis by Type, 2025 and 2035
- Figure 127: Middle East & Africa Market Y-o-Y Growth Comparison by Type, 2025 to 2035
- Figure 128: Middle East & Africa Market Attractiveness Analysis by Type
- Figure 129: Middle East & Africa Market Value Share and BPS Analysis by End Use, 2025 and 2035
- Figure 130: Middle East & Africa Market Y-o-Y Growth Comparison by End Use, 2025 to 2035
- Figure 131: Middle East & Africa Market Attractiveness Analysis by End Use
- Figure 132: Middle East & Africa Market Value Share and BPS Analysis by Gender, 2025 and 2035
- Figure 133: Middle East & Africa Market Y-o-Y Growth Comparison by Gender, 2025 to 2035
- Figure 134: Middle East & Africa Market Attractiveness Analysis by Gender
- Figure 135: Middle East & Africa Market Value Share and BPS Analysis by Ingredient, 2025 and 2035
- Figure 136: Middle East & Africa Market Y-o-Y Growth Comparison by Ingredient, 2025 to 2035
- Figure 137: Middle East & Africa Market Attractiveness Analysis by Ingredient
- Figure 138: Middle East & Africa Market Value Share and BPS Analysis by Delivery Method, 2025 and 2035
- Figure 139: Middle East & Africa Market Y-o-Y Growth Comparison by Delivery Method, 2025 to 2035
- Figure 140: Middle East & Africa Market Attractiveness Analysis by Delivery Method
- Figure 141: Global Market – Tier Structure Analysis
- Figure 142: Global Market – Company Share Analysis
- FAQs -
What was the global Skin boosters market size reported by Fact.MR for 2025?
The global skin boosters market was valued at USD 1,540 Million in 2025.
Who are the major players operating in the skin boosters market?
Prominent players in the market are Merz Aesthetics, IBSA - Institute Biochemical SA (IBSA Derma), Allergan Plc, Bloomage Biotechnology, among others.
What is the Estimated Valuation of the skin boosters market in 2035?
The market is expected to reach a valuation of USD 3,816 Million in 2035.
What value CAGR did the Skin boosters market exhibit over the last five years?
The historic growth rate of the skin boosters market was 7.9% from 2020 to 2024.