Global Talc Filler Masterbatch Market
Global Talc Filler Masterbatch Market Analysis, By Polymer Type (Polypropylene (PP), Polyethylene (PE), and Others), By Form, By Talc Particle Size, By End-Use Industry and Region - Market Insights 2025 to 2035
Polypropylene (PP) segment is projected to grow at a CAGR of 8.2%, whereas another segment Polyethylene (PE) is likely to grow at 8%. In terms of countries China is projected to grow at 8.6%, followed by India at 9.1% and Italy to grow at 6.8%
Talc Filler Masterbatch Market Outlook (2025 to 2035)
The global talc filler masterbatch market is expected to reach USD 2,368 million by 2035, up from USD 1,102 million in 2024. During the forecast period (2025-2035), the industry is projected to expand at a CAGR of 7.2%.
The global talc filler masterbatch market is surging as it plays a crucial role in enhancing performance, reducing costs, and improving polymer stability. As its applications expand across the automotive, construction, and packaging industries, demand is driven by mechanical reinforcement, processability, and compatibility with high-volume polymer systems, including polypropylene and polyethylene, in both industrial and consumer applications.
Quick Stats for Talc Filler Masterbatch Market
- Industry Value (2025): USD 1,182 Million
- Projected Value (2035): USD 2,368 Million
- Forecast CAGR (2025 to 2035): 7.2%
- Leading Segment (2025): Polypropylene (PP) (40.8% Market Share)
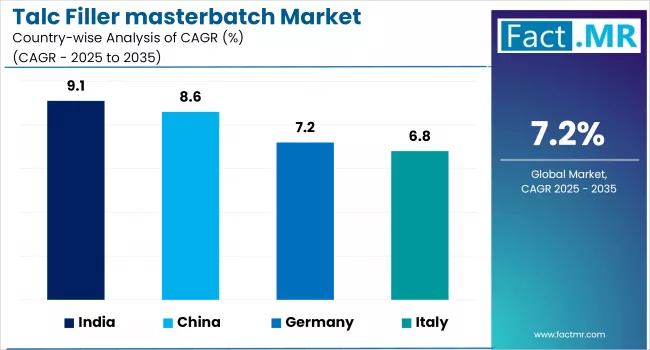
- Growing Country (2025-2035): India (9.1% CAGR)
- Key Players: LyondellBasell, Plasmix Pvt.Ltd, Polyfill, Allied Mineral Industries, Shivam Polychem, Alok Masterbatch
What are the drivers of the talc filler masterbatch market?
The automotive industry’s focus on lightweight, durable plastics is a key growth driver. Talc is used in filler masterbatches to provide stiffness and thermal properties to polypropylene components, enabling the replacement of metal in non-stressed applications by automakers. This trend is extending to electric vehicle platforms, where the uniformity of parts, reprocessing ability, and consistency of materials play a vital role in controlling costs and performance.
In building and construction, coarse talc-filled masterbatches enhance the rigidity and warping properties of polymer, particularly in extruded panels and pipe systems. This area is dominated by polyethylene due to the responsiveness of urban infrastructure development, and plastic products with supplemental mineral fillers in these applications are stable in dimension under stress and last longer. Investments in infrastructure in the Asia-Pacific region are strengthening demand.
Due to increased polymer costs, packaging converters are turning more to talc-filled masterbatches to achieve a two-to-one reduction in polymer usage while maintaining film integrity. Fine-micronized talc enhances the barrier and mechanical strength, which are crucial in high-speed thermoforming and blow molding.
As consumer brands shift towards eco-efficient packaging, the demand for masterbatch lies in the scales of performance enhancement and overall material reduction.
What are the regional trends of the talc filler Masterbatch market?
East Asia leads in terms of volume and innovation, with China positioned as the centre of production for filler masterbatch. The vertically integrated ecosystem in the country, spanning from mines to the compounding industry, enables the mass manufacturing of high-grade, talc-filled master batches of quality.
The domestic demand is also complemented by the automotive, appliance, and rigid packaging industries, which are in need of cost-efficient mineral-reinforced polymers.
South Asia and the Pacific, India and Vietnam specifically, are actively expanding their operations by going export-oriented. Players at the regional level have advantages as they have access to raw materials and have extrusion capabilities at a low cost. Their competitiveness in supplying talc masterbatches to the European, African, and Middle Eastern markets is being strengthened by government incentives and global trade connections.
Quality, compliance, and innovation are the focus of Western Europe. Italy is a technology-intensive manufacturing centre that supplies functionalized master batches to the medical and packaging markets.
This region has established stringent standards for food contact, REACH compliance, and industrial automation, and has become a premier entity for high-performance talc-filled compounds with specialized applications.
What are the challenges and restraining factors of the talc filler Masterbatch market?
There are geopolitical and regulatory threats to the talc supply chain. The curtailment of mining in some countries has also led to instability in the prices and availability of raw materials, particularly high-whiteness and fine-grade talc used in the food and medical industries. This has an impact on pricing models and long-term sourcing strategies of compounders worldwide.
The dispersion difficulties associated with technology also constrain the use of powdered masterbatch types in an automated line. Irregular mixing is a potential cause of agglomeration in particles, which affects the quality of products in packaging films and injection-molded products.
These issues are unfavorable in high-throughput conditions, where uniformity and aesthetics are non-negotiable among downstream manufacturers.
The differences in regulatory stipulations by region cause a slowdown in go-to-market time frames. The process of obtaining REACH certification in Europe or FDA conformity in North America can be time-consuming, resulting in a lengthy approval period for multi-regional compounders.
This is a setback, especially for SMEs, as they are unable to afford to ensure compliance with various frameworks, thereby reducing their competitiveness globally.
Country-Wise Insights
China is the Commanding Export Powerhouse in Mineral-Based Compounds
China maintains its leadership as the leading producer of talc filler masterbatches, supported by abundant domestic talc reserves and integrated supply chains. The country’s production capacity is anchored on clusters in the provinces of Guangxi, Liaoning and Shandong.
Chinese companies export to more than 70 countries with both pellet and powdered masterbatches, plus with the selection of masterbatches according to industrial requirements.
Growth in electric mobility, smart appliances and e-commerce packaging stimulates the domestic market of talc masterbatches in China. With OEMs becoming increasingly ambitious in terms of high-throughput production lines and dimensions, talc masterbatches are very useful for achieving weight savings and cost reductions without compromising rigidity and aesthetics, particularly in polypropylene-based systems.
Strategically, the Chinese compounders are now venturing into value-added applications, such as food-grade and flame-retardant masterbatches. High-shear dispersion and automated pelletizing investments enable uniformity in product quality.
China is leading in the export market around the globe by providing competitive volumes, minimal lead days and customizations in accordance with the international guidelines.
India is The Cost-Optimized Production Base for Export-Grade Masterbatch
India is rapidly becoming a low-cost quality-oriented talc filler masterbatches production site. Having reserves in Rajasthan and Andhra Pradesh and production hub of extrusion in Gujarat and Marathwada, India has vertically integrated production and a substantial cost advantage to global buyers in its packaging and construction industries.
Domestic demand is also growing, with a range of applications in agricultural films, multilayer rigid containers, and infrastructure-grade panels. To meet the demands of high-volume sectors, Indian manufacturers have taken advantage of the opportunity to blend efficiency masterbatches, allowing compatibility with either polyethylene or polypropylene by using talc.
Requirements in the packaging industry have also been quite robust because of the pressure on prices and the shelf life considerations.
Strategic export in India focuses on the markets in Africa, Southeast Asia, and the Middle East. Its reputation has been brought up by investment in surface treatment, twin screw extrusion, as well as ISO-certified processing. An increase in digitization in the procurement plane and improved logistic supply chains means that India will have scale and certification-friendly consistency to attack larger incumbents.
Italy is The High-Precision Supplier for Technical and Regulatory Markets
Italy is Western Europe’s primary hub for the production of premium talc filler masterbatches, catering to the medical, pharmaceutical, and specialty packaging sectors. Italian compounders focus on particle engineering, precise preparation, and adherence to regulations, which has given them a distinct advantage where the safety and performance of the product are paramount.
The local market is driven by the need to consume unique compounds that meet certification standards, such as compliance with EU food-contact and pharmaceutical grade requirements.
The talc filler masterbatches in the case are designed for use in drug packaging, medical-grade enclosures, and blister packs, where quality dispersion and the absence of impurities are strictly controlled.
Italy has an export strategy that sets its sights on the high-margin markets of Western Europe, North Africa, and Asia. Italian producers remain competitive because they focus on innovation rather than size, as they continue to invest in R&D and automated quality control. Complex applications will utilize them as partners, as they are able to meet multilayered standards.
Category-Wise Analysis
Polypropylene is The Backbone of High-Demand Filler Applications
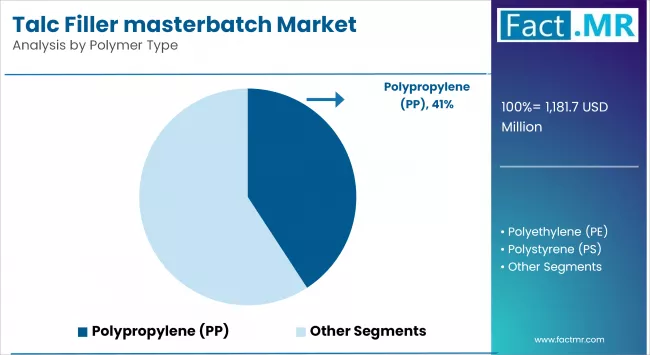
Polypropylene (PP) remains the most dominant polymer type for talc filler Masterbatch applications due to its high volume usage in the automotive, industrial packaging, and household goods sectors. Talc also makes PP more mechanically rigid, heat-resistant and impact-resistant. It is best suited to lightweight molded products like automotive dashboards and crates.
Supply and demand of PP-talc masterbatches in the Asia-Pacific and Latin America remain in growth mode with affordability and bulk production as main drivers of the talc filler masterbatch industry. High-load formulations are now superior, enabling them to deliver high consistency without compromising flexibility or color invariance. As it goes through use of healthcare trays and a semi-structural panel, the relevance of PP is not yet diminished in all the regional clusters of growth.
Pelletized Masterbatch is The Preferred Format for Industrial Throughput
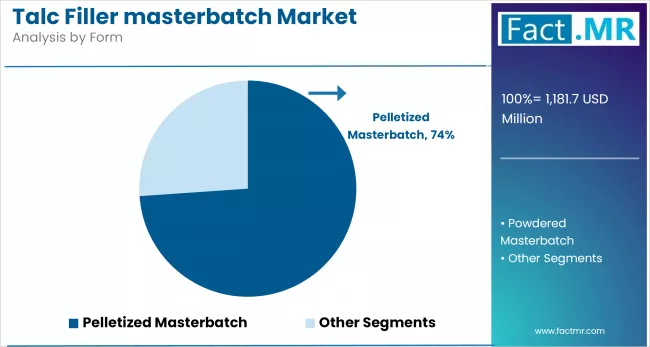
Pelletized talc filler masterbatches are preferred for their ease of dosing, cleanliness, and compatibility with high-speed processing equipment. These advantages are particularly useful in automotive injection molding, multilayer film extrusion, and blow molding lines, where precise feeding conditions and dust-free areas are required. The pelletized forms also minimize material loss and enhance the uniformity of dispersion.
The global converters are investing in gravimetric feeders and automation that perfectly fits the pelletized systems. This format augers well with uniformity of high-output processes and aims at reducing shutdown volumes. This is even more pertinent in Europe and North America, where regulatory and operational compliance with the use of clean, traceable inputs is required. With the increased application of automation, the pelletized master batch formats will become even more popular.
Competitive Analysis
Key players in the talc filler masterbatches industry include LyondellBasell, Plasmix Pvt. Ltd., Polyfill, Allied Mineral Industries, Shivam Polychem, Alok Masterbatch, Basco, Viba Group, Hindustan Colours, Gabriel-Chemie Group, RTP Company, Tosaf Group, and Astra Polymers.
Competition in the talc filler masterbatches space is intensifying, driven by sustainability demands, downstream customization, and export scale. Investments of players include high-talc loading technologies, precision surface coating and dual-compatible carrier resins to cater to various applications of rigid packaging, automotive parts and agricultural films.
The differentiation is influenced by the turnaround agility, formulation flexibility, and sourcing talc. The Asian suppliers are competitive on both price and volume whereas European manufacturers can customize to regulatory quality. There is a procurement behavior change to more extended contracts as well as solution selling. Wisdom shared between technical organizations and co-development programs are remodeling buyer anticipations in tier-one converter communities.
Recent Development
- In March 2025, LyondellBasell approved a $125 million metathesis unit at its Channelview Complex in Texas, aimed at producing 400 kt per year of polymer-grade propylene. Ground-breaking was scheduled for Q3 2025, with start-up expected in late 2028. The project created 750 temporary construction jobs and 25 permanent positions, supporting the company’s strategy for securing raw materials.
- In January 2025, Viba S.p.A. announced that its headquarters in Tradate, Italy, achieved ISCC PLUS certification. This certification confirmed traceability and mass-balance control for bio-based and recycled feedstocks in VIBATAN® additive, color, and talc filler Masterbatches. The accreditation allowed customers to claim EU-recognized sustainability credits without changing processing parameters, positioning Viba to supply recycled-content grades amid stricter European regulations.
Fact.MR has provided detailed information about the price points of key manufacturers of the Talc Filler Masterbatch Market positioned across regions, sales growth, production capacity, and speculative technological expansion, in the recently published report.
Methodology and Industry Tracking Approach
The 2025 Talc Filler Masterbatch Market Report by Fact.MR is based on insights collected from 1,200 stakeholders across 12 countries, with a minimum of 75 respondents per country. Among the participants, 65% were end users, including polymer processors, packaging converters, infrastructure plastics manufacturers, and automotive OEMs, while the remaining 35% included sourcing heads, application engineers, regulatory specialists, and Masterbatch formulators.
Data collection was conducted between June 2024 and May 2025, focusing on parameters such as talc particle size dispersion, compound stability, regulatory conformity, environmental safety thresholds, and compatibility with mass manufacturing lines. A regionally representative calibration model ensured balanced insight across Europe, Asia Pacific, and North America.
The study draws on over 95 validated sources, including industrial application case studies, regulatory certification databases, polymer research publications, and audited financial statements from Masterbatch leaders. All findings were rigorously triangulated to deliver robust, actionable intelligence to industry participants and strategic planners.
Fact.MR applied rigorous analytical tools, such as multivariate regression and scenario modeling, to ensure data robustness. With continuous monitoring of the glass adhesives market since 2018, this report provides a comprehensive roadmap for firms seeking a competitive advantage, innovation, and sustainable growth within the sector.
Segmentation of Talc Filler Masterbatch Market
-
By Polymer Type :
- Polypropylene (PP)
- Polyethylene (PE)
- Polystyrene (PS)
- Polyvinyl Chloride (PVC)
- Others (ABS, PET, PA)
-
By Form :
- Pelletized Masterbatch
- Powdered Masterbatch
-
By Talc Particle Size :
- Fine Talc (Micronized Talc)
- Coarse Talc
-
By End-Use Industry :
- Automotive
- Building & Construction
- Packaging
- Agriculture
- Medical
- Other Industries
-
By Region :
- North America
- Latin America
- Western Europe
- Eastern Europe
- East Asia
- South Asia & Pacific
- Middle East & Africa
Table of Content
- Executive Summary
- Global Market Outlook
- Demand-side Trends
- Supply-side Trends
- Technology Roadmap Analysis
- Analysis and Recommendations
- Market Overview
- Market Coverage / Taxonomy
- Market Definition / Scope / Limitations
- Market Background
- Market Dynamics
- Drivers
- Restraints
- Opportunity
- Trends
- Scenario Forecast
- Demand in Optimistic Scenario
- Demand in Likely Scenario
- Demand in Conservative Scenario
- Opportunity Map Analysis
- Product Life Cycle Analysis
- Supply Chain Analysis
- Supply Side Participants and their Roles
- Producers
- Mid-Level Participants (Traders/ Agents/ Brokers)
- Wholesalers and Distributors
- Value Added and Value Created at Node in the Supply Chain
- List of Raw Material Suppliers
- List of Existing and Potential Buyers
- Supply Side Participants and their Roles
- Investment Feasibility Matrix
- Value Chain Analysis
- Profit Margin Analysis
- Wholesalers and Distributors
- Retailers
- PESTLE and Porter’s Analysis
- Regulatory Landscape
- By Key Regions
- By Key Countries
- Production and Consumption Statistics
- Import and Export Statistics
- Market Dynamics
- Global Market Analysis 2020 to 2024 and Forecast, 2025 to 2035
- Historical Market Size Value (USD Mn) & Volume (Tons) Analysis, 2020 to 2024
- Current and Future Market Size Value (USD Mn) & Volume (Tons) Projections, 2025 to 2035
- Y-o-Y Growth Trend Analysis
- Absolute $ Opportunity Analysis
- Global Market Pricing Analysis 2020 to 2024 and Forecast 2025 to 2035
- Global Market Analysis 2020 to 2024 and Forecast 2025 to 2035, By Polymer Type
- Introduction / Key Findings
- Historical Market Size Value (USD Mn) & Volume (Tons) Analysis By Polymer Type, 2020 to 2024
- Current and Future Market Size Value (USD Mn) & Volume (Tons) Analysis and Forecast By Polymer Type, 2025 to 2035
- Polypropylene (PP)
- Polyethylene (PE)
- Polystyrene (PS)
- Polyvinyl Chloride (PVC)
- Others
- Y-o-Y Growth Trend Analysis By Polymer Type, 2020 to 2024
- Absolute $ Opportunity Analysis By Polymer Type, 2025 to 2035
- Global Market Analysis 2020 to 2024 and Forecast 2025 to 2035, By Form
- Introduction / Key Findings
- Historical Market Size Value (USD Mn) & Volume (Tons) Analysis By Form, 2020 to 2024
- Current and Future Market Size Value (USD Mn) & Volume (Tons) Analysis and Forecast By Form, 2025 to 2035
- Pelletized Masterbatch
- Powdered Masterbatch
- Y-o-Y Growth Trend Analysis By Form, 2020 to 2024
- Absolute $ Opportunity Analysis By Form, 2025 to 2035
- Global Market Analysis 2020 to 2024 and Forecast 2025 to 2035, By Talc Particle Size
- Introduction / Key Findings
- Historical Market Size Value (USD Mn) & Volume (Tons) Analysis By Talc Particle Size, 2020 to 2024
- Current and Future Market Size Value (USD Mn) & Volume (Tons) Analysis and Forecast By Talc Particle Size, 2025 to 2035
- Fine Talc (Micronized Talc)
- Coarse Talc
- Y-o-Y Growth Trend Analysis By Talc Particle Size, 2020 to 2024
- Absolute $ Opportunity Analysis By Talc Particle Size, 2025 to 2035
- Global Market Analysis 2020 to 2024 and Forecast 2025 to 2035, By End-Use Industry
- Introduction / Key Findings
- Historical Market Size Value (USD Mn) & Volume (Tons) Analysis By End-Use Industry, 2020 to 2024
- Current and Future Market Size Value (USD Mn) & Volume (Tons) Analysis and Forecast By End-Use Industry, 2025 to 2035
- Automotive
- Building & Construction
- Packaging
- Agriculture
- Medical
- Other Industries
- Y-o-Y Growth Trend Analysis By End-Use Industry, 2020 to 2024
- Absolute $ Opportunity Analysis By End-Use Industry, 2025 to 2035
- Global Market Analysis 2020 to 2024 and Forecast 2025 to 2035, By Region
- Introduction
- Historical Market Size Value (USD Mn) & Volume (Tons) Analysis By Region, 2020 to 2024
- Current Market Size Value (USD Mn) & Volume (Tons) Analysis and Forecast By Region, 2025 to 2035
- North America
- Latin America
- Western Europe
- East Asia
- South Asia Pacific
- Eastern Europe
- Middle East & Africa
- Market Attractiveness Analysis By Region
- North America Market Analysis 2020 to 2024 and Forecast 2025 to 2035, By Country
- Historical Market Size Value (USD Mn) & Volume (Tons) Trend Analysis By Market Taxonomy, 2020 to 2024
- Market Size Value (USD Mn) & Volume (Tons) Forecast By Market Taxonomy, 2025 to 2035
- By Country
- U.S.
- Canada
- Mexico
- By Polymer Type
- By Form
- By Talc Particle Size
- By End-Use Industry
- By Country
- Market Attractiveness Analysis
- By Country
- By Polymer Type
- By Form
- By Talc Particle Size
- By End-Use Industry
- Key Takeaways
- Latin America Market Analysis 2020 to 2024 and Forecast 2025 to 2035, By Country
- Historical Market Size Value (USD Mn) & Volume (Tons) Trend Analysis By Market Taxonomy, 2020 to 2024
- Market Size Value (USD Mn) & Volume (Tons) Forecast By Market Taxonomy, 2025 to 2035
- By Country
- Brazil
- Chile
- Rest of Latin America
- By Polymer Type
- By Form
- By Talc Particle Size
- By End-Use Industry
- By Country
- Market Attractiveness Analysis
- By Country
- By Polymer Type
- By Form
- By Talc Particle Size
- By End-Use Industry
- Key Takeaways
- Western Europe Market Analysis 2020 to 2024 and Forecast 2025 to 2035, By Country
- Historical Market Size Value (USD Mn) & Volume (Tons) Trend Analysis By Market Taxonomy, 2020 to 2024
- Market Size Value (USD Mn) & Volume (Tons) Forecast By Market Taxonomy, 2025 to 2035
- By Country
- Germany
- Italy
- France
- U.K.
- Spain
- Russia
- BENELUX
- Rest of Europe
- By Polymer Type
- By Form
- By Talc Particle Size
- By End-Use Industry
- By Country
- Market Attractiveness Analysis
- By Country
- By Polymer Type
- By Form
- By Talc Particle Size
- By End-Use Industry
- Key Takeaways
- East Asia Market Analysis 2020 to 2024 and Forecast 2025 to 2035, By Country
- Historical Market Size Value (USD Mn) & Volume (Tons) Trend Analysis By Market Taxonomy, 2020 to 2024
- Market Size Value (USD Mn) & Volume (Tons) Forecast By Market Taxonomy, 2025 to 2035
- By Country
- China
- Japan
- South Korea
- By Polymer Type
- By Form
- By Talc Particle Size
- By End-Use Industry
- By Country
- Market Attractiveness Analysis
- By Country
- By Polymer Type
- By Form
- By Talc Particle Size
- By End-Use Industry
- Key Takeaways
- South Asia Pacific Market Analysis 2020 to 2024 and Forecast 2025 to 2035, By Country
- Historical Market Size Value (USD Mn) & Volume (Tons) Trend Analysis By Market Taxonomy, 2020 to 2024
- Market Size Value (USD Mn) & Volume (Tons) Forecast By Market Taxonomy, 2025 to 2035
- By Country
- India
- ASEAN Countries
- Australia & New Zealand
- Rest of South Asia Pacific
- By Polymer Type
- By Form
- By Talc Particle Size
- By End-Use Industry
- By Country
- Market Attractiveness Analysis
- By Country
- By Polymer Type
- By Form
- By Talc Particle Size
- By End-Use Industry
- Key Takeaways
- Eastern Europe Market Analysis 2020 to 2024 and Forecast 2025 to 2035, By Country
- Historical Market Size Value (USD Mn) & Volume (Tons) Trend Analysis By Market Taxonomy, 2020 to 2024
- Market Size Value (USD Mn) & Volume (Tons) Forecast By Market Taxonomy, 2025 to 2035
- By Country
- Russia
- Poland
- Hungary
- Balkan & Baltics
- Rest of Eastern Europe
- By Polymer Type
- By Form
- By Talc Particle Size
- By End-Use Industry
- By Country
- Market Attractiveness Analysis
- By Country
- By Polymer Type
- By Form
- By Talc Particle Size
- By End-Use Industry
- Key Takeaways
- Middle East & Africa Market Analysis 2020 to 2024 and Forecast 2025 to 2035, By Country
- Historical Market Size Value (USD Mn) & Volume (Tons) Trend Analysis By Market Taxonomy, 2020 to 2024
- Market Size Value (USD Mn) & Volume (Tons) Forecast By Market Taxonomy, 2025 to 2035
- By Country
- KSA
- Other GCC Countries
- Turkiye
- South Africa
- Rest of MEA
- By Polymer Type
- By Form
- By Talc Particle Size
- By End-Use Industry
- By Country
- Market Attractiveness Analysis
- By Country
- By Polymer Type
- By Form
- By Talc Particle Size
- By End-Use Industry
- Key Takeaways
- Key Countries Market Analysis
- China
- Pricing Analysis
- Market Share Analysis, 2024
- By Polymer Type
- By Form
- By Talc Particle Size
- By End-Use Industry
- Vietnam
- Pricing Analysis
- Market Share Analysis, 2024
- By Polymer Type
- By Form
- By Talc Particle Size
- By End-Use Industry
- Turkey
- Pricing Analysis
- Market Share Analysis, 2024
- By Polymer Type
- By Form
- By Talc Particle Size
- By End-Use Industry
- India
- Pricing Analysis
- Market Share Analysis, 2024
- By Polymer Type
- By Form
- By Talc Particle Size
- By End-Use Industry
- Italy
- Pricing Analysis
- Market Share Analysis, 2024
- By Polymer Type
- By Form
- By Talc Particle Size
- By End-Use Industry
- China
- Market Structure Analysis
- Competition Dashboard
- Competition Benchmarking
- Market Share Analysis of Top Players
- By Regional
- By Polymer Type
- By Form
- By Talc Particle Size
- By End-Use Industry
- Competition Analysis
- Competition Deep Dive
- LyondellBasell
- Overview
- Product Portfolio
- Profitability by Market Segments (Product/Age /Sales Channel/Region)
- Sales Footprint
- Strategy Overview
- Marketing Strategy
- Product Strategy
- Channel Strategy
- Plasmix Pvt.Ltd
- Overview
- Product Portfolio
- Profitability by Market Segments (Product/Age /Sales Channel/Region)
- Sales Footprint
- Strategy Overview
- Marketing Strategy
- Product Strategy
- Channel Strategy
- Polyfill
- Overview
- Product Portfolio
- Profitability by Market Segments (Product/Age /Sales Channel/Region)
- Sales Footprint
- Strategy Overview
- Marketing Strategy
- Product Strategy
- Channel Strategy
- Allied Mineral Industries
- Overview
- Product Portfolio
- Profitability by Market Segments (Product/Age /Sales Channel/Region)
- Sales Footprint
- Strategy Overview
- Marketing Strategy
- Product Strategy
- Channel Strategy
- Shivam Polychem
- Overview
- Product Portfolio
- Profitability by Market Segments (Product/Age /Sales Channel/Region)
- Sales Footprint
- Strategy Overview
- Marketing Strategy
- Product Strategy
- Channel Strategy
- Alok Masterbatch
- Overview
- Product Portfolio
- Profitability by Market Segments (Product/Age /Sales Channel/Region)
- Sales Footprint
- Strategy Overview
- Marketing Strategy
- Product Strategy
- Channel Strategy
- Basco
- Overview
- Product Portfolio
- Profitability by Market Segments (Product/Age /Sales Channel/Region)
- Sales Footprint
- Strategy Overview
- Marketing Strategy
- Product Strategy
- Channel Strategy
- Viba Group
- Overview
- Product Portfolio
- Profitability by Market Segments (Product/Age /Sales Channel/Region)
- Sales Footprint
- Strategy Overview
- Marketing Strategy
- Product Strategy
- Channel Strategy
- Hindustan Colours
- Overview
- Product Portfolio
- Profitability by Market Segments (Product/Age /Sales Channel/Region)
- Sales Footprint
- Strategy Overview
- Marketing Strategy
- Product Strategy
- Channel Strategy
- Gabriel-Chemie Group
- Overview
- Product Portfolio
- Profitability by Market Segments (Product/Age /Sales Channel/Region)
- Sales Footprint
- Strategy Overview
- Marketing Strategy
- Product Strategy
- Channel Strategy
- RTP Company
- Overview
- Product Portfolio
- Profitability by Market Segments (Product/Age /Sales Channel/Region)
- Sales Footprint
- Strategy Overview
- Marketing Strategy
- Product Strategy
- Channel Strategy
- Tosaf Group
- Overview
- Product Portfolio
- Profitability by Market Segments (Product/Age /Sales Channel/Region)
- Sales Footprint
- Strategy Overview
- Marketing Strategy
- Product Strategy
- Channel Strategy
- Astra Polymers
- Overview
- Product Portfolio
- Profitability by Market Segments (Product/Age /Sales Channel/Region)
- Sales Footprint
- Strategy Overview
- Marketing Strategy
- Product Strategy
- Channel Strategy
- Other Market Players
- Overview
- Product Portfolio
- Profitability by Market Segments (Product/Age /Sales Channel/Region)
- Sales Footprint
- Strategy Overview
- Marketing Strategy
- Product Strategy
- Channel Strategy
- LyondellBasell
- Competition Deep Dive
- Assumptions & Acronyms Used
- Research Methodology
List Of Table
- Table 1: Global Market Value (USD Mn) Forecast by Region, 2020 to 2035
- Table 2: Global Market Volume (Tons) Forecast by Region, 2020 to 2035
- Table 3: Global Market Value (USD Mn) Forecast by Polymer Type, 2020 to 2035
- Table 4: Global Market Volume (Tons) Forecast by Polymer Type, 2020 to 2035
- Table 5: Global Market Value (USD Mn) Forecast by Form, 2020 to 2035
- Table 6: Global Market Volume (Tons) Forecast by Form, 2020 to 2035
- Table 7: Global Market Value (USD Mn) Forecast by Talc Particle Size, 2020 to 2035
- Table 8: Global Market Volume (Tons) Forecast by Talc Particle Size, 2020 to 2035
- Table 9: Global Market Value (USD Mn) Forecast by End-Use Industry, 2020 to 2035
- Table 10: Global Market Volume (Tons) Forecast by End-Use Industry, 2020 to 2035
- Table 11: North America Market Value (USD Mn) Forecast by Country, 2020 to 2035
- Table 12: North America Market Volume (Tons) Forecast by Country, 2020 to 2035
- Table 13: North America Market Value (USD Mn) Forecast by Polymer Type, 2020 to 2035
- Table 14: North America Market Volume (Tons) Forecast by Polymer Type, 2020 to 2035
- Table 15: North America Market Value (USD Mn) Forecast by Form, 2020 to 2035
- Table 16: North America Market Volume (Tons) Forecast by Form, 2020 to 2035
- Table 17: North America Market Value (USD Mn) Forecast by Talc Particle Size, 2020 to 2035
- Table 18: North America Market Volume (Tons) Forecast by Talc Particle Size, 2020 to 2035
- Table 19: North America Market Value (USD Mn) Forecast by End-Use Industry, 2020 to 2035
- Table 20: North America Market Volume (Tons) Forecast by End-Use Industry, 2020 to 2035
- Table 21: Latin America Market Value (USD Mn) Forecast by Country, 2020 to 2035
- Table 22: Latin America Market Volume (Tons) Forecast by Country, 2020 to 2035
- Table 23: Latin America Market Value (USD Mn) Forecast by Polymer Type, 2020 to 2035
- Table 24: Latin America Market Volume (Tons) Forecast by Polymer Type, 2020 to 2035
- Table 25: Latin America Market Value (USD Mn) Forecast by Form, 2020 to 2035
- Table 26: Latin America Market Volume (Tons) Forecast by Form, 2020 to 2035
- Table 27: Latin America Market Value (USD Mn) Forecast by Talc Particle Size, 2020 to 2035
- Table 28: Latin America Market Volume (Tons) Forecast by Talc Particle Size, 2020 to 2035
- Table 29: Latin America Market Value (USD Mn) Forecast by End-Use Industry, 2020 to 2035
- Table 30: Latin America Market Volume (Tons) Forecast by End-Use Industry, 2020 to 2035
- Table 31: Western Europe Market Value (USD Mn) Forecast by Country, 2020 to 2035
- Table 32: Western Europe Market Volume (Tons) Forecast by Country, 2020 to 2035
- Table 33: Western Europe Market Value (USD Mn) Forecast by Polymer Type, 2020 to 2035
- Table 34: Western Europe Market Volume (Tons) Forecast by Polymer Type, 2020 to 2035
- Table 35: Western Europe Market Value (USD Mn) Forecast by Form, 2020 to 2035
- Table 36: Western Europe Market Volume (Tons) Forecast by Form, 2020 to 2035
- Table 37: Western Europe Market Value (USD Mn) Forecast by Talc Particle Size, 2020 to 2035
- Table 38: Western Europe Market Volume (Tons) Forecast by Talc Particle Size, 2020 to 2035
- Table 39: Western Europe Market Value (USD Mn) Forecast by End-Use Industry, 2020 to 2035
- Table 40: Western Europe Market Volume (Tons) Forecast by End-Use Industry, 2020 to 2035
- Table 41: East Asia Market Value (USD Mn) Forecast by Country, 2020 to 2035
- Table 42: East Asia Market Volume (Tons) Forecast by Country, 2020 to 2035
- Table 43: East Asia Market Value (USD Mn) Forecast by Polymer Type, 2020 to 2035
- Table 44: East Asia Market Volume (Tons) Forecast by Polymer Type, 2020 to 2035
- Table 45: East Asia Market Value (USD Mn) Forecast by Form, 2020 to 2035
- Table 46: East Asia Market Volume (Tons) Forecast by Form, 2020 to 2035
- Table 47: East Asia Market Value (USD Mn) Forecast by Talc Particle Size, 2020 to 2035
- Table 48: East Asia Market Volume (Tons) Forecast by Talc Particle Size, 2020 to 2035
- Table 49: East Asia Market Value (USD Mn) Forecast by End-Use Industry, 2020 to 2035
- Table 50: East Asia Market Volume (Tons) Forecast by End-Use Industry, 2020 to 2035
- Table 51: South Asia Pacific Market Value (USD Mn) Forecast by Country, 2020 to 2035
- Table 52: South Asia Pacific Market Volume (Tons) Forecast by Country, 2020 to 2035
- Table 53: South Asia Pacific Market Value (USD Mn) Forecast by Polymer Type, 2020 to 2035
- Table 54: South Asia Pacific Market Volume (Tons) Forecast by Polymer Type, 2020 to 2035
- Table 55: South Asia Pacific Market Value (USD Mn) Forecast by Form, 2020 to 2035
- Table 56: South Asia Pacific Market Volume (Tons) Forecast by Form, 2020 to 2035
- Table 57: South Asia Pacific Market Value (USD Mn) Forecast by Talc Particle Size, 2020 to 2035
- Table 58: South Asia Pacific Market Volume (Tons) Forecast by Talc Particle Size, 2020 to 2035
- Table 59: South Asia Pacific Market Value (USD Mn) Forecast by End-Use Industry, 2020 to 2035
- Table 60: South Asia Pacific Market Volume (Tons) Forecast by End-Use Industry, 2020 to 2035
- Table 61: Eastern Europe Market Value (USD Mn) Forecast by Country, 2020 to 2035
- Table 62: Eastern Europe Market Volume (Tons) Forecast by Country, 2020 to 2035
- Table 63: Eastern Europe Market Value (USD Mn) Forecast by Polymer Type, 2020 to 2035
- Table 64: Eastern Europe Market Volume (Tons) Forecast by Polymer Type, 2020 to 2035
- Table 65: Eastern Europe Market Value (USD Mn) Forecast by Form, 2020 to 2035
- Table 66: Eastern Europe Market Volume (Tons) Forecast by Form, 2020 to 2035
- Table 67: Eastern Europe Market Value (USD Mn) Forecast by Talc Particle Size, 2020 to 2035
- Table 68: Eastern Europe Market Volume (Tons) Forecast by Talc Particle Size, 2020 to 2035
- Table 69: Eastern Europe Market Value (USD Mn) Forecast by End-Use Industry, 2020 to 2035
- Table 70: Eastern Europe Market Volume (Tons) Forecast by End-Use Industry, 2020 to 2035
- Table 71: Middle East & Africa Market Value (USD Mn) Forecast by Country, 2020 to 2035
- Table 72: Middle East & Africa Market Volume (Tons) Forecast by Country, 2020 to 2035
- Table 73: Middle East & Africa Market Value (USD Mn) Forecast by Polymer Type, 2020 to 2035
- Table 74: Middle East & Africa Market Volume (Tons) Forecast by Polymer Type, 2020 to 2035
- Table 75: Middle East & Africa Market Value (USD Mn) Forecast by Form, 2020 to 2035
- Table 76: Middle East & Africa Market Volume (Tons) Forecast by Form, 2020 to 2035
- Table 77: Middle East & Africa Market Value (USD Mn) Forecast by Talc Particle Size, 2020 to 2035
- Table 78: Middle East & Africa Market Volume (Tons) Forecast by Talc Particle Size, 2020 to 2035
- Table 79: Middle East & Africa Market Value (USD Mn) Forecast by End-Use Industry, 2020 to 2035
- Table 80: Middle East & Africa Market Volume (Tons) Forecast by End-Use Industry, 2020 to 2035
List Of Figures
- Figure 1: Global Market Volume (Tons) Forecast 2020 to 2035
- Figure 2: Global Market Pricing Analysis
- Figure 3: Global Market Value (USD Mn) Forecast 2020 to 2035
- Figure 4: Global Market Value Share and BPS Analysis by Polymer Type, 2025 and 2035
- Figure 5: Global Market Y-o-Y Growth Comparison by Polymer Type, 2025 to 2035
- Figure 6: Global Market Attractiveness Analysis by Polymer Type
- Figure 7: Global Market Value Share and BPS Analysis by Form, 2025 and 2035
- Figure 8: Global Market Y-o-Y Growth Comparison by Form, 2025 to 2035
- Figure 9: Global Market Attractiveness Analysis by Form
- Figure 10: Global Market Value Share and BPS Analysis by Talc Particle Size, 2025 and 2035
- Figure 11: Global Market Y-o-Y Growth Comparison by Talc Particle Size, 2025 to 2035
- Figure 12: Global Market Attractiveness Analysis by Talc Particle Size
- Figure 13: Global Market Value Share and BPS Analysis by End-Use Industry, 2025 and 2035
- Figure 14: Global Market Y-o-Y Growth Comparison by End-Use Industry, 2025 to 2035
- Figure 15: Global Market Attractiveness Analysis by End-Use Industry
- Figure 16: Global Market Value (USD Mn) Share and BPS Analysis by Region, 2025 and 2035
- Figure 17: Global Market Y-o-Y Growth Comparison by Region, 2025 to 2035
- Figure 18: Global Market Attractiveness Analysis by Region
- Figure 19: North America Market Incremental $ Opportunity, 2025 to 2035
- Figure 20: Latin America Market Incremental $ Opportunity, 2025 to 2035
- Figure 21: Western Europe Market Incremental $ Opportunity, 2025 to 2035
- Figure 22: East Asia Market Incremental $ Opportunity, 2025 to 2035
- Figure 23: South Asia Pacific Market Incremental $ Opportunity, 2025 to 2035
- Figure 24: Eastern Europe Market Incremental $ Opportunity, 2025 to 2035
- Figure 25: Middle East & Africa Market Incremental $ Opportunity, 2025 to 2035
- Figure 26: North America Market Value Share and BPS Analysis by Country, 2025 and 2035
- Figure 27: North America Market Value Share and BPS Analysis by Polymer Type, 2025 and 2035
- Figure 28: North America Market Y-o-Y Growth Comparison by Polymer Type, 2025 to 2035
- Figure 29: North America Market Attractiveness Analysis by Polymer Type
- Figure 30: North America Market Value Share and BPS Analysis by Form, 2025 and 2035
- Figure 31: North America Market Y-o-Y Growth Comparison by Form, 2025 to 2035
- Figure 32: North America Market Attractiveness Analysis by Form
- Figure 33: North America Market Value Share and BPS Analysis by Talc Particle Size, 2025 and 2035
- Figure 34: North America Market Y-o-Y Growth Comparison by Talc Particle Size, 2025 to 2035
- Figure 35: North America Market Attractiveness Analysis by Talc Particle Size
- Figure 36: North America Market Value Share and BPS Analysis by End-Use Industry, 2025 and 2035
- Figure 37: North America Market Y-o-Y Growth Comparison by End-Use Industry, 2025 to 2035
- Figure 38: North America Market Attractiveness Analysis by End-Use Industry
- Figure 39: Latin America Market Value Share and BPS Analysis by Country, 2025 and 2035
- Figure 40: Latin America Market Value Share and BPS Analysis by Polymer Type, 2025 and 2035
- Figure 41: Latin America Market Y-o-Y Growth Comparison by Polymer Type, 2025 to 2035
- Figure 42: Latin America Market Attractiveness Analysis by Polymer Type
- Figure 43: Latin America Market Value Share and BPS Analysis by Form, 2025 and 2035
- Figure 44: Latin America Market Y-o-Y Growth Comparison by Form, 2025 to 2035
- Figure 45: Latin America Market Attractiveness Analysis by Form
- Figure 46: Latin America Market Value Share and BPS Analysis by Talc Particle Size, 2025 and 2035
- Figure 47: Latin America Market Y-o-Y Growth Comparison by Talc Particle Size, 2025 to 2035
- Figure 48: Latin America Market Attractiveness Analysis by Talc Particle Size
- Figure 49: Latin America Market Value Share and BPS Analysis by End-Use Industry, 2025 and 2035
- Figure 50: Latin America Market Y-o-Y Growth Comparison by End-Use Industry, 2025 to 2035
- Figure 51: Latin America Market Attractiveness Analysis by End-Use Industry
- Figure 52: Western Europe Market Value Share and BPS Analysis by Country, 2025 and 2035
- Figure 53: Western Europe Market Value Share and BPS Analysis by Polymer Type, 2025 and 2035
- Figure 54: Western Europe Market Y-o-Y Growth Comparison by Polymer Type, 2025 to 2035
- Figure 55: Western Europe Market Attractiveness Analysis by Polymer Type
- Figure 56: Western Europe Market Value Share and BPS Analysis by Form, 2025 and 2035
- Figure 57: Western Europe Market Y-o-Y Growth Comparison by Form, 2025 to 2035
- Figure 58: Western Europe Market Attractiveness Analysis by Form
- Figure 59: Western Europe Market Value Share and BPS Analysis by Talc Particle Size, 2025 and 2035
- Figure 60: Western Europe Market Y-o-Y Growth Comparison by Talc Particle Size, 2025 to 2035
- Figure 61: Western Europe Market Attractiveness Analysis by Talc Particle Size
- Figure 62: Western Europe Market Value Share and BPS Analysis by End-Use Industry, 2025 and 2035
- Figure 63: Western Europe Market Y-o-Y Growth Comparison by End-Use Industry, 2025 to 2035
- Figure 64: Western Europe Market Attractiveness Analysis by End-Use Industry
- Figure 65: East Asia Market Value Share and BPS Analysis by Country, 2025 and 2035
- Figure 66: East Asia Market Value Share and BPS Analysis by Polymer Type, 2025 and 2035
- Figure 67: East Asia Market Y-o-Y Growth Comparison by Polymer Type, 2025 to 2035
- Figure 68: East Asia Market Attractiveness Analysis by Polymer Type
- Figure 69: East Asia Market Value Share and BPS Analysis by Form, 2025 and 2035
- Figure 70: East Asia Market Y-o-Y Growth Comparison by Form, 2025 to 2035
- Figure 71: East Asia Market Attractiveness Analysis by Form
- Figure 72: East Asia Market Value Share and BPS Analysis by Talc Particle Size, 2025 and 2035
- Figure 73: East Asia Market Y-o-Y Growth Comparison by Talc Particle Size, 2025 to 2035
- Figure 74: East Asia Market Attractiveness Analysis by Talc Particle Size
- Figure 75: East Asia Market Value Share and BPS Analysis by End-Use Industry, 2025 and 2035
- Figure 76: East Asia Market Y-o-Y Growth Comparison by End-Use Industry, 2025 to 2035
- Figure 77: East Asia Market Attractiveness Analysis by End-Use Industry
- Figure 78: South Asia Pacific Market Value Share and BPS Analysis by Country, 2025 and 2035
- Figure 79: South Asia Pacific Market Value Share and BPS Analysis by Polymer Type, 2025 and 2035
- Figure 80: South Asia Pacific Market Y-o-Y Growth Comparison by Polymer Type, 2025 to 2035
- Figure 81: South Asia Pacific Market Attractiveness Analysis by Polymer Type
- Figure 82: South Asia Pacific Market Value Share and BPS Analysis by Form, 2025 and 2035
- Figure 83: South Asia Pacific Market Y-o-Y Growth Comparison by Form, 2025 to 2035
- Figure 84: South Asia Pacific Market Attractiveness Analysis by Form
- Figure 85: South Asia Pacific Market Value Share and BPS Analysis by Talc Particle Size, 2025 and 2035
- Figure 86: South Asia Pacific Market Y-o-Y Growth Comparison by Talc Particle Size, 2025 to 2035
- Figure 87: South Asia Pacific Market Attractiveness Analysis by Talc Particle Size
- Figure 88: South Asia Pacific Market Value Share and BPS Analysis by End-Use Industry, 2025 and 2035
- Figure 89: South Asia Pacific Market Y-o-Y Growth Comparison by End-Use Industry, 2025 to 2035
- Figure 90: South Asia Pacific Market Attractiveness Analysis by End-Use Industry
- Figure 91: Eastern Europe Market Value Share and BPS Analysis by Country, 2025 and 2035
- Figure 92: Eastern Europe Market Value Share and BPS Analysis by Polymer Type, 2025 and 2035
- Figure 93: Eastern Europe Market Y-o-Y Growth Comparison by Polymer Type, 2025 to 2035
- Figure 94: Eastern Europe Market Attractiveness Analysis by Polymer Type
- Figure 95: Eastern Europe Market Value Share and BPS Analysis by Form, 2025 and 2035
- Figure 96: Eastern Europe Market Y-o-Y Growth Comparison by Form, 2025 to 2035
- Figure 97: Eastern Europe Market Attractiveness Analysis by Form
- Figure 98: Eastern Europe Market Value Share and BPS Analysis by Talc Particle Size, 2025 and 2035
- Figure 99: Eastern Europe Market Y-o-Y Growth Comparison by Talc Particle Size, 2025 to 2035
- Figure 100: Eastern Europe Market Attractiveness Analysis by Talc Particle Size
- Figure 101: Eastern Europe Market Value Share and BPS Analysis by End-Use Industry, 2025 and 2035
- Figure 102: Eastern Europe Market Y-o-Y Growth Comparison by End-Use Industry, 2025 to 2035
- Figure 103: Eastern Europe Market Attractiveness Analysis by End-Use Industry
- Figure 104: Middle East & Africa Market Value Share and BPS Analysis by Country, 2025 and 2035
- Figure 105: Middle East & Africa Market Value Share and BPS Analysis by Polymer Type, 2025 and 2035
- Figure 106: Middle East & Africa Market Y-o-Y Growth Comparison by Polymer Type, 2025 to 2035
- Figure 107: Middle East & Africa Market Attractiveness Analysis by Polymer Type
- Figure 108: Middle East & Africa Market Value Share and BPS Analysis by Form, 2025 and 2035
- Figure 109: Middle East & Africa Market Y-o-Y Growth Comparison by Form, 2025 to 2035
- Figure 110: Middle East & Africa Market Attractiveness Analysis by Form
- Figure 111: Middle East & Africa Market Value Share and BPS Analysis by Talc Particle Size, 2025 and 2035
- Figure 112: Middle East & Africa Market Y-o-Y Growth Comparison by Talc Particle Size, 2025 to 2035
- Figure 113: Middle East & Africa Market Attractiveness Analysis by Talc Particle Size
- Figure 114: Middle East & Africa Market Value Share and BPS Analysis by End-Use Industry, 2025 and 2035
- Figure 115: Middle East & Africa Market Y-o-Y Growth Comparison by End-Use Industry, 2025 to 2035
- Figure 116: Middle East & Africa Market Attractiveness Analysis by End-Use Industry
- Figure 117: Global Market - Tier Structure Analysis
- Figure 118: Global Market - Company Share Analysis
- FAQs -
What was the Global Talc Filler Masterbatch Market Size Reported by Fact.MR for 2025?
The global talc filler masterbatch market was valued at USD 1,182 million in 2025.
Who are the Major Players Operating in the Talc Filler Masterbatch Market?
Prominent players in the market are LyondellBasell, Plasmix Pvt.Ltd, Polyfill, Allied Mineral Industries, among others.
What is the Estimated Valuation of the Talc Filler Masterbatch Market in 2035?
The market is expected to reach a valuation of USD 2,368 million in 2035.
What Value CAGR did the Talc Filler Masterbatch Market Exhibit Over the Last Five Years?
The historic growth rate of the talc filler masterbatch market was 6.6% from 2020-2024.