- Market Value (2025): USD 2.7 Bn
- Estimated Value (2026): USD 2.9 Bn
- Forecast Value (2036): USD 5.7 Bn
- CAGR (2026-2036): 7.2%
What is the Texture Portfolio Expansions Market forecast to be worth by 2036?
USD 2.9 billion in 2026 to USD 5.7 billion by 2036 at a 7.2% CAGR.
- The Texture Portfolio Expansions Market reached USD 2.7 billion in 2025.
- Demand is projected to increase from USD 2.9 billion in 2026 to USD 5.7 billion by 2036.
- The market is forecast to record 7.2% CAGR from 2026 to 2036 as suppliers broaden functional ingredient platforms around texture, clean-label reformulation and application-specific support.
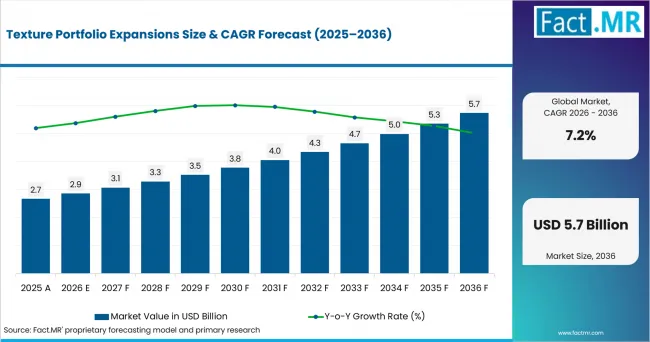
Texture Portfolio Expansions Value Analysis | Source: Fact.MR
What are the defining numbers behind Texture Portfolio Expansions Market growth?
An absolute opportunity of USD 2.9 billion is expected between 2026 and 2036.
- Demand Drivers in the Market
- Food manufacturers are asking texture systems to do more than thicken. Reformulation programs increasingly combine mouthfeel, suspension, emulsion stability, fat or sugar reduction, process resilience and label simplification in the same project.
- Portfolio breadth matters because food texturizing agents sit across emulsification, stabilization, binding, thickening and gelling roles. A supplier that can combine those functions can reduce the number of separate qualification tracks required by a customer.
- Ingredion used IFT FIRST 2026 to emphasize clean label, texture experience, protein and fiber fortification and sugar reduction together, illustrating how portfolio expansion is being tied to multi-objective formulation rather than a single ingredient claim.
- IFF markets hydrocolloids and system blends across beverages, dairy, bakery, confectionery and culinary applications. Cargill extends label-friendly native starches into dairy alternatives, sauces and ready meals, while Kerry positions texture systems around label simplification and process performance.
- Key Segments Analyzed
- By Texture Platform: Hydrocolloid systems are expected to hold 28.0% share in 2026 because gums and cellulosic systems can address viscosity, suspension, gel structure and mouthfeel across multiple food matrices.
- By Portfolio Expansion Route: Internal formulation development is projected to account for 34.0% share in 2026 as application laboratories extend existing ingredient platforms without waiting for corporate transactions or external licensing.
- By Target Food Matrix: Dairy & alternatives are anticipated to capture 24.0% share in 2026 owing to repeated needs for creaminess, suspension, emulsion stability and phase control in conventional and plant-based formats.
- By Value Proposition: Clean-label texture is estimated to represent 29.0% share in 2026 as manufacturers seek familiar ingredient declarations without giving up shelf stability or processing functionality.
- Analyst Opinion at Fact.MR
- Shambhu Nath Jha, Principal Consultant at Fact.MR, states, "Texture portfolios are expanding because customers no longer evaluate a gum, starch, fiber or emulsifier in isolation. They evaluate whether the supplier can get a formulation through pilot scale, protect sensory quality and make the economics work. The strongest competitive position comes from combining ingredient breadth with application science, then giving local teams enough flexibility to adapt the system to the food matrix."
- Strategic Implications
- Ingredient suppliers should organize development around formulation jobs such as creaminess, suspension, bake stability and cost-in-use rather than around ingredient chemistry alone.
- Application laboratories should keep benchmark recipes for dairy alternatives, bakery, sauces and confectionery so new portfolio additions can be compared against established performance quickly.
- M&A integration teams should prioritize cross-selling rules, technical training and duplicate-SKU decisions early. A broader portfolio creates value only when customer-facing teams understand which technologies can be combined.
- Regional commercial teams should localize line extensions around available raw materials, labeling expectations and processing conditions instead of launching identical product sets in every market.
France is expected to record 8.7% CAGR through 2036, supported by a broad food-processing base and frequent formulation needs across dairy, bakery, sauces and confectionery. Germany is projected to post 7.5% CAGR as export-oriented processors seek process-tolerant systems and technical support. The UK is anticipated to advance at 7.1% CAGR, supported by the scale of food manufacturing and continued cost-in-use reformulation. Italy is estimated to reach 6.0% CAGR as food, beverage and confectionery producers widen differentiated product lines. The USA is forecast to record 5.6% CAGR, reflecting a large mature manufacturing base where growth is driven by reformulation depth rather than first-time adoption.
How does the Texture Portfolio Expansions Market break down by segment?
Hydrocolloid systems lead Texture Platform at 28.0%; internal formulation development leads Portfolio Expansion Route at 34.00%; dairy & alternatives lead Target Food Matrix at 24.00%; and clean-label texture leads Value Proposition at 29.00% in 2026.
Which Texture Platform dominates?
Hydrocolloid systems are expected to hold 28.0% share in 2026.
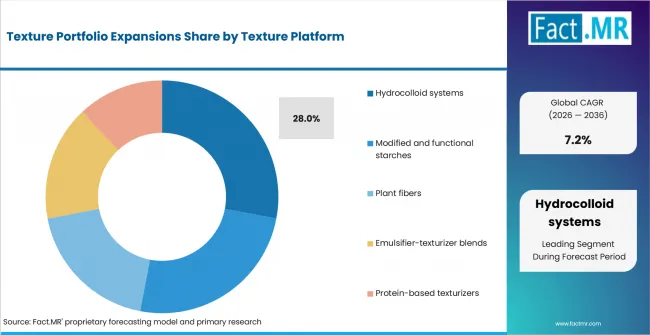
Texture Portfolio Expansions Analysis By Texture Platform | Source: Fact.MR
Hydrocolloid systems lead because gum hydrocolloids can thicken, gel, suspend, stabilize emulsions and manage water across food matrices with very different process conditions. IFF lists cellulosics, seaweed-derived hydrocolloids, guar, locust bean gum and pectin across beverage, dairy, bakery and confectionery uses, showing why a broad gum platform can support many customer briefs.
Modified and functional starches follow at 25.0% share, with modified starch technologies valued for viscosity, shear tolerance, freeze-thaw behavior and process economics. Plant fibers account for 19.00%, emulsifier-texturizer blends for 16.0%, and protein-based texturizers for 12.00%. The mix indicates that portfolio expansion is broadening beyond single-technology texture families.
What leads Portfolio Expansion Route?
Internal formulation development is projected to account for 34.0% share in 2026.
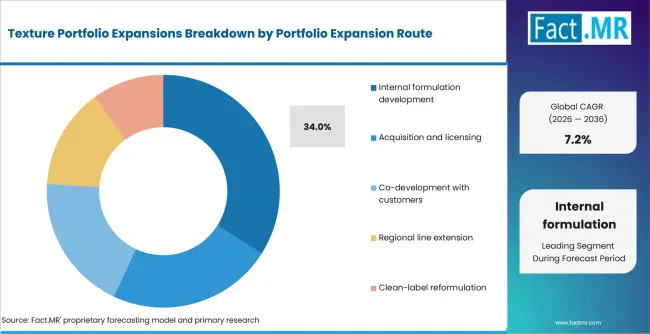
Texture Portfolio Expansions Analysis By Portfolio Expansion Route | Source: Fact.MR
Internal development leads because suppliers can extend an existing starch, gum, fiber or protein platform through new grades, blends and application protocols without the integration work that follows an acquisition. Ingredion describes a continually expanding portfolio spanning starch-based texturizers, hydrocolloids, clean and simple ingredients and plant-based proteins, supported by formulation and manufacturing expertise.
Acquisition and licensing hold 23.0% share, reflecting the value of buying complementary technology when internal development would take too long. Co-development with customers accounts for 19.0%, regional line extension for 14.0%, and clean-label reformulation for 10.0%. These routes often overlap operationally: an acquired technology may be adapted in an application lab before receiving a regional line extension.
How does Target Food Matrix shape demand?
Dairy & alternatives are anticipated to capture 24.0% share in 2026.
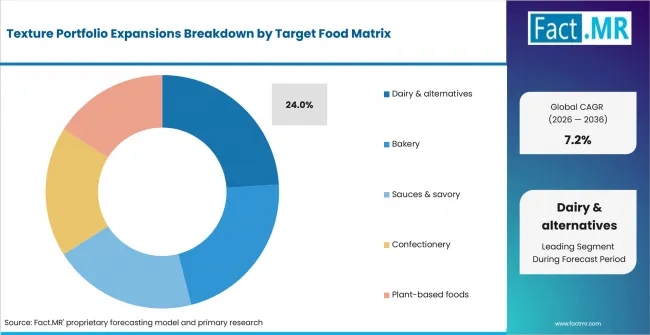
Texture Portfolio Expansions Analysis By Target Food Matrix | Source: Fact.MR
Dairy and plant-based dairy alternatives lead because they expose texture failures quickly. Formulators must control suspension, syneresis, creaminess, body, foam behavior and heat stability while sometimes reducing sugar or fat. IFF positions hydrocolloids and system blends across dairy for phase control and mouthfeel, while Cargill markets label-friendly functional native starches for dairy and dairy alternatives with viscosity and cold-storage stability.
Bakery follows at 22.0%, sauces & savory at 20.0%, confectionery at 18.0%, and plant-based foods at 16.0%. Bakery requires dough handling and moisture management; sauces need emulsion and viscosity control; confectionery relies on gel and chew design; and plant-based foods often need texture build-back after animal-derived components are removed.
What supports clean-label texture within Value Proposition?
Clean-label texture is estimated to represent 29.0% share in 2026.
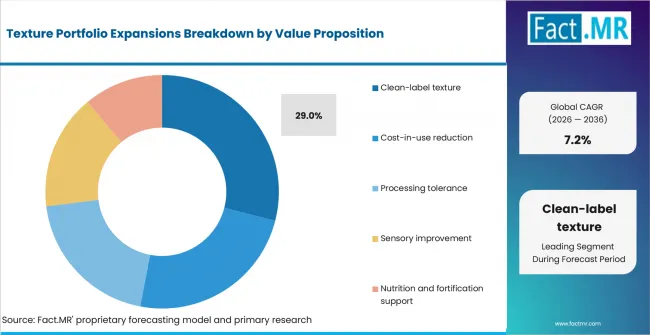
Texture Portfolio Expansions Analysis By Value Proposition | Source: Fact.MR
Clean-label texture leads because the formulation challenge is no longer simply to remove an ingredient. Manufacturers need replacement systems that keep viscosity, structure, sensory quality and shelf stability close to the original product. Cargill positions SimPure functional native starches around label-friendly functionality, while Kerry developed Puremul as a label-friendly texture system for applications including bakery and plant-based beverages.
Cost-in-use reduction accounts for 24.0% share, processing tolerance for 20.0%, sensory improvement for 16.0%, and nutrition and fortification support for 11.0%. The economics increasingly depend on system-level performance: food emulsifiers and texturizers are evaluated by dosage, process yield, waste, reformulation time and the ability to avoid quality failures, not simply by price per kilogram.
What is accelerating Texture Portfolio Expansions Market adoption, and what is holding it back?
Multi-function reformulation and broader application support are accelerating adoption. Qualification time, portfolio overlap and raw-material variability can slow commercial conversion.
Drivers Impact Analysis
| DRIVER | (~) % IMPACT ON CAGR | GEOGRAPHIC RELEVANCE | IMPACT TIMELINE |
|---|---|---|---|
| Clean-label reformulation across gums, starches and fibers | +1.2% | Global | Short term (<= 2 years) |
| Multi-platform texture engineering in dairy, bakery and savory | +1.0% | North America, Western Europe | Medium term (2-4 years) |
| Cost-in-use and processing-tolerance programs | +0.8% | USA, Germany, UK | Short term (<= 2 years) |
| Portfolio consolidation and cross-selling after acquisitions | +0.7% | Western Europe, North America | Medium term (2-4 years) |
Opportunity Impact Analysis
| OPPORTUNITY | (~) % IMPACT ON CAGR | GEOGRAPHIC RELEVANCE | IMPACT TIMELINE |
|---|---|---|---|
| Customer co-development through application laboratories | +0.8% | USA, Germany, France | Short term (<= 2 years) |
| Texture build-back for plant-based and reduced-fat foods | +0.7% | North America, Western Europe | Medium term (2-4 years) |
| Regional line extensions using existing technology platforms | +0.5% | Europe, North America | Medium term (2-4 years) |
Restraints Impact Analysis
| RESTRAINT | (~) % IMPACT ON CAGR | GEOGRAPHIC RELEVANCE | IMPACT TIMELINE |
|---|---|---|---|
| Qualification burden across recipes and process conditions | -0.5% | Global | Short term (<= 2 years) |
| Portfolio overlap and SKU rationalization after M&A | -0.4% | Western Europe, North America | Medium term (2-4 years) |
| Raw-material variability for gums, fibers and starches | -0.3% | Global | Medium term (2-4 years) |
Which countries are scaling the Texture Portfolio Expansions Market?
France records the fastest CAGR among the listed markets, followed by Germany, the UK, Italy and the USA. Growth rates reflect differences in food-manufacturing structure, formulation intensity, export activity and the pace at which suppliers can convert portfolio breadth into customer projects.
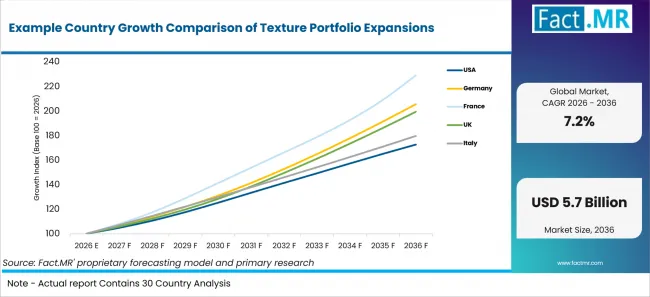
Example Country Growth Comparison Of Texture Portfolio Expansions | Source: Fact.MR
| Country | CAGR (2026-2036) |
|---|---|
| USA | 5.6% |
| Germany | 7.5% |
| France | 8.7% |
| UK | 7.1% |
| Italy | 6.0% |
What is driving the USA's growth through 2036?
The USA is forecast to record a 5.6% CAGR through 2036.
The country's food-manufacturing base creates a steady need for reformulation across bakery, dairy, beverages, sauces, prepared foods and nutrition products. The Bureau of Labor Statistics reported about 1.764 million employees in food manufacturing in July 2026, indicating the scale of the production base available to ingredient suppliers.
Demand is increasingly tied to reformulation depth. Manufacturers are working on label simplification, protein or fiber enrichment and sugar reduction while trying to preserve expected mouthfeel. This creates opportunities for suppliers able to work across starches, gums, fibers and proteins within the same development program. Ingredion highlighted the combination of texture, clean label and positive nutrition at IFT FIRST 2026.
What is driving Germany's growth through 2036?
Germany is projected to post a 7.5% CAGR from 2026 to 2036.
Its food-processing sector combines domestic production with meaningful export activity. Destatis reported food-industry exports of EUR 8.995 billion in March 2026, compared with EUR 8.272 billion in February. For manufacturers serving several markets, texture systems must perform consistently across production batches and distribution conditions.
This supports demand for process-tolerant starch and gum systems, particularly where manufacturers are reformulating established products. Suppliers with broader texture portfolios can also support different requirements across bakery, dairy and savory production without forcing customers to qualify a completely separate ingredient partner for each application.
What is driving France's growth through 2036?
France is expected to record an 8.7% CAGR through 2036.
The French food-processing sector gives texture suppliers a wide range of formulation opportunities. The Ministry of Agriculture reports more than 19,000 food-processing enterprises and nearly 465,000 employees, with the sector transforming about 70% of French agricultural production.
That diversity creates demand across dairy, bakery, confectionery, sauces and prepared foods, where texture requirements differ considerably by process and final product. Suppliers that can adapt systems to different production scales and sensory targets are better positioned to support reformulation without materially changing familiar eating characteristics.
Clean-label texture systems also have room to expand where manufacturers want shorter ingredient declarations but still need stability, viscosity or mouthfeel to remain consistent.
What is driving the UK's growth through 2036?
The UK is anticipated to grow at a 7.1% CAGR between 2026 and 2036.
Food remains a significant part of UK manufacturing. The Office for National Statistics reported that food manufacturing represented 22.9% of total UK manufacturers' product sales in 2025. This production base sustains demand for texture systems used to manage processing behavior, shelf stability and sensory performance across retail foods.
Cost-in-use reformulation is an important part of the opportunity. When ingredient prices change, manufacturers often need to adjust formulations without rebuilding the complete recipe. Flexible starch, gum and blended texture systems can help maintain viscosity or mouthfeel while accommodating those substitutions.
Clean-label solutions can gain further traction where manufacturers want more familiar ingredient declarations without sacrificing process tolerance.
What is driving Italy's growth through 2036?
Italy is estimated to record a 6.0% CAGR through 2036.
The country's agri-food industry combines established product traditions with industrial-scale manufacturing. Istat reported EUR 89 billion in agri-food value added in 2025, up from EUR 83.4 billion in 2024, while output volume in the food, beverage and tobacco industry increased 1.4%.
For texture suppliers, this creates demand across dairy, bakery, confectionery, sauces and prepared foods where manufacturers often need to improve processing performance without changing the expected sensory identity of the product.
Portfolio expansion in Italy is therefore likely to remain application-led. Suppliers can support regional line extensions and product reformulation by adjusting mouthfeel or stability while preserving familiar product characteristics. Clean-label systems are particularly relevant where ingredient changes must remain compatible with traditional or premium positioning.
Who leads the Texture Portfolio Expansions Market?
Ingredion, IFF, Cargill, Kerry Group and Tate & Lyle are among the major participants in texture portfolio expansion across hydrocolloids, starches, fibers, proteins, emulsifier systems and application-led blends.
Ingredion combines starch-based texturizers, hydrocolloids, clean-label ingredients and plant-based proteins with application support. Its July 2026 IFT FIRST program emphasized texture experience alongside clean label, protein and fiber fortification and sugar reduction. IFF operates a broad hydrocolloid and texturant portfolio and system blends across beverage, dairy, bakery, confectionery and culinary applications.
Cargill participates through starches and label-friendly texture systems such as SimPure, including products for dairy alternatives, sauces and ready meals. Kerry Group combines texturants with taste and nutrition expertise; Puremul is one example of a label-friendly texture system designed to replace selected emulsification functionality across bakery and plant-based beverage applications.
CP Kelco is no longer a standalone corporate participant. Tate & Lyle completed the acquisition of CP Kelco in November 2024 and reported the integration complete in May 2026. The combination brought pectin and specialty gums together with Tate & Lyle's specialty starches, broadening its mouthfeel platform and cross-selling potential.
Ingredion and Tate & Lyle remain separate businesses as of September 2026. Their recommended transaction was announced in June 2026 and approved by Tate & Lyle shareholders in July, but completion remains subject to remaining conditions. Tate & Lyle has indicated that the transaction is expected to become effective during the second half of 2027.
Which companies are the key providers?
Key companies include Ingredion; IFF; CP Kelco, now part of Tate & Lyle; Cargill; Tate & Lyle; and Kerry Group.
- Ingredion
- IFF
- CP Kelco (part of Tate & Lyle)
- Cargill
- Tate & Lyle
- Kerry Group
Bibliography
- U.S. Bureau of Labor Statistics. (2026, August). Food Manufacturing: NAICS 311.
- Office for National Statistics. (2026, July 24). UK manufacturers' sales by product: 2025.
- Ministère de l’Agriculture, de l’Agro-alimentaire et de la Souveraineté alimentaire. (2026, February 20). Industries agroalimentaires: les chiffres et indicateurs clés 2026.
- Ministère de l’Agriculture, de l’Agro-alimentaire et de la Souveraineté alimentaire. (2026). Entreprises agroalimentaires.
- Statistisches Bundesamt (Destatis). (2026, May). Exports by commodity groups.
- Istat. (2026, June 12). Economic accounts for agriculture - Year 2025.
- Ingredion Incorporated. (2026, July 6). Ingredion to Spotlight Next-Generation Solutions for Texture, Clean Labels and Positive Nutrition at IFT FIRST 2026.
- Ingredion Incorporated. (2026). Customized Solutions.
- International Flavors & Fragrances Inc.. (2026). Hydrocolloids & Texturants.
- International Flavors & Fragrances Inc.. (2026). Food Ingredients: System Blends.
- Cargill, Incorporated. (2026). SimPure Label-Friendly Functional Native Starch.
- Kerry Group plc. (2022, September 7). Kerry Introduces Puremul - a New Texture System.
- Tate & Lyle PLC. (2024, November 15). Completion of Combination of Tate & Lyle and CP Kelco.
- Tate & Lyle PLC. (2026, May 21). Results for the Year Ended 31 March 2026.
- Tate & Lyle PLC. (2026, June 8). Recommended Acquisition of Tate & Lyle PLC by Ingredion Incorporated.
- Tate & Lyle PLC. (2026, July 28). Recommended Cash Acquisition by Ingredion Incorporated - Results of Shareholder Meetings.
This Report Answers
- The report explains how portfolio expansion changes competition across texture systems, starches, hydrocolloids, fibers, protein texturizers and blended solutions.
- Segment analysis identifies the leading 2026 positions across Texture Platform, Portfolio Expansion Route, Target Food Matrix and Value Proposition.
- Country analysis examines the USA, Germany, France, the UK and Italy and the manufacturing conditions supporting their projected growth through 2036.
- Competitive analysis reviews current texture participants and reflects CP Kelco within Tate & Lyle following the completed acquisition, while keeping the pending Ingredion and Tate & Lyle transaction separate until completion.
- Application analysis examines dairy & alternatives, bakery, sauces & savory, confectionery and plant-based foods with attention to clean-label texture, processing tolerance and cost-in-use.
What does the Texture Portfolio Expansions Market cover?
The Texture Portfolio Expansions Market covers commercial activity tied to newly introduced or materially broadened ingredient lines whose primary role is to create, modify or preserve food texture. It includes hydrocolloid systems, modified and functional starches, plant fibers, emulsifier-texturizer blends and protein-based texturizers.
The assessment focuses on portfolio additions that create a new formulation route, extend an existing texture technology into additional food matrices, add a materially different label or processing proposition, or combine technologies through acquisition, licensing or customer co-development.
What is included in the scope?
The scope includes texture products and systems introduced through internal formulation development, acquisition and licensing, customer co-development, regional line extensions and clean-label reformulation. It includes commercial programs where the expanded offering is intended to improve viscosity, mouthfeel, emulsion stability, suspension, water management, structure or process tolerance.
Food-matrix coverage includes dairy & alternatives, bakery, sauces & savory, confectionery and plant-based foods. Value propositions include clean-label texture, cost-in-use reduction, processing tolerance, sensory improvement and support for nutrition or fortification objectives where texture remains a material part of the formulation.
What is excluded from the scope?
The scope excludes unchanged legacy ingredient revenue where no material portfolio expansion has occurred. It also excludes the transaction value of acquisitions themselves, finished food and beverage sales, processing equipment, software and unrelated ingredients whose main role is flavor, color or sweetness rather than texture.
Standalone proteins, fibers, starches or emulsifiers are outside the scope when they are sold without a material texture proposition. Industrial rheology products used outside food and beverage applications are also excluded unless they form part of a food-texture portfolio expansion.
How Was the Analysis Built?
The analysis draws on 120+ public records, 35+ company portfolios, 25+ countries, and more than 20 industry interviews.
- Primary Research: Primary research includes discussions with ingredient manufacturers, application scientists, distributors, food processors, procurement teams and subject-matter experts. These conversations examine formulation priorities, qualification cycles, portfolio adoption, technical support, pricing logic, competitive positioning and the practical barriers that determine whether a new texture system moves into commercial production.
- Desk Research: Desk research covers government statistics, regulatory publications, company filings, technical literature, product information, trade indicators, industry associations, standards and public policy. The bibliography documents the principal public references used to support market interpretation.
- Market Sizing and Forecasting: Market estimates combine historical performance, food-manufacturing activity, segment shares, country growth, application requirements, product-launch activity, acquisition integration, customer co-development patterns and barriers to broader adoption.
- Data Validation and Update Cycle: Findings are validated by comparing primary interviews with public indicators, company activity, portfolio changes, acquisitions, product launches and manufacturing trends. Regular updates review corporate-status changes, new technology combinations, regional line extensions and shifts in commercial adoption.
What is the report's scope and coverage?
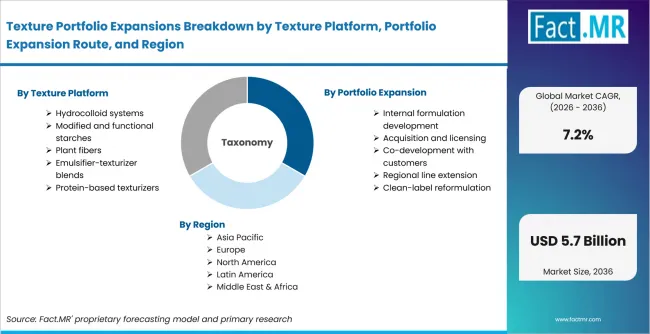
Texture Portfolio Expansions Breakdown By Texture Platform, Portfolio Expansion Route, And Region | Source: Fact.MR
| Attribute | Details |
|---|---|
| Quantitative Units | USD 2.9 billion in 2026 to USD 5.7 billion by 2036 at a 7.2% CAGR |
| Market Definition | Commercial value associated with newly introduced or materially broadened food-texture ingredient portfolios and application systems used to modify mouthfeel, viscosity, structure, stability or process behavior. |
| Texture Platform | Hydrocolloid systems; Modified and functional starches; Plant fibers; Emulsifier-texturizer blends; Protein-based texturizers |
| Portfolio Expansion Route | Internal formulation development; Acquisition and licensing; Co-development with customers; Regional line extension; Clean-label reformulation |
| Target Food Matrix | Dairy & alternatives; Bakery; Sauces & savory; Confectionery; Plant-based foods |
| Value Proposition | Clean-label texture; Cost-in-use reduction; Processing tolerance; Sensory improvement; Nutrition and fortification support |
| Regions Covered | North America; Latin America; Western Europe; Eastern Europe; East Asia; South Asia & Pacific; Middle East & Africa |
| Countries Covered | USA; Germany; France; UK; Italy |
| Key Companies | Ingredion; IFF; CP Kelco (part of Tate & Lyle); Cargill; Tate & Lyle; Kerry Group |
| Forecast Period | 2026 to 2036 |
| Approach | Supplier and demand assessment using manufacturing scale, portfolio mapping, launches, M&A integration, country indicators and primary interviews. |
How is the market segmented?
-
By Texture Platform
- Hydrocolloid systems
- Modified and functional starches
- Plant fibers
- Emulsifier-texturizer blends
- Protein-based texturizers
-
By Portfolio Expansion Route
- Internal formulation development
- Acquisition and licensing
- Co-development with customers
- Regional line extension
- Clean-label reformulation
-
By Target Food Matrix
- Dairy & alternatives
- Bakery
- Sauces & savory
- Confectionery
- Plant-based foods
-
By Value Proposition
- Clean-label texture
- Cost-in-use reduction
- Processing tolerance
- Sensory improvement
- Nutrition and fortification support
-
By Region
- North America
- Latin America
- Western Europe
- Eastern Europe
- East Asia
- South Asia & Pacific
- Middle East & Africa