- Market Value (2025): USD 187.4 Bn
- Estimated Value (2026): USD 205.7 Bn
- Forecast Value (2036): USD 523.8 Bn
- CAGR (2026-2036): 9.8%
What is the Ultra Efficient Solar Power Market forecast to be worth by 2036?
USD 205.7 billion in 2026 to USD 523.8 billion by 2036, at a CAGR of 9.8%.
- As per Fact.MR analysis, the ultra efficient solar power market was valued at USD 187.4 billion in 2025.
- Demand will grow from USD 205.7 billion in 2026 to USD 523.8 billion by 2036.
- The forecast records a 9.8% CAGR from 2026 to 2036 supported by expansion of global solar power installations
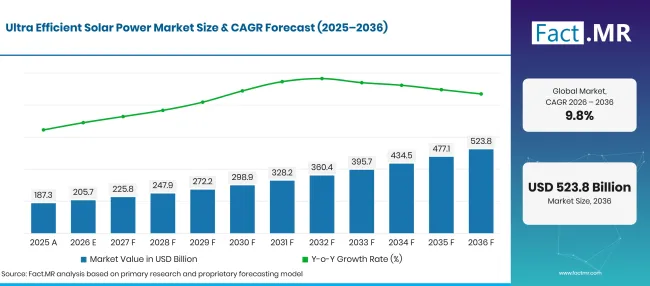
Ultra Efficient Solar Power Market Forecast Global | Source: Fact.MR
| Year | Basis | Market Value (USD billion) |
|---|---|---|
| 2025 | Actual | 187.4 |
| 2026 | Estimate | 205.7 |
| 2036 | Forecast | 523.8 |
| CAGR 2026 to 2036 | Forecast period | 9.8% |
Source: Fact.MR analysis. Updated Nov 6, 2026
What are the defining numbers behind Ultra Efficient Solar Power Market growth?
USD 318.1 billion absolute opportunity between 2026 and 2036.
- Demand Drivers in the Market
- Solar power capacity additions are increasing the addressable market for high-efficiency modules and related equipment. The IEA reported that global solar PV capacity additions exceeded 600 GW in 2025, taking cumulative installed capacity to around 2,800 GW [1].
- Efficiency improvements are encouraging developers to assess module output alongside land requirements and lifetime electricity generation. JinkoSolar's Tiger Neo 3.0 modules offer up to 24.8% module efficiency, while Trina Solar's Vertex N range offers module efficiencies of up to 23.2% [2] [3].
- Rooftop solar installations are expanding market opportunities beyond utility-scale projects by increasing adoption among residential and commercial electricity users. The UK recorded approximately 269,000 solar installations in 2025, marking its highest annual total at the time [4]. This growth highlights rising interest in distributed solar generation. Higher-efficiency panels can help property owners maximize electricity output from limited rooftop space while reducing dependence on grid electricity.
- Key Segments Analyzed
- By Technology: Photovoltaic systems will account for 87.4% of the market in 2026, reflecting the extensive deployment of solar PV across residential and utility-scale projects.
- By Application: Residential applications hold a 41.8% share in 2026, supported by rooftop installations and household interest in self-generation.
- By Component: Solar panels represent 47.8% of the market in 2026, as photovoltaic modules form the core electricity-generating component of PV systems.
- By Installation Type: Rooftop installations segment leads with 60.1% share in 2026, driven by demand from homes and commercial buildings.
- Analyst Opinion at Fact.MR
- Shambhu Nath Jha, Principal Consultant at Fact.MR, states, “The next phase of solar expansion will depend on more than adding generation capacity. Developers will increasingly assess module efficiency, system reliability and storage compatibility when selecting equipment. Suppliers that demonstrate dependable energy output over the operating life of an installation can strengthen their position across residential and utility-scale projects.”
- Strategic Implications
- Module manufacturers should demonstrate real-world energy yield and degradation performance alongside rated conversion efficiency.
- Project developers need to compare lifetime electricity generation and total system costs rather than selecting equipment solely on initial module price.
- Inverter and battery suppliers must improve compatibility with high-output PV systems and support effective energy management.
- Installers should assess roof condition, shading, orientation and local grid requirements before recommending rooftop systems.
- Utility-scale developers can evaluate land use, grid connection capacity and storage requirements during project planning.
Germany is projected to record an 11.3% CAGR through 2036. Brazil is set to post 10.3%, followed by the USA at 9.3%. The UK is estimated to advance at 8.3%, while Japan is forecast to grow at 7.4%.
How does the Ultra Efficient Solar Power Market break down by segment?
Fact.MR finds that Photovoltaic technology leads the Technology segment at 87.4%; Residential applications lead the Application segment at 41.8%; Solar Panels lead the Component segment at 47.8%; and Rooftop installations lead the Installation Type segment at 60.1%.
Which Technology dominates?
Photovoltaic technology is set to hold an 87.4% share in 2026.
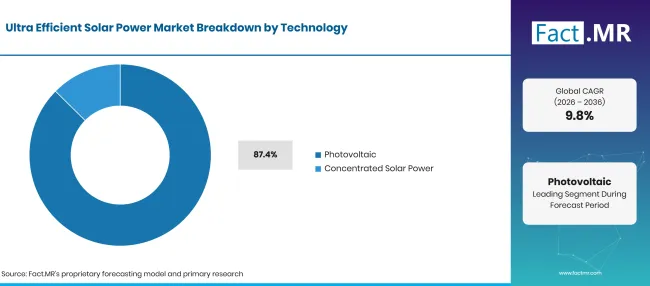
Ultra Efficient Solar Power Market Breakdown Technology | Source: Fact.MR
| Technology | Share (2026) |
|---|---|
| Photovoltaic (Leading segment) | 87.4% |
| Concentrated Solar Power | 12.6%* |
| Total | 100.0% |
Source: Fact.MR analysis. Updated Nov 6, 2026
Photovoltaic systems dominate because they can be deployed across residential rooftops, commercial properties and large ground-mounted solar farms. Improvements in cell architecture and module design help increase electricity output from a given installation area. Concentrated solar power serves a different project requirement by using mirrors or lenses to concentrate sunlight and generate heat for electricity production. Its potential integration with thermal energy storage supports dispatchable generation.
Which Application leads the market?
Residential applications are set to represent 41.8% of the market in 2026.
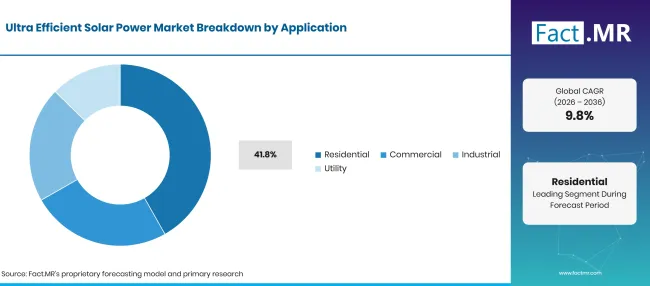
Ultra Efficient Solar Power Market Breakdown Application | Source: Fact.MR
| Application | Share (2026) |
|---|---|
| Residential (Leading segment) | 41.8% |
| Other segments combined | 58.2%* |
| Total | 100.0% |
Source: Fact.MR analysis. Updated Nov 6, 2026
Residential demand is supported by household rooftop systems that can reduce dependence on grid electricity and improve control over energy expenses. Adoption depends on installation costs, roof suitability, local electricity tariffs and access to financing. Commercial and industrial users assess solar installations against operating hours and electricity consumption profiles. Utility-scale projects depend more heavily on land availability, grid connections and power purchase arrangements.
What leads the Component segment?
Solar Panels are likely to account for 47.8% of the market in 2026.
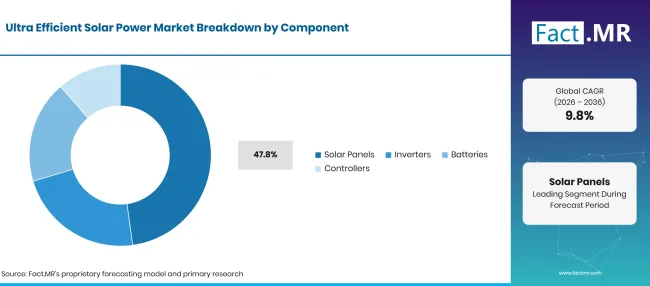
Ultra Efficient Solar Power Market Breakdown Component | Source: Fact.MR
| Component | Share (2026) |
|---|---|
| Solar Panels (Leading segment) | 47.8% |
| Other segments combined | 52.2%* |
| Total | 100.0% |
Source: Fact.MR analysis. Updated Nov 6, 2026
Solar panels represent the principal electricity-generating equipment in photovoltaic installations. Manufacturers are developing TOPCon, heterojunction and other advanced cell technologies to improve conversion efficiency and energy yield. Inverters convert the direct current generated by PV modules into usable alternating current. Batteries store surplus electricity for later consumption, while controllers manage charging and system operation. The relative value of these components varies by system configuration and whether storage is included.
How does Installation Type shape demand?
Rooftop installations are expected to account for 60.1% of the market in 2026.
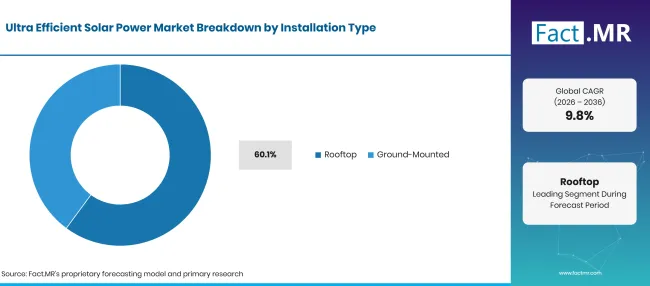
Ultra Efficient Solar Power Market Breakdown Installation Type | Source: Fact.MR
| Installation Type | Share (2026) |
| Rooftop (Leading segment) | 60.1% |
| Ground-Mounted | 39.9%* |
| Total | 100.0% |
Source: Fact.MR analysis. Updated Nov 6, 2026
Rooftop systems make use of existing building space and are commonly selected by households and commercial property owners seeking on-site electricity generation. Their suitability depends on roof structure, orientation, shading and available installation area. Ground-mounted projects can accommodate larger module arrays and are widely used for utility-scale generation. These projects require land access and suitable grid infrastructure, while their economics depend on site conditions and power offtake arrangements.
What is accelerating Ultra Efficient Solar Power Market adoption, and what is holding it back?
Higher module efficiency and expanding solar installations support demand, while grid constraints and project economics can slow deployment.
Drivers Impact Analysis
| DRIVER | (~) % IMPACT ON CAGR | GEOGRAPHIC RELEVANCE | IMPACT TIMELINE |
|---|---|---|---|
| Rising global photovoltaic installations | +1.2% | Global | Short term (≤ 2 years) |
| Adoption of high-efficiency solar modules | +0.9% | Asia, Europe, Americas | Medium term (2–4 years) |
| Residential and commercial rooftop deployment | +0.8% | Europe, Asia, Americas | Short term (≤ 2 years) |
| Expansion of utility-scale solar projects | +0.7% | Global | Medium term (2–4 years) |
| Integration of battery storage with solar systems | +0.6% | Global | Long term (≥ 4 years) |
Source: Fact.MR analysis. Updated Nov 6, 2026
Opportunity Impact Analysis
| OPPORTUNITY | (~) % IMPACT ON CAGR | GEOGRAPHIC RELEVANCE | IMPACT TIMELINE |
|---|---|---|---|
| Development of higher-efficiency TOPCon and HJT modules | +0.9% | Asia, Europe, Americas | Medium term (2–4 years) |
| Solar-plus-storage installations | +0.8% | Global | Long term (≥ 4 years) |
| Commercial and industrial rooftop projects | +0.6% | Europe, Asia | Medium term (2–4 years) |
| Repowering of older solar installations | +0.5% | Europe, USA, Japan | Long term (≥ 4 years) |
| Expansion of distributed solar in emerging markets | +0.5% | Latin America, Asia | Medium term (2–4 years) |
Source: Fact.MR analysis. Updated Nov 6, 2026
Restraints Impact Analysis
| RESTRAINT | (~) % IMPACT ON CAGR | GEOGRAPHIC RELEVANCE | IMPACT TIMELINE |
|---|---|---|---|
| Grid connection and transmission constraints | -0.9% | Global | Short term (≤ 2 years) |
| High initial installation and storage costs | -0.7% | Emerging markets, Europe | Short term (≤ 2 years) |
| Intermittent generation and storage requirements | -0.6% | Global | Medium term (2–4 years) |
| Policy and incentive uncertainty | -0.5% | USA, Europe, Asia | Short term (≤ 2 years) |
| Land and permitting limitations for large projects | -0.4% | Europe, Japan, Americas | Medium term (2–4 years) |
Source: Fact.MR analysis. Updated Nov 6, 2026
Which countries are scaling the Ultra Efficient Solar Power Market through 2036?
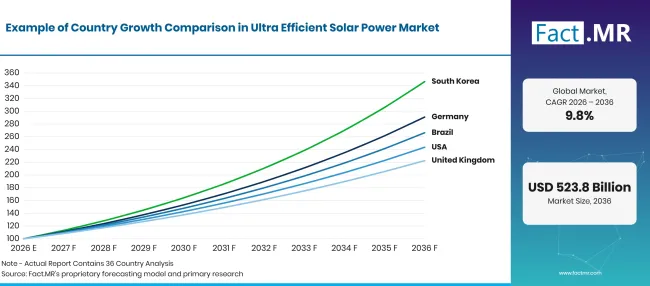
Ultra Efficient Solar Power Market Growth Index | Source: Fact.MR
| Country | CAGR (2026–2036) |
|---|---|
| Germany | 11.3% |
| Brazil | 10.3% |
| USA | 9.3% |
| UK | 8.3% |
| Japan | 7.4% |
Source: Fact.MR analysis. Updated Nov 6, 2026
What supports Germany's adoption?
11.3% CAGR, supported by continued solar capacity additions and rooftop deployment.
Germany's solar market benefits from established renewable energy infrastructure and continued investment in photovoltaic installations. The Federal Network Agency reported that installed solar capacity reached 117 GW at the end of 2025 after 16.4 GW of additions during the year [5]. Building-mounted and ground-mounted installations both contributed to expansion. High-efficiency modules can help developers improve electricity generation from available roof and land areas. Grid connections and project economics will remain important considerations as capacity expands.
How is Brazil developing solar power adoption?
10.3% CAGR, driven by strong photovoltaic capacity growth and distributed generation.
Brazil's solar market is expanding through centralized solar plants and distributed installations. The Energy Research Office reported that installed photovoltaic capacity reached 64,793 MW in 2025, representing a 33.7% increase over the previous year. Solar electricity generation also rose to 88.1 TWh [6]. Strong solar resources and growing distributed generation create opportunities for module suppliers and system integrators. Manufacturers can address this market through products suited to local climate conditions and installation requirements.
What supports United States adoption?
9.3% CAGR, shaped by utility-scale generation and residential solar deployment.
The United States continues to expand solar electricity generation across utility-scale and distributed installations. The U.S. Energy Information Administration reported that utility-scale solar generation reached 296,000 GWh in 2025, increasing 34% from 2024. Small-scale solar generation reached another 93,000 GWh [7]. Demand for high-efficiency modules is supported by the need to optimize project output and land utilization. Developers also need to consider grid interconnection and the economics of storage.
How is the United Kingdom building adoption?
8.3% CAGR, supported by record solar installations and expanding rooftop deployment.
The United Kingdom is seeing increased adoption of solar installations across residential and commercial properties. Rooftop systems are an important part of this expansion, while larger solar projects contribute to renewable electricity supply. High-efficiency modules can help property owners increase generation where available roof space is limited.
What supports Japan adoption?
7.4% CAGR, led by distributed solar systems and demand for efficient use of available space.
Japan's solar market is increasingly focused on installations that make effective use of rooftops and existing buildings. IEA PVPS reports preliminary estimates that cumulative photovoltaic capacity exceeded 100 GW in Japan in 2025, with annual installations of approximately 5.7 GW [8]. Limited land availability makes system efficiency and suitable installation design important considerations. Solar suppliers can address demand through compact high-output modules and storage-compatible systems for residential and commercial users.[8]
Who leads the Ultra Efficient Solar Power Market?
Fact.MR identifies First Solar, Canadian Solar, JinkoSolar, Trina Solar, JA Solar and Risen Energy as key companies in the competitive landscape.
Competition is shaped by module conversion efficiency, power output, degradation performance, manufacturing scale and product suitability for different installation types. First Solar differentiates itself through cadmium telluride thin-film photovoltaic modules. Canadian Solar offers TOPCon and bifacial module portfolios, while JinkoSolar competes through its Tiger Neo high-efficiency TOPCon range [9] [10].
Trina Solar's Vertex N series focuses on high-power n-type modules for utility-scale and distributed projects. JA Solar offers DeepBlue module products, including its DeepBlue 5.0 range. Risen Energy participates through its Hyper-ion heterojunction technology portfolio [11] [12].
Commercial competition also depends on warranty terms, bankability, manufacturing capacity and project-level energy yield. Suppliers need to demonstrate reliable performance under local temperature and operating conditions. Developers increasingly evaluate modules alongside inverters and battery storage to improve total system performance.
Which companies are the key providers?
Key companies include First Solar, Canadian Solar, JinkoSolar, Trina Solar, JA Solar and Risen Energy.
- First Solar
- Canadian Solar Inc.
- JinkoSolar Holding Co. Ltd.
- Trina Solar Limited
- JA Solar Technology Co. Ltd.
- Risen Energy Co. Ltd.
Bibliography
- [1] International Energy Agency. (2026). Global Energy Review 2026: Technology – Solar PV and wind.
- [2] JinkoSolar Holding Co., Ltd. (n.d.). Tiger Neo 3.0.
- [3] Trinasolar. (n.d.). Vertex N product series.
- [4] Department for Energy Security and Net Zero. (2026, May 28). Britain continues to break clean power records. GOV.UK.
- [5] Bundesnetzagentur. (2026, January 8). Growth in renewable energy in 2025.
- [6] Empresa de Pesquisa Energética. (2026). Brazilian Energy Balance 2026: Highlights.
- [7] U.S. Energy Information Administration. (2026, March 20). Wind and solar generated a record 17% of U.S. electricity in 2025.
- [8] IEA Photovoltaic Power Systems Programme. (2026). Japan: 2025 country update – Industry and market development.
- [9] First Solar, Inc. (n.d.). Series 7 – Made in America, for America.
- [10] Canadian Solar Inc. (n.d.). Modules – CSI Solar.
- [11] JA Solar Technology Co., Ltd. (n.d.). Product datasheets.
- [12] Risen Energy Co., Ltd. (n.d.). HJT Hyper-ion module.
This Report Answers
- The report examines how high-efficiency solar technologies are deployed across photovoltaic and concentrated solar power installations.
- Technology analysis compares photovoltaic systems with concentrated solar power.
- Application analysis covers residential, commercial, industrial and utility demand.
- Component analysis evaluates solar panels, inverters, batteries and controllers.
- Installation analysis compares rooftop and ground-mounted systems.
- Country analysis discusses Germany, Brazil, USA, UK and Japan alongside official solar deployment statistics.
- The competitive overview profiles major solar technology and module suppliers.
What does the Ultra Efficient Solar Power Market cover?
The market covers solar power technologies and associated equipment designed to improve electricity generation performance. It includes photovoltaic systems, which convert sunlight directly into electricity, and concentrated solar power systems, which concentrate sunlight to produce heat for power generation. Component coverage includes solar panels, inverters, batteries and controllers. The analysis tracks residential, commercial, industrial and utility applications across rooftop and ground-mounted installations.
What is included in the scope?
Included products and systems cover high-efficiency photovoltaic modules and concentrated solar power technologies.
The component boundary includes solar panels, inverters, batteries and controllers used in solar installations. The market also covers equipment deployed in residential buildings, commercial facilities, industrial sites and utility-scale projects.
What is excluded from the scope?
The analysis excludes conventional electricity generation equipment unrelated to solar power.
Wind turbines, hydropower equipment and fossil-fuel generation systems are outside the defined market. General electrical equipment without a direct role in solar power generation or system operation is also excluded. Installation services and project development revenues should remain outside the equipment market unless explicitly included in the market-sizing methodology.
How Was the Analysis Built?
The analysis draws on 120+ sources, 35+ company portfolios, 25+ countries, and more than 20 industry interviews.
- Primary Research: Primary research includes discussions with manufacturers, service providers, technology developers, distributors, end users, and subject-matter experts. These conversations examine purchasing priorities, product adoption, operational challenges, approval requirements, competitive positioning, and the factors that influence wider market acceptance.
- Desk Research: Desk research covers government statistics, regulatory publications, company filings, trade data, technical studies, industry associations, standards, public policy, and other authoritative sources. Every source used in the analysis is documented in the bibliography.
- Market Sizing and Forecasting: Market estimates combine historical performance, demand indicators, pricing and volume trends, segment shares, company participation, country-level growth, adoption patterns, investment activity, and barriers to market expansion.
- Data Validation and Update Cycle: Findings are validated by comparing primary interviews with public data, company activity, regulatory changes, trade patterns, and industry developments. Regular updates review new product launches, capacity changes, partnerships, approvals, and shifts in commercial adoption.
Segmentation
What is the report's scope and coverage?
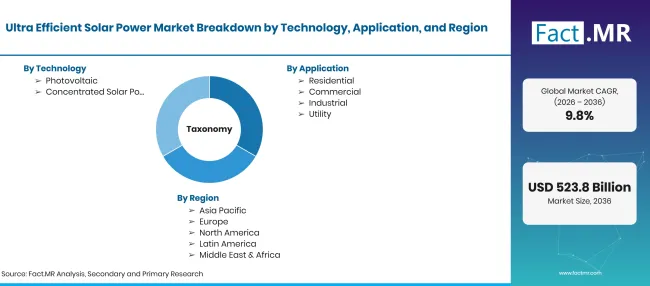
Ultra Efficient Solar Power Market Taxonomy | Source: Fact.MR
| Attribute | Details |
|---|---|
| Quantitative Units | USD billion |
| Market Definition | The ultra-efficient solar power market comprises advanced solar technologies and associated equipment designed to generate electricity with higher conversion efficiency and improved energy output. It includes high-efficiency photovoltaic modules such as TOPCon and heterojunction panels as well as emerging perovskite tandem technologies. |
| Technology | Photovoltaic; Concentrated Solar Power |
| Application | Residential; Commercial; Industrial; Utility |
| Component | Solar Panels; Inverters; Batteries; Controllers |
| Installation Type | Rooftop; Ground-Mounted |
| Regions Covered | North America; Latin America; Western Europe; Eastern Europe; East Asia; South Asia & Pacific; Middle East & Africa |
| Countries Covered | Germany; Brazil; USA; UK; Japan |
| Companies Profiled | First Solar; Canadian Solar; JinkoSolar; Trina Solar; JA Solar; Risen Energy |
| Forecast Period | 2026 to 2036 |
| Approach | Market segmentation and scenario-based analysis supported by company product portfolios and official solar deployment statistics |
Source: Fact.MR analysis. Updated Nov 6, 2026
How is the market segmented?
-
By Technology
- Photovoltaic
- Concentrated Solar Power
-
By Application
- Residential
- Commercial
- Industrial
- Utility
-
By Component
- Solar Panels
- Inverters
- Batteries
- Controllers
-
By Installation Type
- Rooftop
- Ground-Mounted
-
By Region
- North America
- Latin America
- Western Europe
- Eastern Europe
- East Asia
- South Asia & Pacific
- Middle East & Africa
Frequently Asked Questions
How big is the Ultra Efficient Solar Power Market in 2026?
What is the CAGR from 2026 to 2036?
Which technology has the largest market share?
Which application leads the market?
Which component has the largest share?
Which installation type dominates?
Which countries are covered in the report?
Which companies are covered?
Who worked on this report


Preview the report firsthand - request a free sample
Free SampleGet the brochure for pricing and purchase details
Download PDF