Solar Powered Car Market

Solar Powered Car Market Analysis, By Solar Panel, By Type, By Category, By Battery Type, and Region - Market Insights 2025 to 2035

Analysis of Solar Powered Car Market Covering 30+ Countries Including Analysis of US, Canada, UK, Germany, France, Nordics, GCC countries, Japan, Korea and many more.

Solar Powered Car Market Outlook (2025 to 2035)

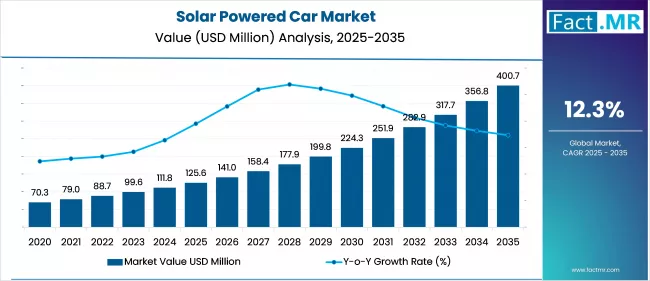
The global solar powered car market is projected to increase from USD 125.6 million in 2025 to USD 400.7 million by 2035, with a CAGR of 12.3%, driven by increasing environmental awareness, supportive government policies, and the push for sustainable transportation solutions. Their use makes them ideal for urban mobility, where integration with electric drivetrains and solar panels enhances driving range and minimizes emissions.

Solar Powered Car Market

What are the Drivers of Solar Powered Car Market?

The Solar Powered Car Market is primarily driven by rising environmental awareness among consumers and governments worldwide. Growing concerns about air pollution and greenhouse gas emissions are driving the automotive industry to pursue cleaner alternatives. Countries such as Germany and Japan, for example, are enacting stringent emission regulations, which encourage the use of solar-powered vehicles.

Electric vehicles (EVs) use rechargeable batteries or other energy storage devices to power one or more electric motors. Environmental benefits, cost savings, technological advances, energy security concerns, regulatory support, and shifting consumer preferences drive the demand for electric vehicles.

In electric vehicles, solar technology is utilized as a backup energy source; however, improvements in solar efficiency and vehicle integration may enhance its role in future automotive applications, thereby reducing dependence on charging infrastructure. In April 2024, the International Energy Agency, a France-based intergovernmental organization, reported 3.5 million electric vehicle sales in 2023, representing a 35% increase from 2022.

Consumer demand for longer driving ranges and less reliance on charging infrastructure is increasing, making Solar-Powered hybrids an appealing option. This demand is especially pronounced in urban areas with high solar exposure and few charging stations.

What are the Regional Trends of Solar Powered Car Market?

Several U.S. and Canadian solar-powered vehicle companies are driving growth in the North America market. Additionally, advancements in R&D facilities and the adoption rate of technology in North America are more significant. Therefore, increasing restrictions on the emission of hazardous gases are expected to drive the market in North America during the forecast period.

Solar-powered vehicles are gaining popularity in the APAC region due to supportive government policies and increasing environmental awareness. China, a key player in the sector, has seen a 25% increase in solar-powered vehicle sales in the last year. Japan, renowned for its emphasis on technological advancement, has witnessed a 15% increase in the production of solar panels specifically designed for integration into vehicles.

Europe is expected to account for a significant portion of the global solar-powered car market. The region's growth is attributed to the widespread adoption of solar-powered vehicles in developed countries, such as Germany, France, and the U.K. While Europe has a high rate of technological advancement, which drives market growth.

Brazil, the UAE, and other countries in the Rest of the World have solar vehicle market potential. Brazil is the largest market in this region, while the UAE is experiencing the fastest growth rate. Environmental awareness and sustainable transportation investments are rising in these markets. Government programs promoting clean energy and sustainable transportation are driving the solar-powered car market growth in these regions. These markets are experiencing increased interest from both domestic and international stakeholders in developing local solar vehicle technologies.

What are the Challenges and Restraining Factors of Solar Powered Car Market?

The limited energy generation capability of current solar panel technology poses a significant challenge in the solar-powered car market. Under ideal conditions, the energy conversion rate for high-efficiency monocrystalline panels is approximately 20%. This limits vehicles' ability to generate enough power entirely from solar energy, particularly in areas with inconsistent sunlight or during cloudy weather. Solar-powered cars, for example, are less effective in areas with low solar irradiance, such as Northern Europe.

Vehicle surface area limitations also limit solar energy generation. The small size of most vehicle roofs and hoods limits the available space for panel installation, thereby capping total energy output. Fully Solar Powered vehicles become more reliant on supplementary battery or grid charging, reducing their true independence from conventional infrastructure.

Infrastructure and policy support for solar vehicles are also lacking. While EV charging networks are expanding, there is limited dedicated support for solar-powered cars, which hinders public awareness and confidence. Furthermore, standards for solar vehicle integration and safety remain undeveloped, delaying widespread commercialization.

Country-Wise Outlook

The U.K. Solar Powered Car Market sees Growth Driven by Strong Emissions Goals

Solar Powered Car Market Cagr Analysis By Country

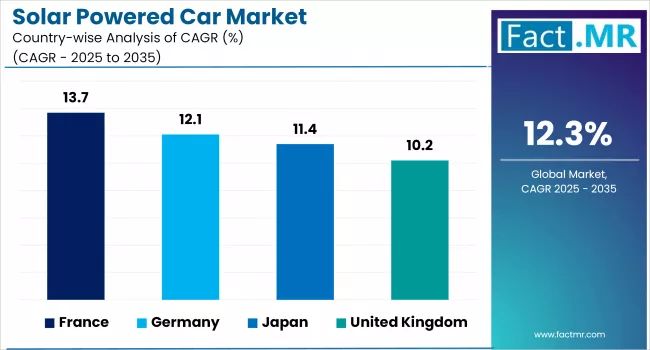
The U.K. is gradually emerging as a promising market for solar-powered vehicles, driven by the country's strong push toward net-zero emissions and the decarbonization of transportation. The U.K. government has pledged to ban the sale of new petrol and diesel vehicles by 2035, creating opportunities for alternative fuel technologies such as solar-electric vehicles. This regulatory framework promotes innovation and the adoption of electric mobility technologies.

Universities and research institutions in the U.K. are actively researching solar car technology. For instance, Cambridge University Eco Racing (CUER) has competed in international solar car competitions, demonstrating domestic innovation and raising public awareness about solar mobility. Such initiatives demonstrate a growing knowledge base and the potential for future commercialization.

The country also presents a significant opportunity for urban mobility. With over 70% of the U.K. population living in cities, there is a strong interest in small, solar-powered vehicles for short commutes and urban driving. These vehicles have the potential to reduce grid dependency and operational costs in urban fleets.

France’s Growing Embrace of Solar Integration in Electric Vehicles

France’s robust and well-developed solar energy infrastructure serves as a key driver of growth. The public is becoming increasingly accepting of solar technology as investments in solar farms and rooftop solar installations continue to rise. This favourable environment encourages automakers to investigate solar integration in electric vehicles, particularly hybrids that use solar panels to increase driving range and reduce charging frequency.

The French automotive industry, which includes global players such as Renault and PSA Group, is actively working to advance solar car technology. Collaborative research projects and government-funded innovation programs aim to improve solar cell efficiency and develop lightweight materials suitable for vehicle integration. For instance, the French government has encouraged the development of solar roof prototypes for electric vehicles, with the goal of commercializing them within the next decade.

French cities are increasingly promoting low-emission zones and incentives for electric and solar-assisted vehicles, which will help to increase the number of solar-powered cars in cities. Furthermore, the growing demand for environmentally friendly fleet vehicles among businesses represents a lucrative opportunity.

Japan’s Commitment to Clean Mobility Drives Solar Vehicle Market Growth

Japan is emerging as a major market for solar-powered vehicles, due to its strong emphasis on clean energy and sustainable transportation. The country's commitment to achieving carbon neutrality by 2050 has prompted government initiatives to promote electric vehicles (EVs) and integrate solar technology into automobile designs.

Japan's limited land area and dense urban population have led to an increased demand for small solar vehicles, specifically designed for city driving. To encourage adoption, the government provides incentives such as EV subsidies and funds research into solar cells that are more efficient and lighter weight, making them suitable for use in vehicles.

Regulatory measures also encourage clean vehicle technologies. Japan's "Next-Generation Vehicle Promotion Strategy" outlines goals for increasing the use of solar and other renewable energy sources in transportation, as well as encouraging collaboration between manufacturers and research institutions.

Opportunities in Japan's solar car market include increased consumer awareness of environmental issues and the development of smart solar materials. Japanese companies are exploring flexible, transparent solar panels that can be integrated seamlessly into car windows and roofs, enhancing both aesthetics and functionality.

Category-wise Analysis

Monocrystalline to Exhibit Leading by Solar Panel

Solar Powered Car Market Analysis By Solar Panel

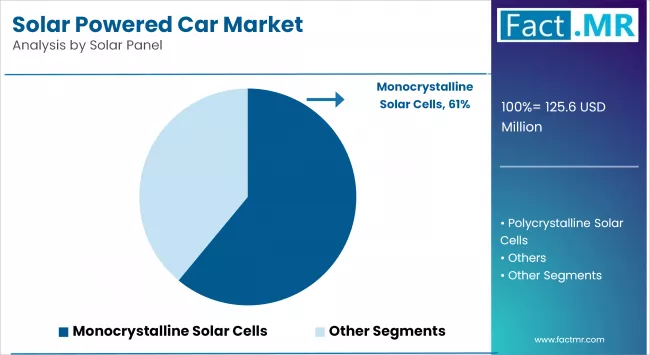
Monocrystalline solar panels are popular for use in solar electric vehicles due to their high efficiency and durability. Automotive monocrystalline solar panels are in demand due to their superior performance. Monocrystalline solar panels generate more electricity from the same sunlight due to their higher efficiency factor. Solar vehicles that require a reliable energy source should utilize monocrystalline solar panels, as they are more durable and last longer.

While monocrystalline solar panels are typically preferred for solar-powered vehicles due to their higher efficiency and durability, polycrystalline solar panels may also be appropriate depending on the vehicle's specific requirements. Polycrystalline solar panels are less expensive than monocrystalline solar panels, making them an affordable option for those looking to incorporate solar panels into their solar-powered vehicles. Although they have a lower efficiency rating than monocrystalline solar panels, they can still generate significant amounts of electricity from sunlight.

SUVs to Exhibit Leading by Type

Solar Powered Car Market Analysis By Type

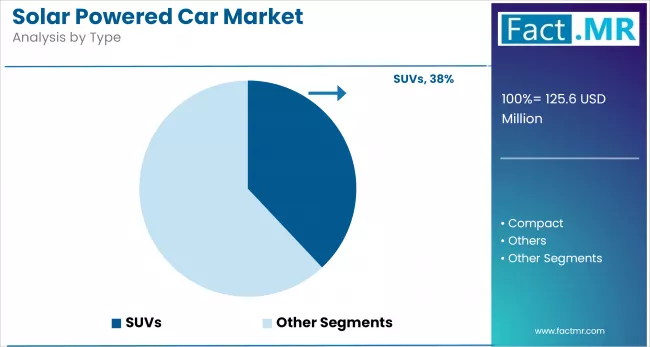
SUVs have emerged as a significant segment in the Solar Powered Car Market, owing to their growing global popularity and larger surface area, which is ideal for integrating solar panels. Their size allows for the installation of more photovoltaic cells, resulting in improved energy capture and longer driving range. As consumers demand both sustainability and practicality, Solar Powered SUVs are being promoted as viable green mobility options, particularly for family and off-road use in areas with high solar exposure.

Compact cars are also a significant segment of the solar car market, particularly in cities and emerging markets. Their lightweight design and low energy requirements make them ideal for solar-powered propulsion. These vehicles are suitable for urban commuting because they are both environmentally friendly and inexpensive to operate. Compact solar cars appeal to environmentally conscious consumers seeking low-cost, efficient transportation options, particularly in densely populated cities where charging infrastructure is limited.

Hybrid Electric Vehicles to Lead by Category

The hybrid electric vehicle (HEV) segment is the most lucrative component of the global solar vehicle market. HEVs are unique in their ability to run on a variety of fuels. Worldwide, the adoption of HEVs has been fueled by growing concerns about the deteriorating state of the environment caused by rising levels of pollutants emitted by vehicles.

The pure electric category includes vehicles that run solely on electric propulsion systems powered by energy stored in rechargeable batteries. Solar vehicles incorporate solar photovoltaic (PV) panels directly into their body surfaces, such as the roof, hood, or trunk, to harness solar energy and convert it to electricity. This energy either complements or directly charges the vehicle's lithium-ion or solid-state battery packs.

Lithium-Ion to Exhibit Lead by Battery Type

The lithium-ion segment is expected to have a positive impact on the market during the forecast period. The global demand for lithium-ion batteries is increasing as sales of electric vehicles rise. Lithium-ion batteries offer a large power storage capacity, as well as promise reliability, a long lifespan, and a long driving range. These batteries are light and compact, and they can boost the performance and efficiency of solar electric vehicles.

Lead-acid batteries are gaining traction on the market. These batteries are considered a superior option for solar power storage. Lead-acid batteries are less expensive than other types of batteries, making them a more cost-effective option for solar-powered vehicles. The growing demand for lead-acid batteries by vehicle manufacturers to build affordable cars is expected to boost demand in the segment.

Competitive Analysis

The global solar-powered car market is becoming increasingly competitive, with a mix of innovative startups, solar integration specialists, and established automotive manufacturers exploring solar-assisted mobility solutions. This dynamic environment is primarily driven by advancements in solar photovoltaic (PV) integration, lightweight materials, battery efficiency, and sustainable vehicle design, all of which are tailored to reduce carbon emissions.

Companies focusing on high-efficiency solar panels, extended driving range, and seamless battery-solar system integration are gaining a competitive edge. Startups like Lightyear, Aptera Motors, and Sono Motors are pushing the boundaries with fully solar-powered vehicle concepts, while major automakers such as Toyota, Hyundai, and Tesla are incorporating solar technologies to supplement energy needs in electric and hybrid models. The emphasis on energy independence, eco-friendly design, and next-generation charging systems continues to shape the competitive landscape in this emerging market.

Startups frequently prioritize agility and innovation, launching limited-range solar city cars for urban use. On the other hand, traditional automakers are experimenting with solar augmentation rather than full reliance, aiming to increase battery range efficiency by 5-10%.

Key players in the solar powered car industry include Hyundai Motor Company, Squad Mobility, Lightyear, Toyota Motor Corporation, Sono Motors, Aptera Motors, Ford Motor Company, Mahindra & Mahindra Limited, Solar Team Eindhoven, Cruise Car Inc., Trina Solar, Alkè, Solarrolla, and other notable players.

Recent Development

  • In April 2024, Lightyear unveiled a new prototype of its flagship solar car, the Lightyear 2, with increased range and improved solar panel integration.
  • In May 2024, Sono Motors announced a partnership with a major supplier to secure battery components for their Sion solar electric vehicle, which was planned to go into production later that year. The Sion features a 54 kWh lithium-iron-phosphate (LFP) battery, providing an extended range of up to 305 km and enhanced safety without the use of cobalt, nickel, or manganese.

Segmentation of the Solar Powered Car Market

  • By Solar Panel :

    • Monocrystalline solar cells
    • Polycrystalline Solar Cell
    • Thin-Film Solar Cell
    • Organic Solar Cell
    • Others
  • By Type :

    • Compact
    • Sedan
    • SUVs
    • Vans
    • Others (Mini Vehicles)
  • By Category :

    • Pure Electric
    • Hybrid Electric
  • By Battery Type :

    • Lithium Ion
    • Lead Acid
    • Others
  • By Region :

    • North America
    • Latin America
    • Western Europe
    • Eastern Europe
    • East Asia
    • South Asia & Pacific
    • Middle East & Africa

Table of Content

  1. Executive Summary
    • Global Market Outlook
    • Demand-side Trends
    • Supply-side Trends
    • Technology Roadmap Analysis
    • Analysis and Recommendations
  2. Market Overview
    • Market Coverage / Taxonomy
    • Market Definition / Scope / Limitations
  3. Market Background
    • Market Dynamics
      • Drivers
      • Restraints
      • Opportunity
      • Trends
    • Scenario Forecast
      • Demand in Optimistic Scenario
      • Demand in Likely Scenario
      • Demand in Conservative Scenario
    • Opportunity Map Analysis
    • Product Life Cycle Analysis
    • Supply Chain Analysis
      • Supply Side Participants and their Roles
        • Producers
        • Mid-Level Participants (Traders/ Agents/ Brokers)
        • Wholesalers and Distributors
      • Value Added and Value Created at Node in the Supply Chain
      • List of Component Suppliers
      • List of Existing and Potential Buyers
    • Investment Feasibility Matrix
    • Value Chain Analysis
      • Profit Margin Analysis
      • Wholesalers and Distributors
      • Retailers
    • PESTLE and Porter’s Analysis
    • Regulatory Landscape
      • By Key Regions
      • By Key Countries
    • Production and Consumption Statistics
    • Import and Export Statistics
  4. Global Market Analysis 2020 to 2024 and Forecast, 2025 to 2035
    • Historical Market Size Value (USD Mn) & Volume (Units) Analysis, 2020 to 2024
    • Current and Future Market Size Value (USD Mn) & Volume (Units) Projections, 2025 to 2035
      • Y-o-Y Growth Trend Analysis
      • Absolute $ Opportunity Analysis
  5. Global Market Pricing Analysis 2020 to 2024 and Forecast 2025 to 2035
  6. Global Market Analysis 2020 to 2024 and Forecast 2025 to 2035, By Solar Panel
    • Introduction / Key Findings
    • Historical Market Size Value (USD Mn) & Volume (Units) Analysis By Solar Panel, 2020 to 2024
    • Current and Future Market Size Value (USD Mn) & Volume (Units) Analysis and Forecast By Solar Panel, 2025 to 2035
      • Monocrystalline Solar Cells
      • Polycrystalline Solar Cell
      • Thin-Film Solar Cell
      • Organic Solar Cell
      • Others
    • Y-o-Y Growth Trend Analysis By Solar Panel, 2020 to 2024
    • Absolute $ Opportunity Analysis By Solar Panel, 2025 to 2035
  7. Global Market Analysis 2020 to 2024 and Forecast 2025 to 2035, By Type
    • Introduction / Key Findings
    • Historical Market Size Value (USD Mn) & Volume (Units) Analysis By Type, 2020 to 2024
    • Current and Future Market Size Value (USD Mn) & Volume (Units) Analysis and Forecast By Type, 2025 to 2035
      • Compact
      • Sedan
      • SUVs
      • Vans
      • Others
    • Y-o-Y Growth Trend Analysis By Type, 2020 to 2024
    • Absolute $ Opportunity Analysis By Type, 2025 to 2035
  8. Global Market Analysis 2020 to 2024 and Forecast 2025 to 2035, By Category
    • Introduction / Key Findings
    • Historical Market Size Value (USD Mn) & Volume (Units) Analysis By Category, 2020 to 2024
    • Current and Future Market Size Value (USD Mn) & Volume (Units) Analysis and Forecast By Category, 2025 to 2035
      • Pure Electric
      • Hybrid Electric
    • Y-o-Y Growth Trend Analysis By Category, 2020 to 2024
    • Absolute $ Opportunity Analysis By Category, 2025 to 2035
  9. Global Market Analysis 2020 to 2024 and Forecast 2025 to 2035, By Battery Type
    • Introduction / Key Findings
    • Historical Market Size Value (USD Mn) & Volume (Units) Analysis By Battery Type, 2020 to 2024
    • Current and Future Market Size Value (USD Mn) & Volume (Units) Analysis and Forecast By Battery Type, 2025 to 2035
      • Lithium Ion
      • Lead Acid
      • Others
    • Y-o-Y Growth Trend Analysis By Battery Type, 2020 to 2024
    • Absolute $ Opportunity Analysis By Battery Type, 2025 to 2035
  10. Global Market Analysis 2020 to 2024 and Forecast 2025 to 2035, By Region
    • Introduction
    • Historical Market Size Value (USD Mn) & Volume (Units) Analysis By Region, 2020 to 2024
    • Current Market Size Value (USD Mn) & Volume (Units) Analysis and Forecast By Region, 2025 to 2035
      • North America
      • Latin America
      • Western Europe
      • East Asia
      • South Asia Pacific
      • Eastern Europe
      • Middle East & Africa
    • Market Attractiveness Analysis By Region
  11. North America Market Analysis 2020 to 2024 and Forecast 2025 to 2035, By Country
    • Historical Market Size Value (USD Mn) & Volume (Units) Trend Analysis By Market Taxonomy, 2020 to 2024
    • Market Size Value (USD Mn) & Volume (Units) Forecast By Market Taxonomy, 2025 to 2035
      • By Country
        • U.S.
        • Canada
        • Mexico
      • By Solar Panel
      • By Type
      • By Category
      • By Battery Type
    • Market Attractiveness Analysis
      • By Country
      • By Solar Panel
      • By Type
      • By Category
      • By Battery Type
    • Key Takeaways
  12. Latin America Market Analysis 2020 to 2024 and Forecast 2025 to 2035, By Country
    • Historical Market Size Value (USD Mn) & Volume (Units) Trend Analysis By Market Taxonomy, 2020 to 2024
    • Market Size Value (USD Mn) & Volume (Units) Forecast By Market Taxonomy, 2025 to 2035
      • By Country
        • Brazil
        • Chile
        • Rest of Latin America
      • By Solar Panel
      • By Type
      • By Category
      • By Battery Type
    • Market Attractiveness Analysis
      • By Country
      • By Solar Panel
      • By Type
      • By Category
      • By Battery Type
    • Key Takeaways
  13. Western Europe Market Analysis 2020 to 2024 and Forecast 2025 to 2035, By Country
    • Historical Market Size Value (USD Mn) & Volume (Units) Trend Analysis By Market Taxonomy, 2020 to 2024
    • Market Size Value (USD Mn) & Volume (Units) Forecast By Market Taxonomy, 2025 to 2035
      • By Country
        • Germany
        • Italy
        • France
        • U.K.
        • Spain
        • Russia
        • BENELUX
        • Rest of Europe
      • By Solar Panel
      • By Type
      • By Category
      • By Battery Type
    • Market Attractiveness Analysis
      • By Country
      • By Solar Panel
      • By Type
      • By Category
      • By Battery Type
    • Key Takeaways
  14. East Asia Market Analysis 2020 to 2024 and Forecast 2025 to 2035, By Country
    • Historical Market Size Value (USD Mn) & Volume (Units) Trend Analysis By Market Taxonomy, 2020 to 2024
    • Market Size Value (USD Mn) & Volume (Units) Forecast By Market Taxonomy, 2025 to 2035
      • By Country
        • China
        • Japan
        • South Korea
      • By Solar Panel
      • By Type
      • By Category
      • By Battery Type
    • Market Attractiveness Analysis
      • By Country
      • By Solar Panel
      • By Type
      • By Category
      • By Battery Type
    • Key Takeaways
  15. South Asia Pacific Market Analysis 2020 to 2024 and Forecast 2025 to 2035, By Country
    • Historical Market Size Value (USD Mn) & Volume (Units) Trend Analysis By Market Taxonomy, 2020 to 2024
    • Market Size Value (USD Mn) & Volume (Units) Forecast By Market Taxonomy, 2025 to 2035
      • By Country
        • India
        • ASEAN Countries
        • Australia & New Zealand
        • Rest of South Asia Pacific
      • By Solar Panel
      • By Type
      • By Category
      • By Battery Type
    • Market Attractiveness Analysis
      • By Country
      • By Solar Panel
      • By Type
      • By Category
      • By Battery Type
    • Key Takeaways
  16. Eastern Europe Market Analysis 2020 to 2024 and Forecast 2025 to 2035, By Country
    • Historical Market Size Value (USD Mn) & Volume (Units) Trend Analysis By Market Taxonomy, 2020 to 2024
    • Market Size Value (USD Mn) & Volume (Units) Forecast By Market Taxonomy, 2025 to 2035
      • By Country
        • Russia
        • Poland
        • Hungary
        • Balkan & Baltics
        • Rest of Eastern Europe
      • By Solar Panel
      • By Type
      • By Category
      • By Battery Type
    • Market Attractiveness Analysis
      • By Country
      • By Solar Panel
      • By Type
      • By Category
      • By Battery Type
    • Key Takeaways
  17. Middle East & Africa Market Analysis 2020 to 2024 and Forecast 2025 to 2035, By Country
    • Historical Market Size Value (USD Mn) & Volume (Units) Trend Analysis By Market Taxonomy, 2020 to 2024
    • Market Size Value (USD Mn) & Volume (Units) Forecast By Market Taxonomy, 2025 to 2035
      • By Country
        • KSA
        • Other GCC Countries
        • Turkiye
        • South Africa
        • Rest of MEA
      • By Solar Panel
      • By Type
      • By Category
      • By Battery Type
    • Market Attractiveness Analysis
      • By Country
      • By Solar Panel
      • By Type
      • By Category
      • By Battery Type
    • Key Takeaways
  18. Key Countries Market Analysis
    • Netherlands
      • Pricing Analysis
      • Market Share Analysis, 2024
        • By Solar Panel
        • By Type
        • By Category
        • By Battery Type
    • Germany
      • Pricing Analysis
      • Market Share Analysis, 2024
        • By Solar Panel
        • By Type
        • By Category
        • By Battery Type
    • Japan
      • Pricing Analysis
      • Market Share Analysis, 2024
        • By Solar Panel
        • By Type
        • By Category
        • By Battery Type
    • United States
      • Pricing Analysis
      • Market Share Analysis, 2024
        • By Solar Panel
        • By Type
        • By Category
        • By Battery Type
    • South Korea
      • Pricing Analysis
      • Market Share Analysis, 2024
        • By Solar Panel
        • By Type
        • By Category
        • By Battery Type
  19. Market Structure Analysis
    • Competition Dashboard
    • Competition Benchmarking
    • Market Share Analysis of Top Players
      • By Regional
      • By Solar Panel
      • By Type
      • By Category
      • By Battery Type
  20. Competition Analysis
    • Competition Deep Dive
      • Hyundai Motor Company
        • Overview
        • Product Portfolio
        • Profitability by Market Segments (Product/Age /Sales Channel/Region)
        • Sales Footprint
        • Strategy Overview
          • Marketing Strategy
          • Product Strategy
          • Channel Strategy
      • Squad Mobility
        • Overview
        • Product Portfolio
        • Profitability by Market Segments (Product/Age /Sales Channel/Region)
        • Sales Footprint
        • Strategy Overview
          • Marketing Strategy
          • Product Strategy
          • Channel Strategy
      • Lightyear
        • Overview
        • Product Portfolio
        • Profitability by Market Segments (Product/Age /Sales Channel/Region)
        • Sales Footprint
        • Strategy Overview
          • Marketing Strategy
          • Product Strategy
          • Channel Strategy
      • Toyota Motor Corporation
        • Overview
        • Product Portfolio
        • Profitability by Market Segments (Product/Age /Sales Channel/Region)
        • Sales Footprint
        • Strategy Overview
          • Marketing Strategy
          • Product Strategy
          • Channel Strategy
      • Sono Motors
        • Overview
        • Product Portfolio
        • Profitability by Market Segments (Product/Age /Sales Channel/Region)
        • Sales Footprint
        • Strategy Overview
          • Marketing Strategy
          • Product Strategy
          • Channel Strategy
      • Aptera Motors
        • Overview
        • Product Portfolio
        • Profitability by Market Segments (Product/Age /Sales Channel/Region)
        • Sales Footprint
        • Strategy Overview
          • Marketing Strategy
          • Product Strategy
          • Channel Strategy
      • Ford Motor Company
        • Overview
        • Product Portfolio
        • Profitability by Market Segments (Product/Age /Sales Channel/Region)
        • Sales Footprint
        • Strategy Overview
          • Marketing Strategy
          • Product Strategy
          • Channel Strategy
      • Mahindra & Mahindra Limited
        • Overview
        • Product Portfolio
        • Profitability by Market Segments (Product/Age /Sales Channel/Region)
        • Sales Footprint
        • Strategy Overview
          • Marketing Strategy
          • Product Strategy
          • Channel Strategy
      • Solar Team Eindhoven
        • Overview
        • Product Portfolio
        • Profitability by Market Segments (Product/Age /Sales Channel/Region)
        • Sales Footprint
        • Strategy Overview
          • Marketing Strategy
          • Product Strategy
          • Channel Strategy
      • Cruise Car Inc.
        • Overview
        • Product Portfolio
        • Profitability by Market Segments (Product/Age /Sales Channel/Region)
        • Sales Footprint
        • Strategy Overview
          • Marketing Strategy
          • Product Strategy
          • Channel Strategy
      • Trina Solar
        • Overview
        • Product Portfolio
        • Profitability by Market Segments (Product/Age /Sales Channel/Region)
        • Sales Footprint
        • Strategy Overview
          • Marketing Strategy
          • Product Strategy
          • Channel Strategy
      • Alkè
        • Overview
        • Product Portfolio
        • Profitability by Market Segments (Product/Age /Sales Channel/Region)
        • Sales Footprint
        • Strategy Overview
          • Marketing Strategy
          • Product Strategy
          • Channel Strategy
      • Solarrolla
        • Overview
        • Product Portfolio
        • Profitability by Market Segments (Product/Age /Sales Channel/Region)
        • Sales Footprint
        • Strategy Overview
          • Marketing Strategy
          • Product Strategy
          • Channel Strategy
  21. Assumptions & Acronyms Used
  22. Research Methodology

List Of Table

  • Table 1: Global Market Value (USD Mn) Forecast by Region, 2020 to 2035
  • Table 2: Global Market Volume (Units) Forecast by Region, 2020 to 2035
  • Table 3: Global Market Value (USD Mn) Forecast by Solar Panel, 2020 to 2035
  • Table 4: Global Market Volume (Units) Forecast by Solar Panel, 2020 to 2035
  • Table 5: Global Market Value (USD Mn) Forecast by Type, 2020 to 2035
  • Table 6: Global Market Volume (Units) Forecast by Type, 2020 to 2035
  • Table 7: Global Market Value (USD Mn) Forecast by Category, 2020 to 2035
  • Table 8: Global Market Volume (Units) Forecast by Category, 2020 to 2035
  • Table 9: Global Market Value (USD Mn) Forecast by Battery Type, 2020 to 2035
  • Table 10: Global Market Volume (Units) Forecast by Battery Type, 2020 to 2035
  • Table 11: North America Market Value (USD Mn) Forecast by Country, 2020 to 2035
  • Table 12: North America Market Volume (Units) Forecast by Country, 2020 to 2035
  • Table 13: North America Market Value (USD Mn) Forecast by Solar Panel, 2020 to 2035
  • Table 14: North America Market Volume (Units) Forecast by Solar Panel, 2020 to 2035
  • Table 15: North America Market Value (USD Mn) Forecast by Type, 2020 to 2035
  • Table 16: North America Market Volume (Units) Forecast by Type, 2020 to 2035
  • Table 17: North America Market Value (USD Mn) Forecast by Category, 2020 to 2035
  • Table 18: North America Market Volume (Units) Forecast by Category, 2020 to 2035
  • Table 19: North America Market Value (USD Mn) Forecast by Battery Type, 2020 to 2035
  • Table 20: North America Market Volume (Units) Forecast by Battery Type, 2020 to 2035
  • Table 21: Latin America Market Value (USD Mn) Forecast by Country, 2020 to 2035
  • Table 22: Latin America Market Volume (Units) Forecast by Country, 2020 to 2035
  • Table 23: Latin America Market Value (USD Mn) Forecast by Solar Panel, 2020 to 2035
  • Table 24: Latin America Market Volume (Units) Forecast by Solar Panel, 2020 to 2035
  • Table 25: Latin America Market Value (USD Mn) Forecast by Type, 2020 to 2035
  • Table 26: Latin America Market Volume (Units) Forecast by Type, 2020 to 2035
  • Table 27: Latin America Market Value (USD Mn) Forecast by Category, 2020 to 2035
  • Table 28: Latin America Market Volume (Units) Forecast by Category, 2020 to 2035
  • Table 29: Latin America Market Value (USD Mn) Forecast by Battery Type, 2020 to 2035
  • Table 30: Latin America Market Volume (Units) Forecast by Battery Type, 2020 to 2035
  • Table 31: Western Europe Market Value (USD Mn) Forecast by Country, 2020 to 2035
  • Table 32: Western Europe Market Volume (Units) Forecast by Country, 2020 to 2035
  • Table 33: Western Europe Market Value (USD Mn) Forecast by Solar Panel, 2020 to 2035
  • Table 34: Western Europe Market Volume (Units) Forecast by Solar Panel, 2020 to 2035
  • Table 35: Western Europe Market Value (USD Mn) Forecast by Type, 2020 to 2035
  • Table 36: Western Europe Market Volume (Units) Forecast by Type, 2020 to 2035
  • Table 37: Western Europe Market Value (USD Mn) Forecast by Category, 2020 to 2035
  • Table 38: Western Europe Market Volume (Units) Forecast by Category, 2020 to 2035
  • Table 39: Western Europe Market Value (USD Mn) Forecast by Battery Type, 2020 to 2035
  • Table 40: Western Europe Market Volume (Units) Forecast by Battery Type, 2020 to 2035
  • Table 41: East Asia Market Value (USD Mn) Forecast by Country, 2020 to 2035
  • Table 42: East Asia Market Volume (Units) Forecast by Country, 2020 to 2035
  • Table 43: East Asia Market Value (USD Mn) Forecast by Solar Panel, 2020 to 2035
  • Table 44: East Asia Market Volume (Units) Forecast by Solar Panel, 2020 to 2035
  • Table 45: East Asia Market Value (USD Mn) Forecast by Type, 2020 to 2035
  • Table 46: East Asia Market Volume (Units) Forecast by Type, 2020 to 2035
  • Table 47: East Asia Market Value (USD Mn) Forecast by Category, 2020 to 2035
  • Table 48: East Asia Market Volume (Units) Forecast by Category, 2020 to 2035
  • Table 49: East Asia Market Value (USD Mn) Forecast by Battery Type, 2020 to 2035
  • Table 50: East Asia Market Volume (Units) Forecast by Battery Type, 2020 to 2035
  • Table 51: South Asia Pacific Market Value (USD Mn) Forecast by Country, 2020 to 2035
  • Table 52: South Asia Pacific Market Volume (Units) Forecast by Country, 2020 to 2035
  • Table 53: South Asia Pacific Market Value (USD Mn) Forecast by Solar Panel, 2020 to 2035
  • Table 54: South Asia Pacific Market Volume (Units) Forecast by Solar Panel, 2020 to 2035
  • Table 55: South Asia Pacific Market Value (USD Mn) Forecast by Type, 2020 to 2035
  • Table 56: South Asia Pacific Market Volume (Units) Forecast by Type, 2020 to 2035
  • Table 57: South Asia Pacific Market Value (USD Mn) Forecast by Category, 2020 to 2035
  • Table 58: South Asia Pacific Market Volume (Units) Forecast by Category, 2020 to 2035
  • Table 59: South Asia Pacific Market Value (USD Mn) Forecast by Battery Type, 2020 to 2035
  • Table 60: South Asia Pacific Market Volume (Units) Forecast by Battery Type, 2020 to 2035
  • Table 61: Eastern Europe Market Value (USD Mn) Forecast by Country, 2020 to 2035
  • Table 62: Eastern Europe Market Volume (Units) Forecast by Country, 2020 to 2035
  • Table 63: Eastern Europe Market Value (USD Mn) Forecast by Solar Panel, 2020 to 2035
  • Table 64: Eastern Europe Market Volume (Units) Forecast by Solar Panel, 2020 to 2035
  • Table 65: Eastern Europe Market Value (USD Mn) Forecast by Type, 2020 to 2035
  • Table 66: Eastern Europe Market Volume (Units) Forecast by Type, 2020 to 2035
  • Table 67: Eastern Europe Market Value (USD Mn) Forecast by Category, 2020 to 2035
  • Table 68: Eastern Europe Market Volume (Units) Forecast by Category, 2020 to 2035
  • Table 69: Eastern Europe Market Value (USD Mn) Forecast by Battery Type, 2020 to 2035
  • Table 70: Eastern Europe Market Volume (Units) Forecast by Battery Type, 2020 to 2035
  • Table 71: Middle East & Africa Market Value (USD Mn) Forecast by Country, 2020 to 2035
  • Table 72: Middle East & Africa Market Volume (Units) Forecast by Country, 2020 to 2035
  • Table 73: Middle East & Africa Market Value (USD Mn) Forecast by Solar Panel, 2020 to 2035
  • Table 74: Middle East & Africa Market Volume (Units) Forecast by Solar Panel, 2020 to 2035
  • Table 75: Middle East & Africa Market Value (USD Mn) Forecast by Type, 2020 to 2035
  • Table 76: Middle East & Africa Market Volume (Units) Forecast by Type, 2020 to 2035
  • Table 77: Middle East & Africa Market Value (USD Mn) Forecast by Category, 2020 to 2035
  • Table 78: Middle East & Africa Market Volume (Units) Forecast by Category, 2020 to 2035
  • Table 79: Middle East & Africa Market Value (USD Mn) Forecast by Battery Type, 2020 to 2035
  • Table 80: Middle East & Africa Market Volume (Units) Forecast by Battery Type, 2020 to 2035

List Of Figures

  • Figure 1: Global Market Volume (Units) Forecast 2020 to 2035
  • Figure 2: Global Market Pricing Analysis
  • Figure 3: Global Market Value (USD Mn) Forecast 2020 to 2035
  • Figure 4: Global Market Value Share and BPS Analysis by Solar Panel, 2025 and 2035
  • Figure 5: Global Market Y-o-Y Growth Comparison by Solar Panel, 2025 to 2035
  • Figure 6: Global Market Attractiveness Analysis by Solar Panel
  • Figure 7: Global Market Value Share and BPS Analysis by Type, 2025 and 2035
  • Figure 8: Global Market Y-o-Y Growth Comparison by Type, 2025 to 2035
  • Figure 9: Global Market Attractiveness Analysis by Type
  • Figure 10: Global Market Value Share and BPS Analysis by Category, 2025 and 2035
  • Figure 11: Global Market Y-o-Y Growth Comparison by Category, 2025 to 2035
  • Figure 12: Global Market Attractiveness Analysis by Category
  • Figure 13: Global Market Value Share and BPS Analysis by Battery Type, 2025 and 2035
  • Figure 14: Global Market Y-o-Y Growth Comparison by Battery Type, 2025 to 2035
  • Figure 15: Global Market Attractiveness Analysis by Battery Type
  • Figure 16: Global Market Value (USD Mn) Share and BPS Analysis by Region, 2025 and 2035
  • Figure 17: Global Market Y-o-Y Growth Comparison by Region, 2025 to 2035
  • Figure 18: Global Market Attractiveness Analysis by Region
  • Figure 19: North America Market Incremental $ Opportunity, 2025 to 2035
  • Figure 20: Latin America Market Incremental $ Opportunity, 2025 to 2035
  • Figure 21: Western Europe Market Incremental $ Opportunity, 2025 to 2035
  • Figure 22: East Asia Market Incremental $ Opportunity, 2025 to 2035
  • Figure 23: South Asia Pacific Market Incremental $ Opportunity, 2025 to 2035
  • Figure 24: Eastern Europe Market Incremental $ Opportunity, 2025 to 2035
  • Figure 25: Middle East & Africa Market Incremental $ Opportunity, 2025 to 2035
  • Figure 26: North America Market Value Share and BPS Analysis by Country, 2025 and 2035
  • Figure 27: North America Market Value Share and BPS Analysis by Solar Panel, 2025 and 2035
  • Figure 28: North America Market Y-o-Y Growth Comparison by Solar Panel, 2025 to 2035
  • Figure 29: North America Market Attractiveness Analysis by Solar Panel
  • Figure 30: North America Market Value Share and BPS Analysis by Type, 2025 and 2035
  • Figure 31: North America Market Y-o-Y Growth Comparison by Type, 2025 to 2035
  • Figure 32: North America Market Attractiveness Analysis by Type
  • Figure 33: North America Market Value Share and BPS Analysis by Category, 2025 and 2035
  • Figure 34: North America Market Y-o-Y Growth Comparison by Category, 2025 to 2035
  • Figure 35: North America Market Attractiveness Analysis by Category
  • Figure 36: North America Market Value Share and BPS Analysis by Battery Type, 2025 and 2035
  • Figure 37: North America Market Y-o-Y Growth Comparison by Battery Type, 2025 to 2035
  • Figure 38: North America Market Attractiveness Analysis by Battery Type
  • Figure 39: Latin America Market Value Share and BPS Analysis by Country, 2025 and 2035
  • Figure 40: Latin America Market Value Share and BPS Analysis by Solar Panel, 2025 and 2035
  • Figure 41: Latin America Market Y-o-Y Growth Comparison by Solar Panel, 2025 to 2035
  • Figure 42: Latin America Market Attractiveness Analysis by Solar Panel
  • Figure 43: Latin America Market Value Share and BPS Analysis by Type, 2025 and 2035
  • Figure 44: Latin America Market Y-o-Y Growth Comparison by Type, 2025 to 2035
  • Figure 45: Latin America Market Attractiveness Analysis by Type
  • Figure 46: Latin America Market Value Share and BPS Analysis by Category, 2025 and 2035
  • Figure 47: Latin America Market Y-o-Y Growth Comparison by Category, 2025 to 2035
  • Figure 48: Latin America Market Attractiveness Analysis by Category
  • Figure 49: Latin America Market Value Share and BPS Analysis by Battery Type, 2025 and 2035
  • Figure 50: Latin America Market Y-o-Y Growth Comparison by Battery Type, 2025 to 2035
  • Figure 51: Latin America Market Attractiveness Analysis by Battery Type
  • Figure 52: Western Europe Market Value Share and BPS Analysis by Country, 2025 and 2035
  • Figure 53: Western Europe Market Value Share and BPS Analysis by Solar Panel, 2025 and 2035
  • Figure 54: Western Europe Market Y-o-Y Growth Comparison by Solar Panel, 2025 to 2035
  • Figure 55: Western Europe Market Attractiveness Analysis by Solar Panel
  • Figure 56: Western Europe Market Value Share and BPS Analysis by Type, 2025 and 2035
  • Figure 57: Western Europe Market Y-o-Y Growth Comparison by Type, 2025 to 2035
  • Figure 58: Western Europe Market Attractiveness Analysis by Type
  • Figure 59: Western Europe Market Value Share and BPS Analysis by Category, 2025 and 2035
  • Figure 60: Western Europe Market Y-o-Y Growth Comparison by Category, 2025 to 2035
  • Figure 61: Western Europe Market Attractiveness Analysis by Category
  • Figure 62: Western Europe Market Value Share and BPS Analysis by Battery Type, 2025 and 2035
  • Figure 63: Western Europe Market Y-o-Y Growth Comparison by Battery Type, 2025 to 2035
  • Figure 64: Western Europe Market Attractiveness Analysis by Battery Type
  • Figure 65: East Asia Market Value Share and BPS Analysis by Country, 2025 and 2035
  • Figure 66: East Asia Market Value Share and BPS Analysis by Solar Panel, 2025 and 2035
  • Figure 67: East Asia Market Y-o-Y Growth Comparison by Solar Panel, 2025 to 2035
  • Figure 68: East Asia Market Attractiveness Analysis by Solar Panel
  • Figure 69: East Asia Market Value Share and BPS Analysis by Type, 2025 and 2035
  • Figure 70: East Asia Market Y-o-Y Growth Comparison by Type, 2025 to 2035
  • Figure 71: East Asia Market Attractiveness Analysis by Type
  • Figure 72: East Asia Market Value Share and BPS Analysis by Category, 2025 and 2035
  • Figure 73: East Asia Market Y-o-Y Growth Comparison by Category, 2025 to 2035
  • Figure 74: East Asia Market Attractiveness Analysis by Category
  • Figure 75: East Asia Market Value Share and BPS Analysis by Battery Type, 2025 and 2035
  • Figure 76: East Asia Market Y-o-Y Growth Comparison by Battery Type, 2025 to 2035
  • Figure 77: East Asia Market Attractiveness Analysis by Battery Type
  • Figure 78: South Asia Pacific Market Value Share and BPS Analysis by Country, 2025 and 2035
  • Figure 79: South Asia Pacific Market Value Share and BPS Analysis by Solar Panel, 2025 and 2035
  • Figure 80: South Asia Pacific Market Y-o-Y Growth Comparison by Solar Panel, 2025 to 2035
  • Figure 81: South Asia Pacific Market Attractiveness Analysis by Solar Panel
  • Figure 82: South Asia Pacific Market Value Share and BPS Analysis by Type, 2025 and 2035
  • Figure 83: South Asia Pacific Market Y-o-Y Growth Comparison by Type, 2025 to 2035
  • Figure 84: South Asia Pacific Market Attractiveness Analysis by Type
  • Figure 85: South Asia Pacific Market Value Share and BPS Analysis by Category, 2025 and 2035
  • Figure 86: South Asia Pacific Market Y-o-Y Growth Comparison by Category, 2025 to 2035
  • Figure 87: South Asia Pacific Market Attractiveness Analysis by Category
  • Figure 88: South Asia Pacific Market Value Share and BPS Analysis by Battery Type, 2025 and 2035
  • Figure 89: South Asia Pacific Market Y-o-Y Growth Comparison by Battery Type, 2025 to 2035
  • Figure 90: South Asia Pacific Market Attractiveness Analysis by Battery Type
  • Figure 91: Eastern Europe Market Value Share and BPS Analysis by Country, 2025 and 2035
  • Figure 92: Eastern Europe Market Value Share and BPS Analysis by Solar Panel, 2025 and 2035
  • Figure 93: Eastern Europe Market Y-o-Y Growth Comparison by Solar Panel, 2025 to 2035
  • Figure 94: Eastern Europe Market Attractiveness Analysis by Solar Panel
  • Figure 95: Eastern Europe Market Value Share and BPS Analysis by Type, 2025 and 2035
  • Figure 96: Eastern Europe Market Y-o-Y Growth Comparison by Type, 2025 to 2035
  • Figure 97: Eastern Europe Market Attractiveness Analysis by Type
  • Figure 98: Eastern Europe Market Value Share and BPS Analysis by Category, 2025 and 2035
  • Figure 99: Eastern Europe Market Y-o-Y Growth Comparison by Category, 2025 to 2035
  • Figure 100: Eastern Europe Market Attractiveness Analysis by Category
  • Figure 101: Eastern Europe Market Value Share and BPS Analysis by Battery Type, 2025 and 2035
  • Figure 102: Eastern Europe Market Y-o-Y Growth Comparison by Battery Type, 2025 to 2035
  • Figure 103: Eastern Europe Market Attractiveness Analysis by Battery Type
  • Figure 104: Middle East & Africa Market Value Share and BPS Analysis by Country, 2025 and 2035
  • Figure 105: Middle East & Africa Market Value Share and BPS Analysis by Solar Panel, 2025 and 2035
  • Figure 106: Middle East & Africa Market Y-o-Y Growth Comparison by Solar Panel, 2025 to 2035
  • Figure 107: Middle East & Africa Market Attractiveness Analysis by Solar Panel
  • Figure 108: Middle East & Africa Market Value Share and BPS Analysis by Type, 2025 and 2035
  • Figure 109: Middle East & Africa Market Y-o-Y Growth Comparison by Type, 2025 to 2035
  • Figure 110: Middle East & Africa Market Attractiveness Analysis by Type
  • Figure 111: Middle East & Africa Market Value Share and BPS Analysis by Category, 2025 and 2035
  • Figure 112: Middle East & Africa Market Y-o-Y Growth Comparison by Category, 2025 to 2035
  • Figure 113: Middle East & Africa Market Attractiveness Analysis by Category
  • Figure 114: Middle East & Africa Market Value Share and BPS Analysis by Battery Type, 2025 and 2035
  • Figure 115: Middle East & Africa Market Y-o-Y Growth Comparison by Battery Type, 2025 to 2035
  • Figure 116: Middle East & Africa Market Attractiveness Analysis by Battery Type
  • Figure 117: Global Market - Tier Structure Analysis
  • Figure 118: Global Market - Company Share Analysis

- FAQs -

What is the global Solar Powered Car Market size in 2025?

The solar powered car market is valued at USD 125.6 million in 2025.

Who are the major players operating in the Solar Powered Car Market?

Prominent players in the market include Sono Motors, Aptera Motors, Ford Motor Company, Mahindra & Mahindra Limited, and Solar Team Eindhoven.

What is the estimated valuation of the Solar Powered Car Market by 2035?

The market is expected to reach a valuation of USD 400.7 million by 2035.

What value CAGR is the Solar Powered Car Market exhibit over the last five years?

The historic growth rate of the Solar Powered Car Market was 11.2% from 2020 to 2024.

Solar Powered Car Market

Schedule a Call