- Market Value (2025): USD 18.7 Bn
- Estimated Value (2026): USD 20.0 Bn
- Forecast Value (2036): USD 38.6 Bn
- CAGR (2026-2036): 6.8%
What is the Advanced Marine Power Supply Market forecast to be worth by 2036?
USD 20.0 billion in 2026 to USD 38.6 billion by 2036 at a 6.8% CAGR.
- At USD 18.7 billion in 2025, the advanced marine power supply market already spans merchant, offshore and naval fleets that depend on generators, switchboards and power converters every hour at sea.
- Revenue will grow from USD 20.0 billion in 2026 to USD 38.6 billion by 2036 as yards fit more batteries, converters and power management systems into each new hull.
- A 6.8% CAGR through 2036 follows the steady electrification of new ships and the refit of existing fleets for shore power and hybrid operation.
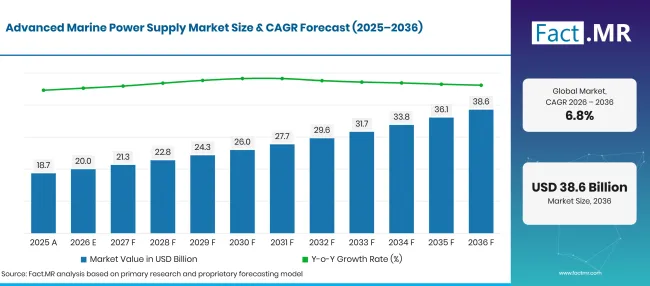
Advanced Marine Power Supply Market Forecast Global | Source: Fact.MR
| Year | Basis | Market Value (USD billion) |
|---|---|---|
| 2025 | Actual | 18.7 |
| 2026 | Estimate | 20.0 |
| 2036 | Forecast | 38.6 |
| CAGR 2026 to 2036 | Forecast period | 6.8% |
Source: Fact.MR analysis. Updated Nov 6, 2026
What are the defining numbers behind Advanced Marine Power Supply Market growth?
The 2026 to 2036 period adds USD 18.6 billion in new value, with AC systems, commercial vessels, 1-5 MW ratings and shipbuilding accounting for the bulk of it.
- Demand Drivers in the Market
- Battery power is moving from auxiliary duty to main supply. The IMO’s ship design sub-committee has agreed a workplan to amend SOLAS regulation II-1/41 by 2028 so that batteries can serve as the main source of electrical power and lighting [1]. Clear rules of this kind give shipowners the confidence to order larger battery systems and the converters that manage them.
- Public funding for clean vessel technology keeps new projects moving. The UK government awarded £30 million in July 2025 through the sixth round of its Clean Maritime Demonstration Competition [2]. The round covers electric, hydrogen and ammonia technologies among others.
- Port rules on emissions at berth push ships toward shore connections. A vessel that plugs into the grid needs frequency converters, cable management and switchboards that can accept outside power safely.
- Onboard loads keep growing with automation, dynamic positioning and digital monitoring. Offshore and cruise ships need networks that share load across generators and batteries.
- Key Segments Analyzed
- By Product Type: AC Power Supply will hold 42.3% share in 2026, since nearly every merchant ship built in the past decades runs its pumps, winches and hotel loads on alternating current.
- By Application: Commercial Vessels will account for 45.2% of 2026 value, given the sheer number of cargo ships and ferries in service and on order.
- By Power Output: 1-5 MW systems will capture 43.1% of 2026 revenue, as this range matches the auxiliary and hybrid needs of mid-sized cargo ships, ferries and offshore vessels.
- By End-User: Shipbuilding will command 52.3% of 2026 demand, because the electrical system is specified and installed while the hull is still at the yard.
- Analyst Opinion at Fact.MR
- Shambhu Nath Jha, Principal Consultant at Fact.MR, states, “Shipowners will treat electrical architecture as a fuel decision. Every kilowatt saved at sea or drawn from shore cuts operating cost and emissions. AC networks will remain the base of most fleets, while DC grids and battery hybrids will gain ground quickest in ferries, offshore vessels and naval auxiliaries. Suppliers that can integrate generation, storage and shore connection under one control system will win the larger share of newbuild contracts.”
- Strategic Implications
- Equipment manufacturers should offer switchboards and converters that accept battery and shore inputs from day one, so owners can add storage later without rewiring the vessel.
- Shipyards should lock in the power architecture at the concept design stage, since late changes to cable routes and switchboard rooms raise build costs sharply.
- Port authorities should coordinate shore power voltage and frequency with the fleets that call most often, which raises connection rates and the return on each berth.
- Investors should look at suppliers with proven system integration skills, as owners prefer one partner who answers for generation, storage and control together.
Germany heads the five assessed countries at 7.8%, with port electrification at Hamburg and Kiel and a strong base of specialist yards. Brazil follows at 7.1%, only 0.7 points behind, as state-financed offshore support vessels with hybrid propulsion come onto the order books. The United States records 6.5%; its fleet is large and mature, so much of the gain comes from port grants and naval work. In the United Kingdom, legally framed decarbonisation targets steer the market to 5.8%. Japan closes the range at 5.1%, since its yards are retooling for zero-emission ships but convert that capacity into orders more gradually.
How does the Advanced Marine Power Supply Market break down by segment?
AC Power Supply will lead Product Type at 42.3%; Commercial Vessels will head Application at 45.2%; 1-5 MW systems will top Power Output at 43.1%; Shipbuilding will hold End-User at 52.3% in 2026.
Which Product Type leads?
AC Power Supply takes 42.3% of 2026 sales.
| Product Type | Share (2026) |
|---|---|
| AC Power Supply (Leading segment) | 42.3% |
| Other segments combined | 57.7%* |
| Total | 100.0% |
Source: Fact.MR analysis. Updated Nov 6, 2026
Most merchant ships were designed around alternating current, so generators, transformers and motor loads all share a common standard. Owners who refit these ships keep the AC backbone and add frequency converters or battery links around it. Main and emergency marine switchboards remain the core purchase in this segment, as they protect and route power to every consumer on board. Shore power keeps AC demand active at the berth as well. The Hamburg Port Authority planned shore power at all of its container terminals by the end of 2025, and Ocean Network Express became the first line to commit to using it at two HHLA terminals [3]. DC and hybrid supplies form the newer part of the segment, where battery ferries and offshore vessels use DC grids to cut conversion losses.
What supports Commercial Vessels within Application?
Commercial Vessels represent 45.2% of 2026 revenue.
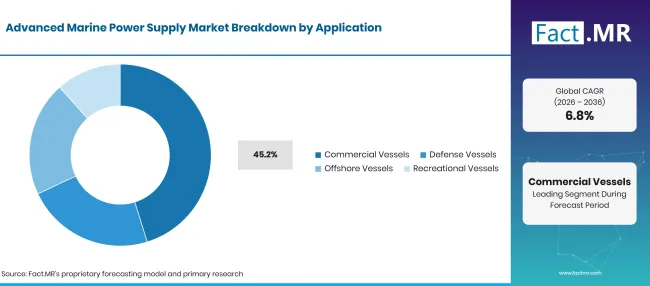
Advanced Marine Power Supply Market Breakdown Application | Source: Fact.MR
| Application | Share (2026) |
|---|---|
| Commercial Vessels (Leading segment) | 45.2% |
| Other segments combined | 54.8%* |
| Total | 100.0% |
Source: Fact.MR analysis. Updated Nov 6, 2026
Cargo ships and passenger ferries run pumps, cranes and hotel loads around the clock. Each of these ships carries several large generators alongside switchboards and converters, which creates steady replacement and upgrade demand. Ferries on fixed routes adopt battery operation first. EMSA updated its shore-side electricity guidance for port authorities and administrations in November 2025, noting that electric and hybrid-electric plug-in ships now carry larger batteries that need charging at berth [4]. Defense, offshore and recreational vessels complete the application mix, each with its own rules on redundancy and space.
What leads the Power Output segment?
1-5 MW systems account for 43.1% of 2026 demand.
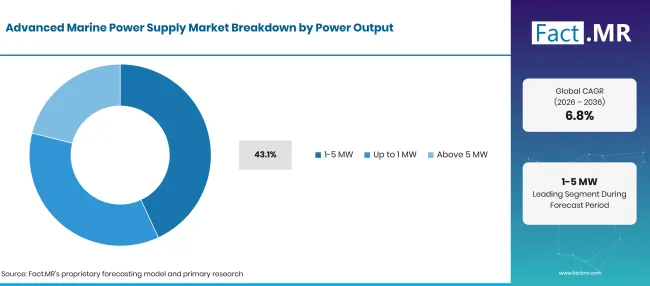
Advanced Marine Power Supply Market Breakdown Power Output | Source: Fact.MR
| Power Output | Share (2026) |
|---|---|
| 1-5 MW systems (Leading segment) | 43.1% |
| Other segments combined | 56.9%* |
| Total | 100.0% |
Source: Fact.MR analysis. Updated Nov 6, 2026
Mid-sized cargo ships, ferries, tugs and offshore supply vessels typically need a few megawatts for auxiliary and hybrid loads. Generator sets, battery banks and converters in this range are standard catalogue items, which keeps lead times and prices predictable. A battery management system is now part of most hybrid packages at this rating. Systems up to 1 MW serve workboats, small ferries and yachts, where weight and space set the limits. Units above 5 MW go into cruise ships, naval combatants and large offshore construction vessels with diesel-electric propulsion.
How does End-User shape demand?
Shipbuilding takes 52.3% of 2026 value.
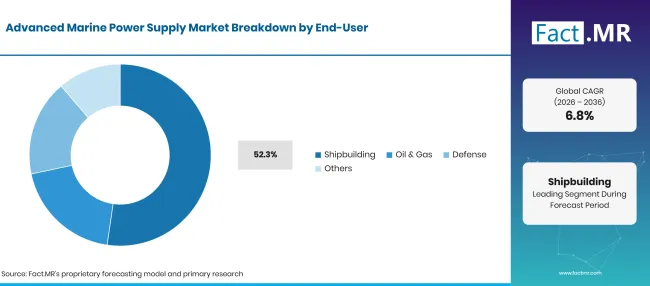
Advanced Marine Power Supply Market Breakdown End User | Source: Fact.MR
| End-User | Share (2026) |
|---|---|
| Shipbuilding (Leading segment) | 52.3% |
| Other segments combined | 47.7%* |
| Total | 100.0% |
Source: Fact.MR analysis. Updated Nov 6, 2026
Yards decide the electrical architecture early, because cable routes, switchboard rooms and battery spaces are hard to change once steel is cut. A newbuild contract therefore bundles generators, distribution, energy storage systems and power management into one package. Oil and gas operators buy power systems for supply vessels, shuttle tankers and floating units serving offshore fields. Defence buyers fund naval newbuilds and mid-life upgrades with strict rules on redundancy. Other end users include ferry operators, research institutes and yacht owners.
What is accelerating Advanced Marine Power Supply Market adoption, and what is holding it back?
Port emission rules, battery safety standards and public funding for clean vessels are lifting orders for converters, storage and switchboards. Yards are also adding more electrical content to every new hull. High installation costs and the work of fitting new systems into older ships slow the pace.
Drivers Impact Analysis
| DRIVER | (~) % IMPACT ON CAGR | GEOGRAPHIC RELEVANCE | IMPACT TIMELINE |
|---|---|---|---|
| Commercial shipbuilding and new vessel construction | +2.2% | Global, East Asia, Europe | Medium term (2-4 years) |
| Naval fleet modernization and new defense vessels | +1.5% | North America, Europe, Asia-Pacific | Long term (>=4 years) |
| Adoption of hybrid propulsion and onboard electrical architectures | +1.2% | Europe, East Asia, North America | Medium term (2-4 years) |
| Offshore oil and gas operations requiring specialized vessels | +1.0% | Latin America, North America, Middle East | Medium term (2-4 years) |
| Integration of power management and monitoring systems | +0.9% | Global | Short term (<=2 years) |
Source: Fact.MR analysis. Updated Nov 6, 2026
Opportunity Impact Analysis
| OPPORTUNITY | (~) % IMPACT ON CAGR | GEOGRAPHIC RELEVANCE | IMPACT TIMELINE |
|---|---|---|---|
| Integrated hybrid AC/DC marine power architectures | +1.1% | Europe, East Asia, North America | Medium term (2-4 years) |
| Shore-side electricity infrastructure across commercial ports | +0.9% | Western Europe, North America, Asia-Pacific | Medium term (2-4 years) |
| Modular power systems for offshore and specialized vessels | +0.7% | Latin America, North America, Middle East | Long term (>=4 years) |
| High-efficiency power conversion and energy storage technologies | +0.5% | Global | Long term (>=4 years) |
Source: Fact.MR analysis. Updated Nov 6, 2026
Restraints Impact Analysis
| RESTRAINT | (~) % IMPACT ON CAGR | GEOGRAPHIC RELEVANCE | IMPACT TIMELINE |
|---|---|---|---|
| High initial investment in marine electrical power infrastructure | -1.3% | Global | Short term (<=2 years) |
| Complex integration of electrical systems with existing vessel architecture | -0.9% | Global | Medium term (2-4 years) |
| Limited shore-power infrastructure and grid capacity at smaller ports | -0.6% | Emerging markets, Latin America, Asia-Pacific | Medium term (2-4 years) |
| Specialized maintenance needs and shortage of skilled marine electrical technicians | -0.4% | Global | Long term (>=4 years) |
Source: Fact.MR analysis. Updated Nov 6, 2026
Which countries are scaling the Advanced Marine Power Supply Market through 2036?
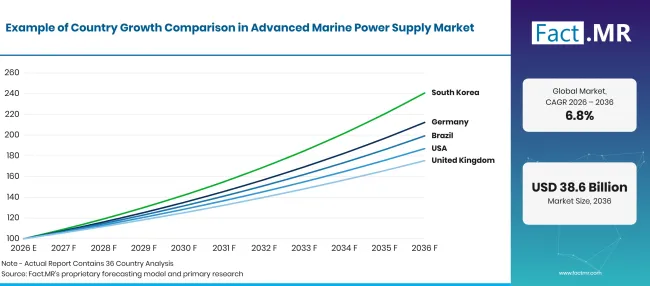
Advanced Marine Power Supply Market Growth Index | Source: Fact.MR
| Country | CAGR (2026 to 2036) |
|---|---|
| Germany | 7.8% |
| Brazil | 7.1% |
| United States | 6.5% |
| United Kingdom | 5.8% |
| Japan | 5.1% |
Source: Fact.MR analysis. Updated Nov 6, 2026
What supports adoption in Germany?
7.8% CAGR, driven by port electrification and specialist ship engineering.
The Port of Kiel completed its shore power expansion in September 2025, and it can now supply seven seagoing vessels at once, including three cruise ships [5]. The port reports an investment of EUR 50 million in shore power in recent years. Projects of this size need high-voltage converters and cable systems on the quay, along with matching connection panels on the ships that call there. Specialist German yards add steady demand for integrated electrical packages.
How is Brazil developing demand?
7.1% CAGR, backed by state-financed offshore vessel construction.
In September 2025, the Merchant Marine Fund committed R$ 2.5 billion through BNDES to build eight vessels at the Detroit Brasil yard in Itajaí [6]. The order covers four platform supply vessels and four oil spill recovery vessels with diesel-electric propulsion and lithium-ion battery banks. Petrobras will charter the ships for 12 years once delivered. Orders like this place hybrid power systems at the centre of Brazil’s offshore fleet renewal.
What is shaping the United States’ adoption?
6.5% CAGR, helped by federal port grants and naval shipbuilding.
The Maritime Administration announced the recipients of its FY 2026 Port Infrastructure Development Program on October 27, 2026, with USD 497.9 million available for port projects [7]. Grants of this kind fund cargo handling upgrades and electrical infrastructure at the berth. Naval programmes add demand for medium-voltage distribution and power conversion with high redundancy.
What supports adoption in the United Kingdom?
5.8% CAGR, reflecting firm targets for maritime decarbonisation.
The Department for Transport’s Maritime Decarbonisation Strategy, published in March 2025, sets a cut of at least 30% in fuel lifecycle greenhouse gas emissions by 2030 against 2008 levels. It then targets 80% by 2040 and zero by 2050 [8]. These milestones push ferry, crew transfer and port service operators toward battery hybrids and shore connections.
How does Japan perform?
5.1% CAGR, owing to public support for zero-emission ship production.
In January 2025, the Ministry of the Environment selected 16 projects under its zero-emission vessel construction programme [9]. The programme supports domestic production of ships that run on hydrogen, ammonia, LNG, methanol or battery power. In August 2026 the Ministry of Land, Infrastructure, Transport and Tourism selected four more projects that will bring about JPY 205 billion of investment in shipbuilding and marine equipment production [10]. Japanese yards will turn this capacity into battery and hybrid vessels over the forecast period.
Who leads the Advanced Marine Power Supply Market?
Competition divides into electrical integrators and engine-based power suppliers. ABB, Siemens Energy, GE Vernova and Kongsberg Maritime design the full electrical chain from switchboards and drives to energy management. They win on integration skill and class approval. ABB will supply its Onboard DC Grid platform as the core of an integrated power system for shuttle tankers ordered at Samsung Heavy Industries, as announced in June 2025 [11].
Wärtsilä spans both camps. In August 2025 it took the electrical integrator role for a major battery hybrid upgrade on the ferry Aurora Botnia [12]. Rolls-Royce, Everllence and Caterpillar supply generator sets and engines, where fuel flexibility and service networks decide orders. Rolls-Royce widened its variable-speed mtu marine generator set range in August 2026 for offshore vessels, ferries and yachts [13]. Suppliers able to tie generation, storage and shore connection into one controllable network will hold the edge in newbuild tenders.
Which companies are the key providers?
Key companies profiled include ABB; Siemens Energy; GE Vernova; Kongsberg Maritime; Wärtsilä; Rolls-Royce; Everllence; and Caterpillar.
- ABB
- Siemens Energy
- GE Vernova
- Kongsberg Maritime
- Wärtsilä
- Rolls-Royce
- Everllence
- Caterpillar
Bibliography
- [1] International Maritime Organization. (2026, January). Draft workplan agreed on safety rules for battery, wind and nuclear-powered ships.
- [2] Department for Transport. (2025, July 24). £30 million to decarbonise shipping, boost careers and deliver growth across the UK.
- [3] Port of Hamburg. (2025, June 4). Hamburg Port Authority and Ocean Network Express Sign Agreement to Supply Container ships with shore power.
- [4] European Maritime Safety Agency. (2025, November 11). Shore-Side Electricity: Guidance to Port Authorities and Administrations.
- [5] Port of Kiel. (2025, September 9). Shore power system completed.
- [6] Ministério de Portos e Aeroportos. (2025, September 24). Estaleiro em Itajaí (SC) receberá investimento de R$ 2,5 bilhões do Fundo da Marinha Mercante para novas embarcações.
- [7] Maritime Administration. (2026, October 27). Port Infrastructure Development Program.
- [8] Department for Transport. (2025, March 25). Maritime decarbonisation strategy.
- [9] Ministry of the Environment, Japan. (2025, January 9). .
- [10] Ministry of Land, Infrastructure, Transport and Tourism. (2026, August 17). .
- [11] ABB. (2025, June 30). ABB to supply integrated power system for nine shuttle tankers.
- [12] Wärtsilä. (2025, August 27). Wärtsilä and Wasaline’s close cooperation continues with world’s largest marine battery hybrid system project.
- [13] Rolls-Royce. (2026, August 31). More flexible, more efficient, electric: Rolls-Royce expands its portfolio of variable-speed marine generator sets.
This Report Answers
- How is revenue split among AC, DC and hybrid power supply systems on board?
- Why do commercial vessels hold the top application position, and where do naval and offshore fleets fit?
- What keeps the 1-5 MW range ahead of smaller and larger ratings?
- How does the shipyard’s role in specifying power systems shape purchasing?
- What do port electrification, battery rules and public funding mean for Germany, Brazil, the United States, the United Kingdom and Japan?
- Which supplier groups compete for integrated vessel power contracts, and what will set them apart?
What does the Advanced Marine Power Supply Market cover?
This market tracks the electrical systems that generate, convert, store, distribute and manage power on ships. AC power supply, DC power supply and hybrid power supply form the three product groups.
Value is counted at the system level across commercial, defense, offshore and recreational vessels. Power output bands run from up to 1 MW through 1-5 MW to above 5 MW. End users include shipbuilders, oil and gas operators, navies and others.
What is included in the scope?
Marine generator sets sold as part of an onboard power system are included.
Main and emergency switchboards, transformers, frequency converters and drives fall within the boundary.Battery systems built on lithium-ion battery cells, together with their control units, are counted when installed as part of the vessel power network.Power management software and ship-side shore connection equipment are also covered.
What is excluded from the scope?
Main engines sold for mechanical propulsion only, without an electrical generation function, are outside the boundary.
Shore-side civil works, port substations and grid connection charges are left out.Shipbuilding labour, vessel construction charges and freight revenue are not counted.Fuel, lubricants and general maintenance services do not form part of the market.
How Was the Analysis Built?
The analysis draws on 120+ sources, 35+ company portfolios, 25+ countries, and more than 20 industry interviews.
- Primary Research: Primary research includes discussions with manufacturers, service providers, technology developers, distributors, end users, and subject-matter experts. These conversations examine purchasing priorities, product adoption, operational challenges, approval requirements, competitive positioning, and the factors that influence wider market acceptance.
- Desk Research: Desk research covers government statistics, regulatory publications, company filings, trade data, technical studies, industry associations, standards, public policy, and other authoritative sources. Every source used in the analysis is documented in the bibliography.
- Market Sizing and Forecasting: Market estimates combine historical performance, demand indicators, pricing and volume trends, segment shares, company participation, country-level growth, adoption patterns, investment activity, and barriers to market expansion.
- Data Validation and Update Cycle: Findings are validated by comparing primary interviews with public data, company activity, regulatory changes, trade patterns, and industry developments. Regular updates review new product launches, capacity changes, partnerships, approvals, and shifts in commercial adoption.
Segmentation
What is the report’s scope and coverage?
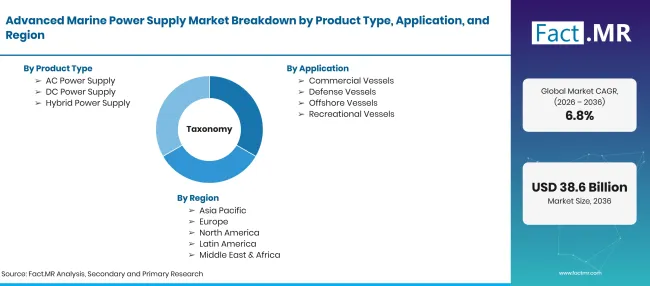
Advanced Marine Power Supply Market Taxonomy | Source: Fact.MR
| Attribute | Details |
|---|---|
| Quantitative Units | USD billion |
| Market Definition | Electrical systems that generate, convert, store, distribute and manage power on commercial, defense, offshore and recreational vessels, covering AC, DC and hybrid power supply. |
| Product Type | AC Power Supply; DC Power Supply; Hybrid Power Supply |
| Application | Commercial Vessels; Defense Vessels; Offshore Vessels; Recreational Vessels |
| Power Output | Up to 1 MW; 1-5 MW; Above 5 MW |
| End-User | Shipbuilding; Oil & Gas; Defense; Others |
| Regions Covered | North America; Latin America; Western Europe; Eastern Europe; East Asia; South Asia & Pacific; Middle East & Africa |
| Countries Covered | Germany; Brazil; United States; United Kingdom; Japan |
| Companies Profiled | ABB; Siemens Energy; GE Vernova; Kongsberg Maritime; Wärtsilä; Rolls-Royce; Everllence; Caterpillar |
| Forecast Period | 2026 to 2036 |
| Approach | Hybrid top-down and bottom-up model built from vessel construction by country, onboard electrical load per vessel class, application and power output mix, end-user demand and supplier portfolio review. |
Source: Fact.MR analysis. Updated Nov 6, 2026
How is the market segmented?
-
By Product Type
- AC Power Supply
- DC Power Supply
- Hybrid Power Supply
-
By Application
- Commercial Vessels
- Defense Vessels
- Offshore Vessels
- Recreational Vessels
-
By Power Output
- Up to 1 MW
- 1-5 MW
- Above 5 MW
-
By End-User
- Shipbuilding
- Oil & Gas
- Defense
- Others
-
By Region
- North America
- Latin America
- Western Europe
- Eastern Europe
- East Asia
- South Asia & Pacific
- Middle East & Africa
Frequently Asked Questions
How large is the Advanced Marine Power Supply Market in 2026?
What growth rate will the Advanced Marine Power Supply Market record from 2026 to 2036?
Which product type leads the Advanced Marine Power Supply Market?
Which application holds the greatest share?
Which power output category leads?
Which end-user contributes the most?
Which country will grow quickest?
Who are the main companies?
What holds the market back?
Who worked on this report


Preview the report firsthand - request a free sample
Free SampleGet the brochure for pricing and purchase details
Download PDF