U.S. Scrap Metal Recycling Market
U.S. Scrap Metal Recycling Market Analysis, By Metal Type, By Scrap, By Recycling Type, By End-User, and Region - Market Insights 2025 to 2035
The Shredding segment is projected to grow at a CAGR of 6.4%, whereas another segment Shearing is likely to grow at 4.9%. In terms of regions, Southwest U.S. is projected to grow at 6.6%, followed by West U.S. at 6.2% and Midwest U.S. to grow at 5%.
U.S. Scrap Metal Recycling Market Outlook (2025 to 2035)
The U.S. Scrap Metal Recycling market is expected to reach USD 18,472 million by 2035, up from USD 10,284 million in 2024. During the forecast period 2025 to 2035, the industry is projected to expand at a CAGR of 5.5%.
The U.S. scrap metal recycling market is propelled by growing industrial demand for sustainable, cost-effective raw materials, reinforced government incentives, steelmaking electrification, and green initiatives in the automotive and construction sectors.
Metric | Value |
---|---|
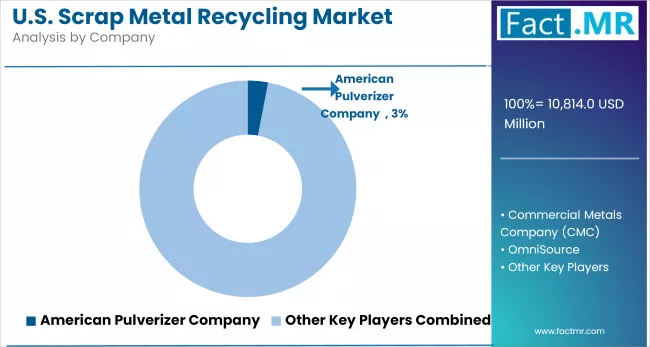
Estimated Size in 2025 | USD 10,814 Million |
Projected Size in 2035 | USD 18,472 million |
CAGR (2025 to 2035) | 5.5% |
What are the drivers of the U.S. Scrap Metal Recycling Market?
The U.S. scrap metal recycling market is advancing steadily due to a combination of regulatory, economic, and environmental factors. The manufacturing industry is shifting towards sustainable production, and recycled metal is an effective and versatile alternative to virgin materials. This transition is particularly evident in steelmaking, where electric arc furnace (EAF) operations are accelerating demand for high-quality ferrous scrap.
The automotive and construction industries continue to be major end-use markets, and the momentum is shifting towards lightweighting, emissions reduction, and green building certification. The incorporation of more recycled aluminum and steel into the supply chains of these industries is being improved to meet environmental objectives and reduce dependence on raw materials.
Additionally, there are policy incentives encouraging recycling infrastructure and extended product liability models at the federal and state levels. These actions are stimulating the investment into high-level sorting equipment and logistics streamlining to increase the level of recovery.
Moreover, the increased demand of consumers and companies for sustainable products is strengthening the emphasis on recycled materials in production. Collectively, these factors are establishing a solid foundation for future prosperity in the U.S. scrap metal recycling sector.
What are the regional trends of the U.S. Scrap Metal Recycling Market?
The market for recycling scrap metal in the United States is experiencing regional growth dynamics driven by the sustainability trend, industrial demand, and infrastructure development. In the West U.S., momentum is building steadily due to progressive environmental agendas and a heightened focus on material recovery. Industrial and municipal operators are adopting advanced recycling technologies to align with circular economy goals and reduce landfill usage and carbon emissions.
The South-west U.S. is also gaining momentum to become substantial, with commercial construction and infrastructure development serving as the driving force. As the price volatility of raw materials increases, industries in this region are investing in an efficient system of metal recovery to enhance cost optimization and sustainability levels.
The Midwest U.S. remains the market’s stronghold, underpinned by a robust manufacturing ecosystem and integration with domestic steel and automotive industries. Its established network of processors and end-users ensures operational efficiency and consistent demand for both ferrous and non-ferrous scrap.
In the Northeast U.S., scrap generation is high due to urban redevelopment and industrial refurbishment. While zero-waste initiatives are reinforcing recycling, facility expansion constraints could moderate growth.
The Southeast U.S. is rapidly scaling its recycling operations, supported by industrial investment, port infrastructure, and low-carbon steel production. A favorable business climate and modern facilities are driving large-scale scrap consumption across the region.
What are the challenges and restraining factors of the U.S. Scrap Metal Recycling Market?
The U.S. scrap metal recycling market is facing several structural challenges that hinder efficiency and long-term scalability. A major concern is the persistent volatility in metal prices, especially steel, copper, and aluminum. Fluctuating commodity prices disrupt planning cycles and discourage capital investment, particularly for mid-sized recyclers that lack the financial capacity to hedge against market swings.
The interest in technological disparity across various facilities also hinders development. Although a few operators have adopted the use of more advanced sorting and shredding facilities, not many have done so. Due to this technology gap, productivity declines, contamination risks rise, and the value of the materials decreases.
Labor shortages also present ongoing difficulties. Skilled workers for dismantling, separation, and machine operation are in short supply. Attracting talent is becoming increasingly difficult due to concerns about workplace safety, limited advancement opportunities, and rising wage demands.
Regulatory compliance adds another layer of complexity. Recyclers must meet stringent environmental standards for emissions, noise, runoff, and material handling. Yet, the absence of cohesive national recycling policies creates regulatory uncertainty and inconsistency across states.
Moreover, the increasing complexity of consumer products, such as electronics and hybrid composites, complicates sorting processes. These new material blends require sophisticated recovery systems, demanding significant capital outlays and long-term technological adaptation to remain economically viable.
Region-Wise Insights
Region | CAGR (2025 to 2035) |
---|---|
Southwest U.S. | 6.6% |
West U.S. | 6.2% |
Midwest U.S. | 5.0% |
Clean Energy and Urban Growth Drive Recycling in Southwest U.S.
Scrap metal recycling is gaining significant traction in the Southwest US, fueled by rapid urban development and growing investment in renewable energy. A surge in construction and redevelopment projects is generating a steady flow of recyclable ferrous and non-ferrous metals. At the same time, the region’s expanding solar and wind energy sectors are boosting demand for secondary metals like copper and aluminum, which are critical for clean energy infrastructure.
Supportive policy measures and grant-backed recycling programs are incentivizing processors to upgrade facilities with AI-based sorting and automation, enhancing recovery efficiency. Industrial zones and logistic corridors are optimizing intra-regional scrap flow and export readiness. With both environmental and economic factors aligning, the region is positioning itself as a key player in the national circular economy, balancing infrastructure growth with resource sustainability. The integration of smart technology and supportive regulation continues to accelerate Southwest’s transition toward modernized metal recovery systems.
Policy and Innovation Strengthen Metal Recycling in West U.S.
The West US stands out in the scrap metal recycling landscape due to its strict environmental regulations and rapid adoption of advanced processing technologies. Legislation targeting waste reduction and producer accountability has intensified efforts to recover and repurpose scrap metals across industrial sectors. Facilities in the region are deploying AI-enhanced sorting systems, robotic separation units, and low-emission processing lines to meet stringent recovery benchmarks. High demand for recycled materials in construction, tech manufacturing, and green infrastructure is driving consistent throughput.
Export-oriented ports bolster regional scrap flow to international buyers, adding resilience to market dynamics. Public awareness and business alignment around low-carbon, circular materials further reinforce the recycling ecosystem. With innovation embedded into its policy and operational framework, the West is redefining efficiency and compliance in metal recovery. The region’s leadership continues to influence national standards and shape the evolution of a tech-forward, sustainable recycling industry.
Industry and Infrastructure Fuel Recycling Momentum in Midwest U.S.
The Midwest US is strengthening its role in the national scrap metal recycling market, bolstered by a legacy of manufacturing and a surge in infrastructure investment. Heavy industries in the region continue to generate sizable scrap volumes, particularly from machinery, transportation, and industrial equipment. Current federal infrastructure funding is adding to this flow through projects involving road, bridge, and utility upgrades.
Recycling facilities are undergoing modernization, integrating automated sorting, energy-efficient furnaces, and material tracking systems to boost operational performance. The region’s central location and robust transportation networks facilitate streamlined distribution and processing logistics.
Municipal and industry-led collection programs are enhancing scrap intake, particularly in urban areas. The growing interest in using recycled content for new manufacturing aligns with climate goals and enhances the region’s strategic relevance. As modernization efforts scale, the Midwest is emerging as a key pillar in the US circular economy, merging economic revitalization with sustainable materials management.
Category-Wise Analysis
High-Quality Feedstock and Efficiency Gains Accelerate Ferrous Metal Use
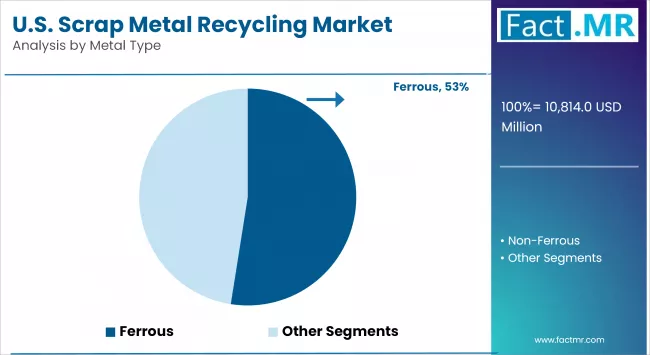
Ferrous metals are gaining renewed momentum in the U.S. scrap recycling industry due to their abundance, cost-effectiveness, and critical role in infrastructure and manufacturing. As steel-intensive sectors such as automotive, construction, and transportation rebound, the demand for ferrous scrap is rising steadily. These metals serve as a reliable feedstock for electric arc furnaces (EAFs), which are gaining popularity due to their lower carbon emissions compared to traditional blast furnaces.
Increased adoption of circular production models by manufacturers is also enhancing the value proposition of ferrous recycling. Innovations in magnetic separation and sensor-based sorting have improved material purity and yield.
Additionally, domestic mills prefer ferrous scrap due to its lower logistics costs and compliance with emission regulations, further fueling its uptake. As the U.S. emphasizes decarbonization in the heavy industry sector, ferrous metals are emerging as a strategic input that supports both industrial growth and sustainability mandates.
Automation and Material Recovery Efficiency Boost Shredding Adoption
Shredding has become a core process in scrap metal recycling, offering scalable and efficient handling of complex, mixed-material inputs. It is especially effective for processing end-of-life vehicles, white goods, and construction waste, breaking down bulky materials into uniform fragments that can be easily sorted and refined. The adoption of high-efficiency, low-speed shredders is helping reduce energy consumption while maintaining high output rates. Facilities are increasingly integrating shredders with advanced downstream separation systems such as magnetic sorters, eddy current separators, and air classifiers to improve metal recovery and purity.
Digital controls and real-time performance monitoring are also enhancing throughput and minimizing downtime. With demand rising for clean, recyclable inputs across automotive, construction, and infrastructure sectors, shredding is a vital enabler of modern recycling operations. Its ability to support high-volume processing while improving material quality makes it a key driver in the scaling of circular manufacturing in the U.S.
EV Shift and Light Weighting Trends Drive Scrap Demand in Automotive
The automotive sector remains a dominant end-user of recycled metals, with scrap playing a central role in enabling cost and sustainability goals across the supply chain. With automakers under pressure to reduce emissions and embrace circular practices, recycled ferrous and non-ferrous metals are being increasingly integrated into vehicle manufacturing. Aluminum and high-strength steel are especially in demand due to their use in electric vehicles (EVs), which prioritize lightweight construction.
Automakers are also collaborating with recyclers to recover production scrap and end-of-life vehicle components, boosting the role of closed-loop systems. Furthermore, upcoming federal vehicle efficiency and recycling regulations are incentivizing the use of secondary materials. Advances in metal separation technologies are ensuring automotive-grade purity from scrap inputs, supporting their direct use in the body, chassis, and structural components. As vehicle platforms transition toward electrification and sustainability, the automotive sector will remain a cornerstone of U.S. scrap metal consumption.
Competitive Analysis
Key players in the U.S. scrap metal recycling industry include American Pulverizer Company, Commercial Metals Company (CMC), OmniSource, Metal Management Inc., Tube City Inc., Philip Metals, Hugo Neu, Sims Metal (formerly Simsmetal), Samuel Recycling, and DBW Metals Recycling.
The scrap metal recycling market is growing due to the rising demand for sustainable raw materials in the automotive, construction, and industrial sectors. Increasing environmental regulations and focus on circular economy models are driving operational shifts.
Technological innovations, such as automated shredding, sensor-based sorting, and AI-driven processing, are enhancing efficiency and purity. Companies are adopting energy-efficient, low-emission systems to boost sustainability. This evolving landscape is encouraging recyclers to enhance their logistics, invest in technology, and establish robust supply partnerships to meet the increasing demands of end-users.
Recent Development
- In March 2025, TOMRA introduced a deep learning-based solution to enhance sorting accuracy in wrought aluminum scrap recycling. Utilizing AI-driven object recognition, the technology enhances purity, boosts recovery, and facilitates low-carbon secondary aluminum production, enabling recyclers to meet the growing demand for sustainable, high-quality metal.
Fact.MR has provided detailed information about the price points of key manufacturers in the U.S. Scrap Metal Recycling Market, positioned across regions, including sales growth, production capacity, and speculative technological expansion, as recently published in the report.
Methodology and Industry Tracking Approach
Fact.MR’s 2025 U.S. scrap metal recycling market report draws from insights provided by 10,200 stakeholders across 30 countries, with at least 280 participants per market. Approximately 58% of responses were gathered from producers and end-users, including scrap yard operators, smelters, and secondary metal manufacturers. The remaining 42% comprised industry professionals, including sustainability advisors, regulatory officers, and supply chain managers. The research was conducted from June 2024 to May 2025, focusing on demand trends, recycling efficiency, capital investments, regulatory shifts, and value chain risks. Data was weighted according to regional recycling volumes and trade activity.
The report is based on an analysis of over 270 sources, including regulatory documents, technical journals, financial statements, and environmental filings. Techniques such as correlation analysis and time-series modeling were applied. Since 2018, Fact.MR has tracked recycling trends, making this a trusted resource for industry participants and policymakers.
Segmentation of U.S. Scrap Metal Recycling Market
-
By Metal Type :
- Ferrous
- Stainless Steel
- Carbon Steel
- Mild Steel
- Cast Iron
- Non-Ferrous
- Aluminum
- Copper
- Lead
- Nickel
- Zinc
- Brass
- Tin
- Gold
- Others
- Ferrous
-
By Scrap :
- New Scrap
- Old Scrap
-
By Recycling Type :
- Shearing
- Shredding
- Bailing
-
By End-User :
- Automotive
- Shipbuilding
- Construction
- Mining
- Railway & Transportation
- Aerospace & Defense
- Oil & Gas
- Heavy Equipment
- Others
-
By Region :
- West U.S.
- Southwest U.S.
- Midwest U.S.
- Northeast U.S.
- Southeast U.S.
Table of Content
- Executive Summary
- U.S. Market Outlook
- Demand-side Trends
- Supply-side Trends
- Technology Roadmap Analysis
- Analysis and Recommendations
- Market Overview
- Market Coverage / Taxonomy
- Market Definition / Scope / Limitations
- Market Background
- Market Dynamics
- Drivers
- Restraints
- Opportunity
- Trends
- Scenario Forecast
- Demand in Optimistic Scenario
- Demand in Likely Scenario
- Demand in Conservative Scenario
- Opportunity Map Analysis
- Product Life Cycle Analysis
- Supply Chain Analysis
- Supply Side Participants and their Roles
- Producers
- Mid-Level Participants (Traders/ Agents/ Brokers)
- Wholesalers and Distributors
- Value Added and Value Created at Node in the Supply Chain
- List of Raw Material Suppliers
- List of Existing and Potential Buyers
- Supply Side Participants and their Roles
- Investment Feasibility Matrix
- Value Chain Analysis
- Profit Margin Analysis
- Wholesalers and Distributors
- PESTLE and Porter’s Analysis
- Regulatory Landscape
- By Key Regions
- By Key Countries
- Production and Consumption Statistics
- Import and Export Statistics
- Market Dynamics
- Market Analysis 2020 to 2024 and Forecast, 2025 to 2035
- Historical Market Size Value (USD Mn) & Volume (Tons) Analysis, 2020 to 2024
- Current and Future Market Size Value (USD Mn) & Volume (Tons) Projections, 2025 to 2035
- Y-o-Y Growth Trend Analysis
- Absolute $ Opportunity Analysis
- Market Pricing Analysis 2020 to 2024 and Forecast 2025 to 2035
- Market Analysis 2020 to 2024 and Forecast 2025 to 2035, By Metal Type
- Introduction / Key Findings
- Historical Market Size Value (USD Mn) & Volume (Tons) Analysis By Metal Type, 2020 to 2024
- Current and Future Market Size Value (USD Mn) & Volume (Tons) Analysis and Forecast By Metal Type, 2025 to 2035
- Ferrous
- Stainless Steel
- Carbon Steel
- Mild Steel
- Cast Iron
- Non-Ferrous
- Aluminum
- Copper
- Lead
- Nickel
- Zinc
- Brass
- Tin
- Gold
- Others
- Ferrous
- Y-o-Y Growth Trend Analysis By Metal Type, 2020 to 2024
- Absolute $ Opportunity Analysis By Metal Type, 2025 to 2035
- Market Analysis 2020 to 2024 and Forecast 2025 to 2035, By Scrap
- Introduction / Key Findings
- Historical Market Size Value (USD Mn) & Volume (Tons) Analysis By Scrap, 2020 to 2024
- Current and Future Market Size Value (USD Mn) & Volume (Tons) Analysis and Forecast By Scrap, 2025 to 2035
- New Scrap
- Old Scrap
- Y-o-Y Growth Trend Analysis By Scrap, 2020 to 2024
- Absolute $ Opportunity Analysis By Scrap, 2025 to 2035
- Market Analysis 2020 to 2024 and Forecast 2025 to 2035, By Recycling Type
- Introduction / Key Findings
- Historical Market Size Value (USD Mn) & Volume (Tons) Analysis By Recycling Type, 2020 to 2024
- Current and Future Market Size Value (USD Mn) & Volume (Tons) Analysis and Forecast By Recycling Type, 2025 to 2035
- Shearing
- Shredding
- Bailing
- Y-o-Y Growth Trend Analysis By Recycling Type, 2020 to 2024
- Absolute $ Opportunity Analysis By Recycling Type, 2025 to 2035
- Market Analysis 2020 to 2024 and Forecast 2025 to 2035, By End-User
- Introduction / Key Findings
- Historical Market Size Value (USD Mn) & Volume (Tons) Analysis By End-User, 2020 to 2024
- Current and Future Market Size Value (USD Mn) & Volume (Tons) Analysis and Forecast By End-User, 2025 to 2035
- Automotive
- Shipbuilding
- Construction
- Mining
- Railway & Transportation
- Aerospace & Defense
- Oil & Gas
- Heavy Equipment
- Others
- Y-o-Y Growth Trend Analysis By End-User, 2020 to 2024
- Absolute $ Opportunity Analysis By End-User, 2025 to 2035
- Market Analysis 2020 to 2024 and Forecast 2025 to 2035, By Region
- Introduction
- Historical Market Size Value (USD Mn) & Volume (Tons) Analysis By Region, 2020 to 2024
- Current Market Size Value (USD Mn) & Volume (Tons) Analysis and Forecast By Region, 2025 to 2035
- West U.S.
- Southwest U.S.
- Midwest U.S.
- Northeast U.S.
- Southeast U.S.
- Market Attractiveness Analysis By Region
- West Market Analysis 2020 to 2024 and Forecast 2025 to 2035, By States
- Historical Market Size Value (USD Mn) & Volume (Tons) Trend Analysis By Market Taxonomy, 2020 to 2024
- Market Size Value (USD Mn) & Volume (Tons) Forecast By Market Taxonomy, 2025 to 2035
- By States
- By Metal Type
- By Scrap
- By Recycling Type
- By End-User
- Market Attractiveness Analysis
- By States
- By Metal Type
- By Scrap
- By Recycling Type
- By End-User
- Key Takeaways
- Southwest Market Analysis 2020 to 2024 and Forecast 2025 to 2035, By States
- Historical Market Size Value (USD Mn) & Volume (Tons) Trend Analysis By Market Taxonomy, 2020 to 2024
- Market Size Value (USD Mn) & Volume (Tons) Forecast By Market Taxonomy, 2025 to 2035
- By States
- By Metal Type
- By Scrap
- By Recycling Type
- By End-User
- Market Attractiveness Analysis
- By States
- By Metal Type
- By Scrap
- By Recycling Type
- By End-User
- Key Takeaways
- Midwest Market Analysis 2020 to 2024 and Forecast 2025 to 2035, By States
- Historical Market Size Value (USD Mn) & Volume (Tons) Trend Analysis By Market Taxonomy, 2020 to 2024
- Market Size Value (USD Mn) & Volume (Tons) Forecast By Market Taxonomy, 2025 to 2035
- By States
- By Metal Type
- By Scrap
- By Recycling Type
- By End-User
- Market Attractiveness Analysis
- By States
- By Metal Type
- By Scrap
- By Recycling Type
- By End-User
- Key Takeaways
- Northeast Market Analysis 2020 to 2024 and Forecast 2025 to 2035, By States
- Historical Market Size Value (USD Mn) & Volume (Tons) Trend Analysis By Market Taxonomy, 2020 to 2024
- Market Size Value (USD Mn) & Volume (Tons) Forecast By Market Taxonomy, 2025 to 2035
- By States
- By Metal Type
- By Scrap
- By Recycling Type
- By End-User
- Market Attractiveness Analysis
- By States
- By Metal Type
- By Scrap
- By Recycling Type
- By End-User
- Key Takeaways
- Southeast Market Analysis 2020 to 2024 and Forecast 2025 to 2035, By States
- Historical Market Size Value (USD Mn) & Volume (Tons) Trend Analysis By Market Taxonomy, 2020 to 2024
- Market Size Value (USD Mn) & Volume (Tons) Forecast By Market Taxonomy, 2025 to 2035
- By States
- By Metal Type
- By Scrap
- By Recycling Type
- By End-User
- Market Attractiveness Analysis
- By States
- By Metal Type
- By Scrap
- By Recycling Type
- By End-User
- Key Takeaways
- Key Regions Market Analysis
- West U.S.
- Pricing Analysis
- Market Share Analysis, 2024
- By Metal Type
- By Scrap
- By Recycling Type
- By End-User
- Southwest U.S.
- Pricing Analysis
- Market Share Analysis, 2024
- By Metal Type
- By Scrap
- By Recycling Type
- By End-User
- Midwest U.S.
- Pricing Analysis
- Market Share Analysis, 2024
- By Metal Type
- By Scrap
- By Recycling Type
- By End-User
- Northeast U.S.
- Pricing Analysis
- Market Share Analysis, 2024
- By Metal Type
- By Scrap
- By Recycling Type
- By End-User
- Southeast U.S.
- Pricing Analysis
- Market Share Analysis, 2024
- By Metal Type
- By Scrap
- By Recycling Type
- By End-User
- West U.S.
- Market Structure Analysis
- Competition Dashboard
- Competition Benchmarking
- Market Share Analysis of Top Players
- By Regional
- By Metal Type
- By Scrap
- By Recycling Type
- By End-User
- Competition Analysis
- Competition Deep Dive
- American Pulverizer Company
- Overview
- Product Portfolio
- Profitability by Market Segments (Product/Age /Sales Channel/Region)
- Sales Footprint
- Strategy Overview
- Marketing Strategy
- Product Strategy
- Channel Strategy
- Commercial Metals Company (CMC)
- Overview
- Product Portfolio
- Profitability by Market Segments (Product/Age /Sales Channel/Region)
- Sales Footprint
- Strategy Overview
- Marketing Strategy
- Product Strategy
- Channel Strategy
- OmniSource
- Overview
- Product Portfolio
- Profitability by Market Segments (Product/Age /Sales Channel/Region)
- Sales Footprint
- Strategy Overview
- Marketing Strategy
- Product Strategy
- Channel Strategy
- Metal Management Inc.
- Overview
- Product Portfolio
- Profitability by Market Segments (Product/Age /Sales Channel/Region)
- Sales Footprint
- Strategy Overview
- Marketing Strategy
- Product Strategy
- Channel Strategy
- Tube City Inc.
- Overview
- Product Portfolio
- Profitability by Market Segments (Product/Age /Sales Channel/Region)
- Sales Footprint
- Strategy Overview
- Marketing Strategy
- Product Strategy
- Channel Strategy
- Philip Metals
- Overview
- Product Portfolio
- Profitability by Market Segments (Product/Age /Sales Channel/Region)
- Sales Footprint
- Strategy Overview
- Marketing Strategy
- Product Strategy
- Channel Strategy
- Hugo Neu
- Overview
- Product Portfolio
- Profitability by Market Segments (Product/Age /Sales Channel/Region)
- Sales Footprint
- Strategy Overview
- Marketing Strategy
- Product Strategy
- Channel Strategy
- Sims Metal (formerly Simsmetal)
- Overview
- Product Portfolio
- Profitability by Market Segments (Product/Age /Sales Channel/Region)
- Sales Footprint
- Strategy Overview
- Marketing Strategy
- Product Strategy
- Channel Strategy
- Samuel Recycling
- Overview
- Product Portfolio
- Profitability by Market Segments (Product/Age /Sales Channel/Region)
- Sales Footprint
- Strategy Overview
- Marketing Strategy
- Product Strategy
- Channel Strategy
- DBW Metals Recycling
- Overview
- Product Portfolio
- Profitability by Market Segments (Product/Age /Sales Channel/Region)
- Sales Footprint
- Strategy Overview
- Marketing Strategy
- Product Strategy
- Channel Strategy
- Framingham Salvage Company
- Overview
- Product Portfolio
- Profitability by Market Segments (Product/Age /Sales Channel/Region)
- Sales Footprint
- Strategy Overview
- Marketing Strategy
- Product Strategy
- Channel Strategy
- Gershow Recycling
- Overview
- Product Portfolio
- Profitability by Market Segments (Product/Age /Sales Channel/Region)
- Sales Footprint
- Strategy Overview
- Marketing Strategy
- Product Strategy
- Channel Strategy
- Hindalco Novelis
- Overview
- Product Portfolio
- Profitability by Market Segments (Product/Age /Sales Channel/Region)
- Sales Footprint
- Strategy Overview
- Marketing Strategy
- Product Strategy
- Channel Strategy
- Matalco Inc.
- Overview
- Product Portfolio
- Profitability by Market Segments (Product/Age /Sales Channel/Region)
- Sales Footprint
- Strategy Overview
- Marketing Strategy
- Product Strategy
- Channel Strategy
- North Star Recycling
- Overview
- Product Portfolio
- Profitability by Market Segments (Product/Age /Sales Channel/Region)
- Sales Footprint
- Strategy Overview
- Marketing Strategy
- Product Strategy
- Channel Strategy
- Nucor Corporation
- Overview
- Product Portfolio
- Profitability by Market Segments (Product/Age /Sales Channel/Region)
- Sales Footprint
- Strategy Overview
- Marketing Strategy
- Product Strategy
- Channel Strategy
- Alter Scrap Processing Co.
- Overview
- Product Portfolio
- Profitability by Market Segments (Product/Age /Sales Channel/Region)
- Sales Footprint
- Strategy Overview
- Marketing Strategy
- Product Strategy
- Channel Strategy
- American Pulverizer Company
- Competition Deep Dive
- Assumptions & Acronyms Used
- Research Methodology
List Of Table
- Table 1: Market Value (USD Mn) Forecast by Region, 2020 to 2035
- Table 2: Market Volume (Tons) Forecast by Region, 2020 to 2035
- Table 3: Market Value (USD Mn) Forecast by Metal Type, 2020 to 2035
- Table 4: Market Volume (Tons) Forecast by Metal Type, 2020 to 2035
- Table 5: Market Value (USD Mn) Forecast by Scrap, 2020 to 2035
- Table 6: Market Volume (Tons) Forecast by Scrap, 2020 to 2035
- Table 7: Market Value (USD Mn) Forecast by Recycling Type, 2020 to 2035
- Table 8: Market Volume (Tons) Forecast by Recycling Type, 2020 to 2035
- Table 9: Market Value (USD Mn) Forecast by End-User, 2020 to 2035
- Table 10: Market Volume (Tons) Forecast by End-User, 2020 to 2035
- Table 11: West Market Value (USD Mn) Forecast by States, 2020 to 2035
- Table 12: West Market Volume (Tons) Forecast by States, 2020 to 2035
- Table 13: West Market Value (USD Mn) Forecast by Metal Type, 2020 to 2035
- Table 14: West Market Volume (Tons) Forecast by Metal Type, 2020 to 2035
- Table 15: West Market Value (USD Mn) Forecast by Scrap, 2020 to 2035
- Table 16: West Market Volume (Tons) Forecast by Scrap, 2020 to 2035
- Table 17: West Market Value (USD Mn) Forecast by Recycling Type, 2020 to 2035
- Table 18: West Market Volume (Tons) Forecast by Recycling Type, 2020 to 2035
- Table 19: West Market Value (USD Mn) Forecast by End-User, 2020 to 2035
- Table 20: West Market Volume (Tons) Forecast by End-User, 2020 to 2035
- Table 21: Southwest Market Value (USD Mn) Forecast by States, 2020 to 2035
- Table 22: Southwest Market Volume (Tons) Forecast by States, 2020 to 2035
- Table 23: Southwest Market Value (USD Mn) Forecast by Metal Type, 2020 to 2035
- Table 24: Southwest Market Volume (Tons) Forecast by Metal Type, 2020 to 2035
- Table 25: Southwest Market Value (USD Mn) Forecast by Scrap, 2020 to 2035
- Table 26: Southwest Market Volume (Tons) Forecast by Scrap, 2020 to 2035
- Table 27: Southwest Market Value (USD Mn) Forecast by Recycling Type, 2020 to 2035
- Table 28: Southwest Market Volume (Tons) Forecast by Recycling Type, 2020 to 2035
- Table 29: Southwest Market Value (USD Mn) Forecast by End-User, 2020 to 2035
- Table 30: Southwest Market Volume (Tons) Forecast by End-User, 2020 to 2035
- Table 31: Midwest Market Value (USD Mn) Forecast by States, 2020 to 2035
- Table 32: Midwest Market Volume (Tons) Forecast by States, 2020 to 2035
- Table 33: Midwest Market Value (USD Mn) Forecast by Metal Type, 2020 to 2035
- Table 34: Midwest Market Volume (Tons) Forecast by Metal Type, 2020 to 2035
- Table 35: Midwest Market Value (USD Mn) Forecast by Scrap, 2020 to 2035
- Table 36: Midwest Market Volume (Tons) Forecast by Scrap, 2020 to 2035
- Table 37: Midwest Market Value (USD Mn) Forecast by Recycling Type, 2020 to 2035
- Table 38: Midwest Market Volume (Tons) Forecast by Recycling Type, 2020 to 2035
- Table 39: Midwest Market Value (USD Mn) Forecast by End-User, 2020 to 2035
- Table 40: Midwest Market Volume (Tons) Forecast by End-User, 2020 to 2035
- Table 41: Northeast Market Value (USD Mn) Forecast by States, 2020 to 2035
- Table 42: Northeast Market Volume (Tons) Forecast by States, 2020 to 2035
- Table 43: Northeast Market Value (USD Mn) Forecast by Metal Type, 2020 to 2035
- Table 44: Northeast Market Volume (Tons) Forecast by Metal Type, 2020 to 2035
- Table 45: Northeast Market Value (USD Mn) Forecast by Scrap, 2020 to 2035
- Table 46: Northeast Market Volume (Tons) Forecast by Scrap, 2020 to 2035
- Table 47: Northeast Market Value (USD Mn) Forecast by Recycling Type, 2020 to 2035
- Table 48: Northeast Market Volume (Tons) Forecast by Recycling Type, 2020 to 2035
- Table 49: Northeast Market Value (USD Mn) Forecast by End-User, 2020 to 2035
- Table 50: Northeast Market Volume (Tons) Forecast by End-User, 2020 to 2035
- Table 51: Southeast Market Value (USD Mn) Forecast by States, 2020 to 2035
- Table 52: Southeast Market Volume (Tons) Forecast by States, 2020 to 2035
- Table 53: Southeast Market Value (USD Mn) Forecast by Metal Type, 2020 to 2035
- Table 54: Southeast Market Volume (Tons) Forecast by Metal Type, 2020 to 2035
- Table 55: Southeast Market Value (USD Mn) Forecast by Scrap, 2020 to 2035
- Table 56: Southeast Market Volume (Tons) Forecast by Scrap, 2020 to 2035
- Table 57: Southeast Market Value (USD Mn) Forecast by Recycling Type, 2020 to 2035
- Table 58: Southeast Market Volume (Tons) Forecast by Recycling Type, 2020 to 2035
- Table 59: Southeast Market Value (USD Mn) Forecast by End-User, 2020 to 2035
- Table 60: Southeast Market Volume (Tons) Forecast by End-User, 2020 to 2035
List Of Figures
- Figure 1: Market Volume (Tons) Forecast 2020 to 2035
- Figure 2: Market Pricing Analysis
- Figure 3: Market Value (USD Mn) Forecast 2020 to 2035
- Figure 4: Market Value Share and BPS Analysis by Metal Type, 2025 and 2035
- Figure 5: Market Y-o-Y Growth Comparison by Metal Type, 2025 to 2035
- Figure 6: Market Attractiveness Analysis by Metal Type
- Figure 7: Market Value Share and BPS Analysis by Scrap, 2025 and 2035
- Figure 8: Market Y-o-Y Growth Comparison by Scrap, 2025 to 2035
- Figure 9: Market Attractiveness Analysis by Scrap
- Figure 10: Market Value Share and BPS Analysis by Recycling Type, 2025 and 2035
- Figure 11: Market Y-o-Y Growth Comparison by Recycling Type, 2025 to 2035
- Figure 12: Market Attractiveness Analysis by Recycling Type
- Figure 13: Market Value Share and BPS Analysis by End-User, 2025 and 2035
- Figure 14: Market Y-o-Y Growth Comparison by End-User, 2025 to 2035
- Figure 15: Market Attractiveness Analysis by End-User
- Figure 16: Market Value (USD Mn) Share and BPS Analysis by Region, 2025 and 2035
- Figure 17: Market Y-o-Y Growth Comparison by Region, 2025 to 2035
- Figure 18: Market Attractiveness Analysis by Region
- Figure 19: West Market Incremental $ Opportunity, 2025 to 2035
- Figure 20: Southwest Market Incremental $ Opportunity, 2025 to 2035
- Figure 21: Midwest Market Incremental $ Opportunity, 2025 to 2035
- Figure 22: Northeast Market Incremental $ Opportunity, 2025 to 2035
- Figure 23: Southeast Market Incremental $ Opportunity, 2025 to 2035
- Figure 24: West Market Value Share and BPS Analysis by States, 2025 and 2035
- Figure 25: West Market Value Share and BPS Analysis by Metal Type, 2025 and 2035
- Figure 26: West Market Y-o-Y Growth Comparison by Metal Type, 2025 to 2035
- Figure 27: West Market Attractiveness Analysis by Metal Type
- Figure 28: West Market Value Share and BPS Analysis by Scrap, 2025 and 2035
- Figure 29: West Market Y-o-Y Growth Comparison by Scrap, 2025 to 2035
- Figure 30: West Market Attractiveness Analysis by Scrap
- Figure 31: West Market Value Share and BPS Analysis by Recycling Type, 2025 and 2035
- Figure 32: West Market Y-o-Y Growth Comparison by Recycling Type, 2025 to 2035
- Figure 33: West Market Attractiveness Analysis by Recycling Type
- Figure 34: West Market Value Share and BPS Analysis by End-User, 2025 and 2035
- Figure 35: West Market Y-o-Y Growth Comparison by End-User, 2025 to 2035
- Figure 36: West Market Attractiveness Analysis by End-User
- Figure 37: Southwest Market Value Share and BPS Analysis by States, 2025 and 2035
- Figure 38: Southwest Market Value Share and BPS Analysis by Metal Type, 2025 and 2035
- Figure 39: Southwest Market Y-o-Y Growth Comparison by Metal Type, 2025 to 2035
- Figure 40: Southwest Market Attractiveness Analysis by Metal Type
- Figure 41: Southwest Market Value Share and BPS Analysis by Scrap, 2025 and 2035
- Figure 42: Southwest Market Y-o-Y Growth Comparison by Scrap, 2025 to 2035
- Figure 43: Southwest Market Attractiveness Analysis by Scrap
- Figure 44: Southwest Market Value Share and BPS Analysis by Recycling Type, 2025 and 2035
- Figure 45: Southwest Market Y-o-Y Growth Comparison by Recycling Type, 2025 to 2035
- Figure 46: Southwest Market Attractiveness Analysis by Recycling Type
- Figure 47: Southwest Market Value Share and BPS Analysis by End-User, 2025 and 2035
- Figure 48: Southwest Market Y-o-Y Growth Comparison by End-User, 2025 to 2035
- Figure 49: Southwest Market Attractiveness Analysis by End-User
- Figure 50: Midwest Market Value Share and BPS Analysis by States, 2025 and 2035
- Figure 51: Midwest Market Value Share and BPS Analysis by Metal Type, 2025 and 2035
- Figure 52: Midwest Market Y-o-Y Growth Comparison by Metal Type, 2025 to 2035
- Figure 53: Midwest Market Attractiveness Analysis by Metal Type
- Figure 54: Midwest Market Value Share and BPS Analysis by Scrap, 2025 and 2035
- Figure 55: Midwest Market Y-o-Y Growth Comparison by Scrap, 2025 to 2035
- Figure 56: Midwest Market Attractiveness Analysis by Scrap
- Figure 57: Midwest Market Value Share and BPS Analysis by Recycling Type, 2025 and 2035
- Figure 58: Midwest Market Y-o-Y Growth Comparison by Recycling Type, 2025 to 2035
- Figure 59: Midwest Market Attractiveness Analysis by Recycling Type
- Figure 60: Midwest Market Value Share and BPS Analysis by End-User, 2025 and 2035
- Figure 61: Midwest Market Y-o-Y Growth Comparison by End-User, 2025 to 2035
- Figure 62: Midwest Market Attractiveness Analysis by End-User
- Figure 63: Northeast Market Value Share and BPS Analysis by States, 2025 and 2035
- Figure 64: Northeast Market Value Share and BPS Analysis by Metal Type, 2025 and 2035
- Figure 65: Northeast Market Y-o-Y Growth Comparison by Metal Type, 2025 to 2035
- Figure 66: Southeast Market Y-o-Y Growth Comparison by End-User, 2025 to 2035
- Figure 67: Southeast Market Attractiveness Analysis by End-User
- Figure 68: Market - Tier Structure Analysis
- Figure 69: Market - Company Share Analysis
- FAQs -
What was the U.S. Scrap Metal Recycling Market Size Reported by Fact.MR for 2025?
The U.S. Scrap Metal Recycling Market was valued at USD 10,814 Million in 2025.
Who are the Major Players Operating in the U.S. Scrap Metal Recycling Market?
Prominent players in the market are American Pulverizer Company, Commercial Metals Company (CMC), OmniSource, Metal Management Inc., among others.
What is the Estimated Valuation of the U.S. Scrap Metal Recycling Market in 2035?
The market is expected to reach a valuation of USD 18,472 million in 2035.
What Value CAGR did the U.S. Scrap Metal Recycling Market Exhibit Over the Last Five Years?
The historic growth rate of the U.S. Scrap Metal Recycling Market was 4.9% from 2020 to 2024.