- Market Value (2025): USD 1.5 Bn
- Estimated Value (2026): USD 1.7 Bn
- Forecast Value (2036): USD 5.2 Bn
- CAGR (2026-2036): 11.9%
What is the Venue Reusable Cup Systems Market forecast to be worth by 2036?
USD 1.7 billion in 2026 to USD 5.2 billion by 2036, at 11.9% CAGR.
- The Venue Reusable Cup Systems Market reached USD 1.5 billion in 2025.
- Demand is projected to increase from USD 1.7 billion in 2026 to USD 5.2 billion by 2036.
- The market is forecast to record an 11.9% CAGR from 2026 to 2036 as stadiums and event teams expand repeat-use cup programs with clear return and wash steps.
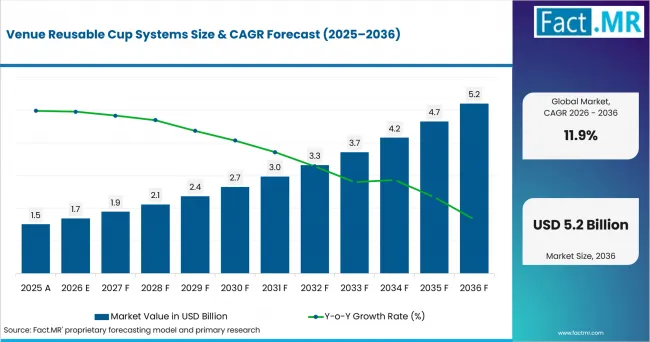
Venue Reusable Cup Systems Value Analysis | Source: Fact.MR
What are the defining numbers behind Venue Reusable Cup Systems Market growth?
USD 3.5 billion absolute opportunity by 2036, led by PCR polypropylene, venue deposit-return systems, and stadium demand.
- Demand Drivers in the Market
- Venue teams need cups that stay stable after many wash cycles. Fast stacking and easy handling help beverage counters reset stock between events.
- Concession teams need clear return points and simple deposit rules. These steps move cups back to the wash line and help keep more units in service.
- Event caterers need common cup sizes that fit crates and wash racks. Standard formats cut handling time between service rounds and simplify stock planning.
- Brand teams need decoration that lasts through many washes. Clear marks and scannable IDs help sponsors keep a consistent look while cups move through the return loop.
- Key Segments Analyzed
- By Cup Material: PCR polypropylene is expected to hold 37.0% share in 2026 because PP is durable, stackable, easy to wash, and suited to molded decoration.
- By Use Model: Venue deposit-return is projected to account for 33.0% share in 2026 as a refundable charge gives guests a clear reason to return cups.
- By Capacity: <300 mL is anticipated to capture 34.0% share in 2026 owing to frequent use for smaller drinks and easier handling at busy counters.
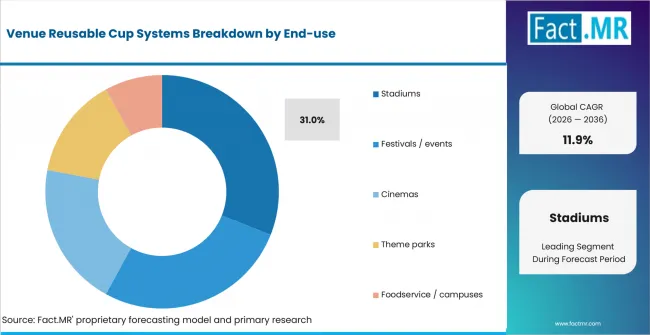
- By End-use: Stadiums are estimated to represent 31.0% share in 2026 due to repeat events and fixed drink points that support fast cup collection.
- Analyst Opinion at Fact.MR
- Shambhu Nath Jha, Principal Consultant at Fact.MR, states, “Venue reuse is becoming an operating-system decision rather than a simple cup purchase. Operators are evaluating cup durability, return rates, wash turnaround, stock visibility, and handling efficiency because every reuse cycle depends on cups coming back into service. Deposit-return models sit closest to that operating challenge, while RFID and QR tracking can help large venues manage cup pools across repeated events.”
- Strategic Implications
- Venue operators should place return points near exits and drink counters before they set cup sizes or deposit levels. Shanghai Municipal People’s Government reported in December 2025 that a citywide campaign aimed to help more than 3,000 beverage shops display BYO-cup labels. Dense return networks help users understand where reusable drinkware should go after service.
- Cup makers should test print quality and scannable IDs after repeated washing so tracking features remain clear during daily use. They should also keep cup shapes easy to stack so staff can move full crates with fewer handling steps.
- Wash partners should state hourly wash capacity and turnaround time so event teams can plan stock between fixtures or festival days. Clear service windows help venues decide how much spare inventory is needed during peak periods.
- Concession teams should keep cup and lid sizes as common as possible because fewer formats make storage and restocking easier. A simple range also helps staff sort returns and send cups to the right wash racks.
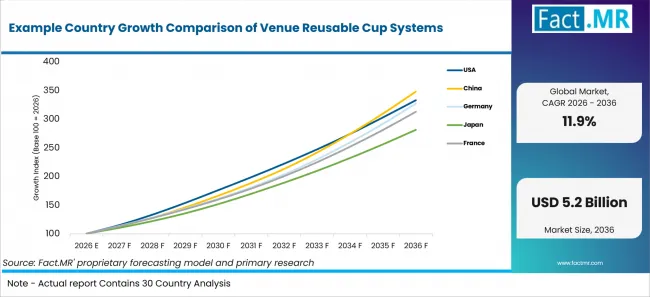
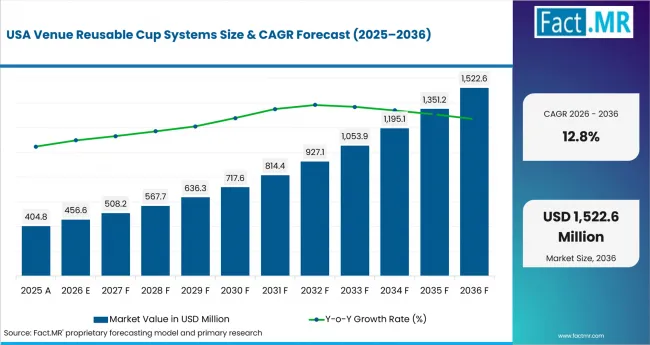
China is expected to record a 13.3% CAGR through 2036 as foodservice scale and urban reuse programs widen the market base. The USA is projected to post 12.8%, supported by large venue networks and repeat events. Germany is anticipated to advance at 12.6% as event reuse becomes more established. France is estimated to record 12.1% as cup rules guide service choices, while Japan is forecast to reach 10.9% as large events expand reuse trials.
How does the Venue Reusable Cup Systems Market break down by segment?
PCR polypropylene leads Cup Material at 37.0%; venue deposit-return leads Use Model at 33.0%.
Which Cup Material dominates?
PCR polypropylene is expected to hold 37.0% share in 2026.
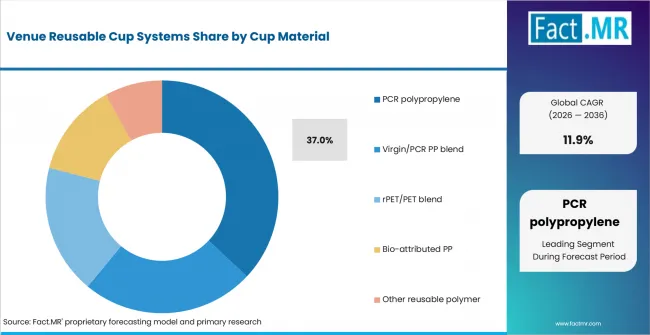
Venue Reusable Cup Systems Analysis By Cup Material | Source: Fact.MR
PCR polypropylene is expected to hold 37.0% share because venue cups need a tough material for repeated washing. Virgin/PCR PP blends can aid process stability. PET blends serve clear formats, while bio-attributed PP offers another feedstock route.
What leads the Use Model segment?
Venue deposit-return is projected to account for 33.0% share in 2026.
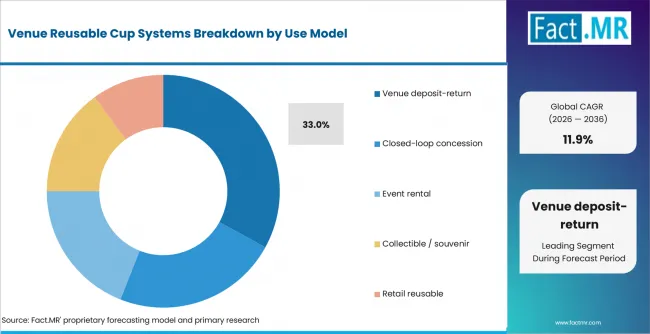
Venue Reusable Cup Systems Analysis By Use Model | Source: Fact.MR
Venue deposit-return is projected to account for 33.0% share because the deposit makes returns easy to understand. Closed-loop concessions keep cups inside one site. Rental models move washing and stock control to a service partner.
How does Capacity shape demand?
<300 mL is anticipated to lead with 34.0% share in 2026.
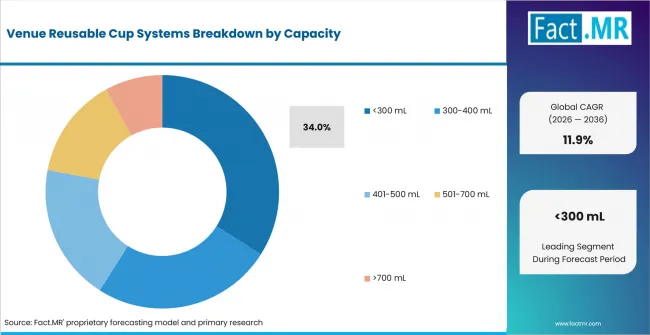
Venue Reusable Cup Systems Analysis By Capacity | Source: Fact.MR
The <300 mL segment is anticipated to lead with 34.0% share because smaller cups are easy to store during busy service. Larger sizes suit beer and soft drinks. Greiner lists event cups from 250 mL to 500 mL.
What supports Stadiums within End-use?
Stadiums are estimated to represent 31.0% share in 2026.
Venue Reusable Cup Systems Analysis By End Use | Source: Fact.MR
Stadiums are estimated to represent 31.0% share because drink sales occur at fixed counters inside managed sites. Greiner Packaging reported in June 2025 that around 52,000 fans attended the Lausitzring DTM weekend. Its reusable cups were used at the event. Fixed exits and repeat fixtures give operators a clear route for collection and washing.
What is accelerating Venue Reusable Cup Systems Market adoption, and what is holding it back?
Return-system economics drives adoption; cup loss and washing complexity restrain it.
Drivers Impact Analysis
| Driver | (~) % Impact on CAGR | Geographic Relevance | Impact Timeline |
|---|---|---|---|
| Deposit-return adoption | +1.8% | North America, Europe, East Asia | Short term (<= 2 years) |
| Single-use reduction rules | +1.5% | Europe, North America | Medium term (2-4 years) |
| RFID and QR tracking | +1.1% | Global | Medium term (2-4 years) |
| High-volume venue beverage service | +0.9% | Global | Long term (>= 4 years) |
| Centralized washing networks | +0.7% | Europe, East Asia | Long term (>= 4 years) |
Opportunity Impact Analysis
| Opportunity | (~) % Impact on CAGR | Geographic Relevance | Impact Timeline |
|---|---|---|---|
| Shared cup pools across venues | +1.2% | Europe, North America | Medium term (2-4 years) |
| RFID-enabled asset management | +0.9% | Global | Short term (<= 2 years) |
| Standardized cup and lid footprints | +0.7% | Global | Medium term (2-4 years) |
| On-site washing partnerships | +0.5% | Europe, East Asia | Long term (>= 4 years) |
Restraints Impact Analysis
| Restraint | (~) % Impact on CAGR | Geographic Relevance | Impact Timeline |
|---|---|---|---|
| Cup loss and non-return | -0.8% | Global | Short term (<= 2 years) |
| Washing and reverse-logistics cost | -0.6% | Global | Medium term (2-4 years) |
| Hygiene and turnaround controls | -0.5% | Global | Medium term (2-4 years) |
| Material and regulation mismatch | -0.3% | Europe, North America | Long term (>= 4 years) |
Which countries are scaling Venue Reusable Cup Systems Market through 2036?
- The country comparison spans 2.4 percentage points across the forecast period.
- China remains 0.5 percentage point above the USA as city reuse programs expand drink-return habits.
- The USA remains 0.2 percentage point above Germany as large venue networks support repeat cup programs.
- Germany remains 0.5 percentage point above France as event reuse and foodservice rules support managed return loops.
- France remains 1.2 percentage points above Japan as cup policy keeps reuse systems in focus.
- Japan closes the displayed range as major events build familiarity with reusable serviceware and return points.
Example Country Growth Comparison Of Venue Reusable Cup Systems | Source: Fact.MR
Comparable CAGRs can still produce different entry conditions. Venue density and wash access vary by country. Return habits and local cup rules differ as well. Full report coverage spans North America and Latin America. It also covers Western Europe, Eastern Europe and East Asia. South Asia & Pacific and Middle East & Africa complete the regional coverage.
| Country | CAGR (2026-2036) |
|---|---|
| China | 13.3% |
| USA | 12.8% |
| Germany | 12.6% |
| France | 12.1% |
| Japan | 10.9% |
How is China scaling venue reuse demand?
13.3% CAGR, supported by foodservice scale and city reuse programs.
China has a large foodservice base and many managed event sites. These venues can place cup returns inside clear service zones. The National Bureau of Statistics reported in January 2026 that catering income reached 5,798.2 billion yuan in 2025. Stadiums and festivals can pair deposits with fixed return points. Cups then move back to washing before the next service round. Standard PP formats are expected to ease crate handling and restocking across several counters.
What supports the USA outlook?
12.8% CAGR, shaped by large venue networks and local reuse programs.
Venue Reusable Cup Systems Country Value Analysis | Source: Fact.MR
The USA has a broad spectator-sports base with fixed concessions and repeat fixtures. These sites make reusable cup collection easier to organize at scale. In February 2026, the U.S. Bureau of Labor Statistics reported revised spectator sports employment of 188,200 in November 2025. Venue teams can place return stations beside exits and busy beverage counters. The same cup stock can then cycle through repeat events. Deposit rules and cup tracking are expected to keep return performance visible.
What underpins Germany’s growth?
12.6% CAGR, reinforced by event reuse and foodservice activity.
Germany combines active event catering with a mature hospitality base. That base supports planned wash routes and repeat cup service at large venues. Destatis reported in February 2026 that hospitality turnover rose 1.4% in nominal terms during 2025. Standard PP formats are expected to ease crate and wash-rack use. Regional washing can shorten turnaround between stadium or festival service periods.
How is France developing venue cup systems?
12.1% CAGR, influenced by leisure spending and cup policy.
France has a large leisure economy with theme parks and live events. Sports venues add another managed setting for reusable cup service. Insee reported in May 2026 that recreational and sports services represented 19.1% of household cultural, sports and leisure spending in 2025. Deposit-return formats are expected to link drink service with clear collection points. Standard cups can simplify washing and restocking across several beverage counters.
How does Japan perform?
10.9% CAGR, supported by service activity and large-event reuse programs.
Japan has a broad service base across leisure sites and large events. Managed visitor flows give operators clear places for cup returns. The Statistics Bureau reported in December 2025 that living-related and personal services and amusement services generated 3.826532 trillion yen in sales during October 2025. Standard cup sizes are expected to simplify collection and washing during busy event periods. Deposit systems can support faster returns and clearer stock control across repeat event days.
Who leads the Venue Reusable Cup Systems Market?
Following Amcor’s 2025 combination with Berry Global, Amcor’s packaging portfolio includes the former Berry reusable cup range.
The polypropylene cups are designed for repeated use and washing and can incorporate RFID chips or QR codes for tracking and reuse applications. Greiner Packaging also supplies polypropylene reusable event cups designed for repeated washing, with optional RFID or QR-code technology that can support cup traceability and management. These portfolios combine durable cup formats with features that can support organized reuse systems.
Cup Concept combines reusable cup supply with washing, logistics, storage, collection, and on-site services for stadiums and major events. VYTAL US operates technology originating from the TURN reuse system, combining digitally tracked reusable cups with smart collection bins, software, and washing infrastructure. Its inventory-management tools allow operators to monitor cups in circulation, in collection bins, and in stock.
Event Cup supplies polypropylene reusable cups for events and offers rental services that include the return and professional cleaning of used cups. This gives event organizers the option to use a managed rental model rather than purchase and clean the entire cup inventory themselves.
Which companies are the key providers?
Key companies include Amcor, Greiner Packaging, Cup Concept, Vytal US Inc. through the TURN system, and Event Cup.
- Amcor plc (including former Berry Global, Berry Superfos, and Berry RPC heritage)
- Greiner Packaging
- Cup Concept Mehrwegsysteme GmbH
- Vytal US Inc. (TURN system)
- Event Cup
Bibliography
- Ministère de la Transition écologique. (2025, December 31). Report de l’échéance d’interdiction des gobelets en plastique à usage unique.
- Amcor. (2025, April 30). Amcor completes combination with Berry Global; Positioned to significantly enhance value for customers and shareholders.
- Eggharter, R. (2025, June 17). Greiner’s reusable drinking cup drives change at major motorsport event in Germany. Greiner Packaging.
- National Bureau of Statistics of China. (2026, January 19). National economy pushed forward with innovation-led and high-quality development and expected targets achieved successfully in 2025.
- Statistisches Bundesamt (Destatis). (2026, February 19). Gastgewerbeumsatz 2025 real 2,1 % niedriger als im Vorjahr.
- Institut national de la statistique et des études économiques. (2026, May 29). Dépenses culturelles, sportives et de loisirs : Données annuelles de 2000 à 2025
This Report Answers
- The report explains where venue reusable cup systems are used across Cup Material and Use Model. It also covers Capacity and End-use together with regional demand.
- Segment analysis identifies the leading subsegments and the operational reasons venues prioritize PCR polypropylene, deposit-return systems, smaller cup capacities, and stadium applications.
- Country analysis examines China, the USA, Germany, France, and Japan together with foodservice activity, venue networks, reuse programs, cup policy, and large-event service conditions supporting managed reuse.
- Competitive analysis reviews current providers across reusable cup supply, washing, logistics, digital tracking, collection infrastructure, and managed rental models.
- Application analysis assesses how cup durability, return rates, wash turnaround, storage efficiency, tracking, and stock control influence venue-system selection. It also considers handling, crate use, and repeat-event service cycles.
What does the Venue Reusable Cup Systems Market cover?
Venue-managed cups, return points, wash loops, and tracking used for beverage service.
The market covers durable drink cups made for repeat use at managed venues. It includes cup supply and return steps. Washing and tracking keep the same cups in service across many cycles.
The scope is centered on managed venue reuse. Disposable drinkware and personal tumblers fall outside the system boundary. A venue transition program can still use them as a reference.
What is included in the scope?
Venue-managed cup systems used across stadiums, festivals, cinemas, theme parks, and foodservice campuses.
Coverage includes PCR polypropylene and other durable cup materials, five return models, five cup-size bands, and venue uses from stadiums to campuses. Related coverage includes foodservice reusable cup and takeaway container systems, refillable and reusable food packaging systems, and the broader reusable packaging category.
What is excluded from the scope?
Disposable cups and personal tumblers outside a venue-managed return loop fall beyond the scope.
The boundary covers cups built for repeat beverage service at managed venues. Generic food tubs belong to adjacent packaging categories. Personal bottles belong to consumer drinkware categories.
How Was the Analysis Built?
The analysis draws on 120+ sources, 35+ company portfolios, 25+ countries, and more than 20 industry interviews.
- Primary Research: Primary research includes discussions with manufacturers, service providers, technology developers, distributors, end users, and subject-matter experts. These conversations examine purchasing priorities, product adoption, operational challenges, approval requirements, competitive positioning, and the factors that influence wider market acceptance.
- Desk Research: Desk research covers government statistics, regulatory publications, company filings, trade data, technical studies, industry associations, standards, public policy, and other authoritative sources. Every source used in the analysis is documented in the bibliography.
- Market Sizing and Forecasting: Market estimates combine historical performance, demand indicators, pricing and volume trends, segment shares, company participation, country-level growth, adoption patterns, investment activity, and barriers to market expansion.
- Data Validation and Update Cycle: Findings are validated by comparing primary interviews with public data, company activity, regulatory changes, trade patterns, and industry developments. Regular updates review new product launches, capacity changes, partnerships, approvals, and shifts in commercial adoption.
What is the report’s scope and coverage?
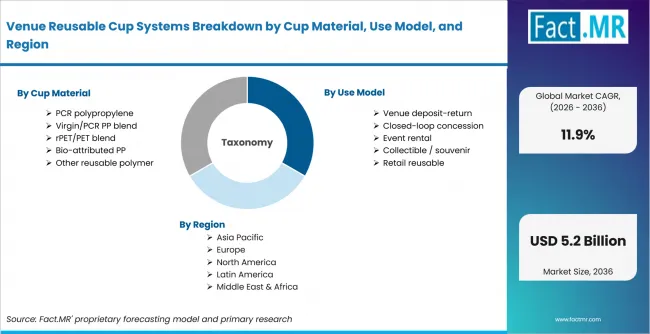
Venue Reusable Cup Systems Breakdown By Cup Material Use Model And Region | Source: Fact.MR
| Attribute | Details |
|---|---|
| Quantitative Units | USD billion |
| Market Definition | Venue-managed reusable beverage cup systems covering durable cups, return collection, washing, and tracking across repeated service cycles. |
| Cup Material | PCR polypropylene; Virgin/PCR PP blend; rPET/PET blend; Bio-attributed PP; Other reusable polymer |
| Use Model | Venue deposit-return; Closed-loop concession; Event rental; Collectible / souvenir; Retail reusable |
| Capacity | <300 mL; 300-400 mL; 401-500 mL; 501-700 mL; >700 mL |
| End-use | Stadiums; Festivals / events; Cinemas; Theme parks; Foodservice / campuses |
| Regions Covered | North America; Latin America; Western Europe; Eastern Europe; East Asia; South Asia & Pacific; Middle East & Africa |
| Countries Covered | USA; China; Germany; Japan; France |
| Key Companies Profiled | Amcor plc; Greiner Packaging; Cup Concept Mehrwegsysteme GmbH; Vytal US Inc. (TURN system); Event Cup |
| Forecast Period | 2026 to 2036 |
| Approach | Hybrid top-down and bottom-up review using venue demand, cup cycles, return models, material mix, country growth, and provider portfolios. |
How is the market segmented?
-
By Cup Material:
- PCR polypropylene
- Virgin/PCR PP blend
- rPET/PET blend
- Bio-attributed PP
- Other reusable polymer
-
By Use Model:
- Venue deposit-return
- Closed-loop concession
- Event rental
- Collectible / souvenir
- Retail reusable
-
By Capacity:
- <300 mL
- 300-400 mL
- 401-500 mL
- 501-700 mL
- >700 mL
-
By End-use:
- Stadiums
- Festivals / events
- Cinemas
- Theme parks
- Foodservice / campuses
-
By Region:
- North America
- Latin America
- Western Europe
- Eastern Europe
- East Asia
- South Asia & Pacific
- Middle East & Africa