Straddle Carriers Market
Straddle Carriers Market Analysis, By Drive Type, By Stack Height, By Application, By End-Use, and Region - Market Insights 2025 to 2035
Analysis of Straddle Carriers Market Covering 30+ Countries Including Analysis of US, Canada, UK, Germany, France, Nordics, GCC countries, Japan, Korea and many more.
Straddle Carriers Market Outlook (2025 to 2035)
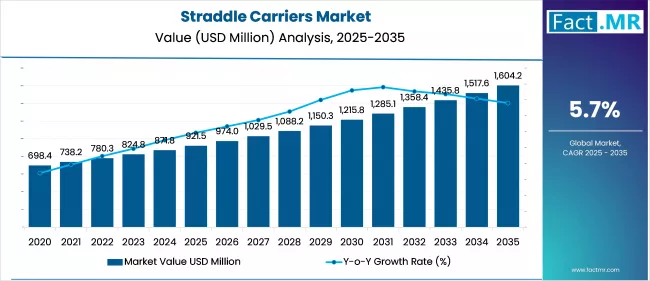
The global straddle carriers market is projected to increase from USD 921.5 million in 2025 to USD 1,604.2 million by 2035, with a CAGR of 5.7%, driven by port automation, container traffic expansion, and the demand for more flexible and efficient container handling systems. The emphasis on faster turnaround times and minimal human intervention in maritime logistics is driving the global business.
What are the Key Drivers of the Straddle Carriers Market?
Port authorities and terminal operators are increasingly adopting straddle carriers to meet the rising demand for efficient container handling operations. As global maritime trade continues to expand, the number of container movements in major seaports has increased significantly, resulting in logistical bottlenecks. Straddle carriers offer flexibility by allowing containers to be stacked and unstacked independently, eliminating the need for additional lifting equipment and thereby reducing dwell time and improving port throughput.
Technological advancements, particularly in electric and hybrid straddle carriers, have improved energy efficiency, reduced emissions, and lowered operational costs. Automation and integration with terminal operating systems (TOS) are enhancing safety, accuracy, and labor optimization. These innovations enable better fleet management and predictive maintenance, particularly in large-scale terminals across Europe and Asia.
Moreover, rising investments in smart ports, such as those in Rotterdam, Singapore, and Shanghai, are further encouraging the adoption of automated and semi-automated straddle carriers. Government-led initiatives to reduce carbon footprints and promote electrification in heavy-duty vehicles provide additional tailwinds to the market.
What are the Regional Trends in the Straddle Carriers Market?
Asia Pacific remains the dominant region, driven by container traffic in China, India, South Korea, and Southeast Asia. China’s major ports, such as Shanghai, Ningbo-Zhoushan, and Shenzhen, are aggressively adopting automation and smart port technologies, supporting the uptake of straddle carriers. India’s Sagarmala project, along with the increasing use of public-private partnerships in port development, further contributes to regional growth. Japan and Singapore continue to invest in electric and autonomous straddle carrier fleets as part of decarbonization roadmaps.
Europe holds the second-largest share, particularly in countries with highly automated container terminals. Ports in Germany, the Netherlands, and Belgium have heavily invested in semi-automated terminals that rely on straddle carriers for yard operations. For example, the Port of Rotterdam's Maasvlakte terminal employs a fleet of automated electric straddle carriers. EU policies supporting the clean energy transition in logistics also incentivize the integration of electric vehicles in port operations.
North America shows steady growth, led by port modernization programs in the U.S. and Canada. Ports such as Long Beach, Los Angeles, and Vancouver are retrofitting and expanding their container yards, creating opportunities for straddle carriers. The growing demand for e-commerce and inland transportation further pressures port authorities to enhance efficiency, favoring the use of straddle carriers.
In the Middle East & Africa, rising transshipment activities in the UAE, South Africa, and Morocco support infrastructure development. Although adoption remains lower compared to other regions, ongoing port expansion projects suggest future growth straddle carriers market.
What are the Challenges and Restraining Factors in the Straddle Carriers Market?
A key challenge lies in the high capital investment required for acquiring and maintaining straddle carrier fleets. Advanced units, especially those integrated with autonomous features and electric drivetrains, require significant upfront investment, which may deter smaller ports from adoption.
Additionally, maintenance and technical complexity remain ongoing challenges. Straddle carriers undergo heavy-duty, continuous operations, requiring specialized upkeep to ensure reliability. Any mechanical downtime can significantly disrupt container flow and reduce profitability, particularly in busy terminals. The situation is further strained by a lack of skilled operators and technicians, making it difficult to maintain consistent performance and uptime.
Another restraint is the limited standardization across ports, which creates integration issues when deploying new or upgraded systems. Furthermore, the slow pace of electrification in emerging markets, largely due to a lack of charging infrastructure, also limits the adoption of electric straddle carriers. Environmental regulations may also complicate the deployment of diesel-powered carriers, forcing ports to shift to cleaner alternatives sooner than expected.
Country-Wise Outlook
China Focuses on Port Automation and Electric Straddle Carriers
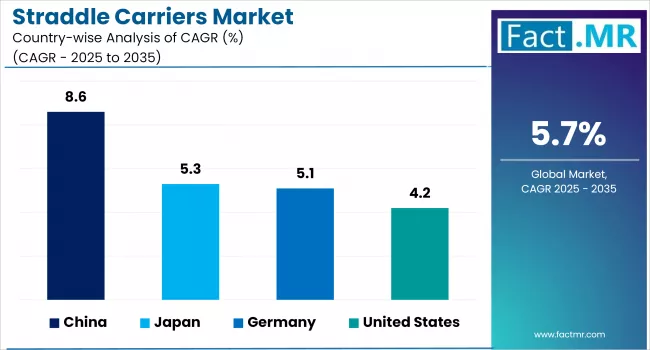
China leads the global straddle carriers market in terms of deployment volume and technological innovation. Major container ports such as Shanghai and Ningbo-Zhoushan handle high volumes and require efficient container stacking and retrieval systems. Straddle carriers are increasingly integrated with China's smart port infrastructure, supported by the country's 14th Five-Year Plan, which focuses on logistics automation and emissions reduction.
China's homegrown companies, including SANY and ZPMC, are producing electric and hybrid straddle carriers, which align with national objectives to phase out diesel engines in heavy-duty port equipment. In 2024, the Port of Tianjin announced full electrification of its container yard vehicles, many of which are straddle carriers. Moreover, government-backed R&D funding supports the development of autonomous mobility solutions in port settings.
Germany Champions Semi-Automated Terminals and Low-Emission Equipment
Germany has established itself as a key European hub for advanced container handling systems. The Port of Hamburg and Wilhelmshaven are known for their semi-automated terminals, where straddle carriers serve as core yard transportation systems. Most of the fleet in these ports is semi-autonomous and powered by low-emission diesel-electric or fully electric drives.
With Germany's strong focus on green logistics and digital transformation, the use of straddle carriers is reinforced by subsidies for clean port equipment. German firms such as Terex Port Solutions and Könecranes provide tailored carrier systems with high precision and energy efficiency. The country's strict emissions laws ensure rapid electrification and smart monitoring integration across container terminals.
The U.S. Ramps Up Modernization to Tackle Port Congestion
The U.S. straddle carriers market is seeing renewed interest due to infrastructure revitalization efforts and persistent port congestion, particularly on the West Coast. Ports of Los Angeles and Long Beach are enhancing their yard automation capabilities with modern container-handling fleets, including hybrid and electric straddle carriers.
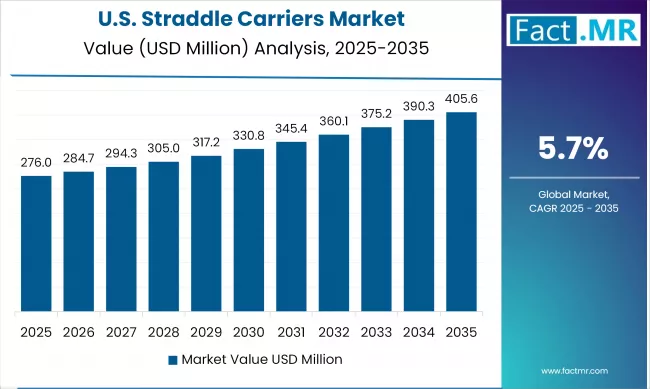
Straddle carriers that can be deployed without reconfiguring terminals are favored due to space constraints in older U.S. ports. Companies such as Taylor Machine Works and Konecranes have increased their presence in U.S. projects with scalable, low-emission solutions.
Category-wise Analysis
Diesel-Powered to Exhibit Leading by Drive Type
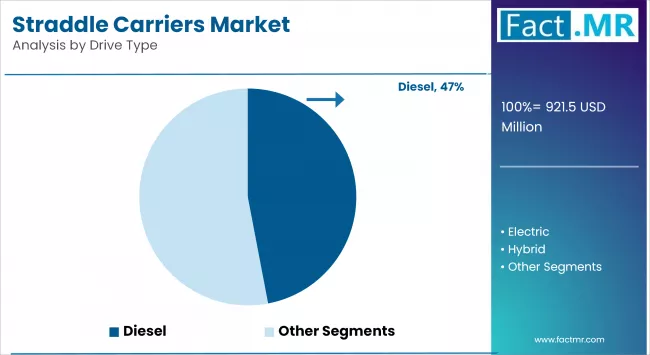
Diesel-powered straddle carriers continue to dominate the global market, particularly in developing ports and terminals with limited access to electric infrastructure. These machines offer high horsepower and operational efficiency, making them suitable for medium- to heavy-duty lifting in container handling and transport applications. Their robust performance, coupled with a long lifespan and ease of maintenance, makes them ideal for port operators seeking proven, conventional systems with minimal technological dependency.
Several terminals in Southeast Asia, Africa, and Latin America rely on diesel-powered equipment due to the lack of reliable electric grid connectivity or high initial cost of transitioning to hybrid or electric models. In these regions, diesel variants offer cost advantages over time due to widespread service availability and established operator familiarity. Moreover, diesel models provide extended operational range, especially critical for terminals handling large cargo volumes without interruptions for recharging or refueling.
However, with increasing pressure on ports to reduce emissions, manufacturers are improving diesel technologies by integrating cleaner-burning engines, improved fuel injection systems, and particulate filter technologies to make these machines more compliant with environmental standards. While demand may gradually shift to greener alternatives, diesel straddle carriers will maintain relevance, particularly in transitional economies and retrofitted hybrid configurations.
1-Over-2 Straddle Carriers to Exhibit leading by Stack Height
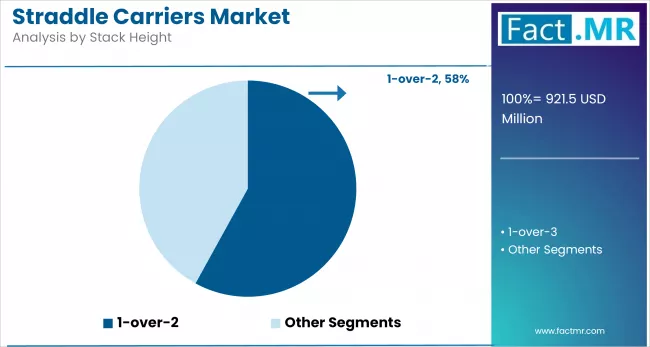
1-over-2 straddle carriers dominate the market, primarily due to their widespread use at small to mid-sized terminals and facilities where moderate stacking height meets operational needs without incurring excessive infrastructure costs. These carriers offer a good balance between cost, operational efficiency, and maneuverability, making them highly preferred in ports with space constraints.
1-over-3 straddle carriers are gaining traction in high-density terminals where maximizing vertical space is critical. These carriers allow for greater stacking, improving yard storage capacity. Although they require more robust infrastructure and are costlier, their growing adoption in major global ports reflects a trend towards higher productivity in container handling.
Container Stacking to Exhibit Leading by Application
Container stacking holds the largest market share, as it is the primary function of straddle carriers in port operations. Their ability to stack containers efficiently without relying on cranes makes them essential for quick turnaround times and optimized yard usage.
Intermodal terminal operations, on the other hand, represent a significant growth segment. As global trade increasingly relies on multimodal logistics, straddle carriers are becoming integral in efficiently transferring containers between different transport modes. Their mobility and versatility make them ideal for these dynamic, space-sensitive environments.
Port Terminals to Exhibit Leading by End-Use
Port terminals are the dominant segment, driven by the ever-increasing volume of international maritime trade. Straddle carriers at ports enable quick and efficient container movement from vessels to yards, supporting high throughput and minimizing dwell times.
Inland Container Depots (ICDs) are witnessing steady adoption of straddle carriers due to the need for efficient inland logistics infrastructure. As trade corridors expand and the focus on decongesting coastal ports intensifies, ICDs are playing a bigger role, prompting investment in advanced material handling equipment like straddle carriers.
Competitive Analysis
The straddle carriers market is becoming moderately competitive, with major players emphasizing innovation, geographic expansion, and after-sales support. Leading manufacturers, such as Kalmar (Cargotec Corporation), Konecranes, Terex Port Solutions, Liebherr, and SANY Group, dominate due to their comprehensive product portfolios and global service networks.
Technological advancements form a critical competitive lever. Players invest in electrification, autonomous navigation systems, and fleet management platforms to differentiate their offerings. Kalmar, for instance, offers its AutoStrad™ platform, combining automated carriers with cloud-based control systems. Konecranes provides ECO straddle carriers with advanced fuel-saving features and connectivity.
Regional customization and compliance with emission norms influence OEM market penetration. Local players in China and India, such as ZPMC and TIL Limited, focus on cost-effective diesel variants for domestic ports. Aftermarket services, leasing programs, and lifecycle management are crucial for maintaining customer loyalty.
Recent strategic collaborations have centered on automation and data-driven operations. In 2024, Konecranes and Microsoft Azure partnered to enhance smart fleet diagnostics. Kalmar launched a retrofit automation package for existing carriers, targeting terminal upgrades in budget-conscious ports.
Recent Developments
- In May 2024, Kalmar unveiled a new all-electric straddle carrier model featuring enhanced regenerative braking technology, which reduces energy consumption by 23% compared to the previous generation.
- In March 2024, Konecranes secured a significant order from the Port of Antwerp, Belgium, for 20 hybrid straddle carriers. These advanced machines are designed to combine diesel and electric power, offering substantial reductions in fuel consumption and emissions compared to conventional diesel-only models.
Segmentation of the Straddle Carriers Market
-
By Drive Type :
- Diesel
- Electric
- Hybrid
-
By Stack Height :
- 1-over-2
- 1-over-3
-
By Application :
- Container Stacking
- Container Transport
- Intermodal Terminals
-
By End-Use :
- Port Terminals
- Intermodal Yards
- Inland Container Depots (ICDs)
-
By Region :
- North America
- Latin America
- Western Europe
- Eastern Europe
- East Asia
- South Asia & Pacific
- Middle East & Africa
Table of Content
- Executive Summary
- Global Market Outlook
- Demand-side Trends
- Supply-side Trends
- Technology Roadmap Analysis
- Analysis and Recommendations
- Market Overview
- Market Coverage / Taxonomy
- Market Definition / Scope / Limitations
- Market Background
- Market Dynamics
- Drivers
- Restraints
- Opportunity
- Trends
- Scenario Forecast
- Demand in Optimistic Scenario
- Demand in Likely Scenario
- Demand in Conservative Scenario
- Opportunity Map Analysis
- Product Life Cycle Analysis
- Supply Chain Analysis
- Supply Side Participants and their Roles
- Producers
- Mid-Level Participants (Traders/ Agents/ Brokers)
- Wholesalers and Distributors
- Value Added and Value Created at Node in the Supply Chain
- List of Component Suppliers
- List of Existing and Potential Buyers
- Supply Side Participants and their Roles
- Investment Feasibility Matrix
- Value Chain Analysis
- Profit Margin Analysis
- Wholesalers and Distributors
- Retailers
- PESTLE and Porter’s Analysis
- Regulatory Landscape
- By Key Regions
- By Key Countries
- Production and Consumption Statistics
- Import and Export Statistics
- Market Dynamics
- Global Market Analysis 2020 to 2024 and Forecast, 2025 to 2035
- Historical Market Size Value (USD Mn) & Volume (Units) Analysis, 2020 to 2024
- Current and Future Market Size Value (USD Mn) & Volume (Units) Projections, 2025 to 2035
- Y-o-Y Growth Trend Analysis
- Absolute $ Opportunity Analysis
- Global Market Pricing Analysis 2020 to 2024 and Forecast 2025 to 2035
- Global Market Analysis 2020 to 2024 and Forecast 2025 to 2035, By Drive Type
- Introduction / Key Findings
- Historical Market Size Value (USD Mn) & Volume (Units) Analysis By Drive Type, 2020 to 2024
- Current and Future Market Size Value (USD Mn) & Volume (Units) Analysis and Forecast By Drive Type, 2025 to 2035
- Diesel
- Electric
- Hybrid
- Y-o-Y Growth Trend Analysis By Drive Type, 2020 to 2024
- Absolute $ Opportunity Analysis By Drive Type, 2025 to 2035
- Global Market Analysis 2020 to 2024 and Forecast 2025 to 2035, By Stack Height
- Introduction / Key Findings
- Historical Market Size Value (USD Mn) & Volume (Units) Analysis By Stack Height, 2020 to 2024
- Current and Future Market Size Value (USD Mn) & Volume (Units) Analysis and Forecast By Stack Height, 2025 to 2035
- 1-over-2
- 1-over-3
- Y-o-Y Growth Trend Analysis By Stack Height, 2020 to 2024
- Absolute $ Opportunity Analysis By Stack Height, 2025 to 2035
- Global Market Analysis 2020 to 2024 and Forecast 2025 to 2035, By Application
- Introduction / Key Findings
- Historical Market Size Value (USD Mn) & Volume (Units) Analysis By Application, 2020 to 2024
- Current and Future Market Size Value (USD Mn) & Volume (Units) Analysis and Forecast By Application, 2025 to 2035
- Container Stacking
- Container Transport
- Intermodal Terminals
- Y-o-Y Growth Trend Analysis By Application, 2020 to 2024
- Absolute $ Opportunity Analysis By Application, 2025 to 2035
- Global Market Analysis 2020 to 2024 and Forecast 2025 to 2035, By End-Use
- Introduction / Key Findings
- Historical Market Size Value (USD Mn) & Volume (Units) Analysis By End-Use, 2020 to 2024
- Current and Future Market Size Value (USD Mn) & Volume (Units) Analysis and Forecast By End-Use, 2025 to 2035
- Port Terminals
- Intermodal Yards
- Inland Container Depots (ICDs)
- Y-o-Y Growth Trend Analysis By End-Use, 2020 to 2024
- Absolute $ Opportunity Analysis By End-Use, 2025 to 2035
- Global Market Analysis 2020 to 2024 and Forecast 2025 to 2035, By Region
- Introduction
- Historical Market Size Value (USD Mn) & Volume (Units) Analysis By Region, 2020 to 2024
- Current Market Size Value (USD Mn) & Volume (Units) Analysis and Forecast By Region, 2025 to 2035
- North America
- Latin America
- Western Europe
- East Asia
- South Asia Pacific
- Eastern Europe
- Middle East & Africa
- Market Attractiveness Analysis By Region
- North America Market Analysis 2020 to 2024 and Forecast 2025 to 2035, By Country
- Historical Market Size Value (USD Mn) & Volume (Units) Trend Analysis By Market Taxonomy, 2020 to 2024
- Market Size Value (USD Mn) & Volume (Units) Forecast By Market Taxonomy, 2025 to 2035
- By Country
- U.S.
- Canada
- Mexico
- By Drive Type
- By Stack Height
- By Application
- By End-Use
- By Country
- Market Attractiveness Analysis
- By Country
- By Drive Type
- By Stack Height
- By Application
- By End-Use
- Key Takeaways
- Latin America Market Analysis 2020 to 2024 and Forecast 2025 to 2035, By Country
- Historical Market Size Value (USD Mn) & Volume (Units) Trend Analysis By Market Taxonomy, 2020 to 2024
- Market Size Value (USD Mn) & Volume (Units) Forecast By Market Taxonomy, 2025 to 2035
- By Country
- Brazil
- Chile
- Rest of Latin America
- By Drive Type
- By Stack Height
- By Application
- By End-Use
- By Country
- Market Attractiveness Analysis
- By Country
- By Drive Type
- By Stack Height
- By Application
- By End-Use
- Key Takeaways
- Western Europe Market Analysis 2020 to 2024 and Forecast 2025 to 2035, By Country
- Historical Market Size Value (USD Mn) & Volume (Units) Trend Analysis By Market Taxonomy, 2020 to 2024
- Market Size Value (USD Mn) & Volume (Units) Forecast By Market Taxonomy, 2025 to 2035
- By Country
- Germany
- Italy
- France
- U.K.
- Spain
- Russia
- BENELUX
- Rest of Europe
- By Drive Type
- By Stack Height
- By Application
- By End-Use
- By Country
- Market Attractiveness Analysis
- By Country
- By Drive Type
- By Stack Height
- By Application
- By End-Use
- Key Takeaways
- East Asia Market Analysis 2020 to 2024 and Forecast 2025 to 2035, By Country
- Historical Market Size Value (USD Mn) & Volume (Units) Trend Analysis By Market Taxonomy, 2020 to 2024
- Market Size Value (USD Mn) & Volume (Units) Forecast By Market Taxonomy, 2025 to 2035
- By Country
- China
- Japan
- South Korea
- By Drive Type
- By Stack Height
- By Application
- By End-Use
- By Country
- Market Attractiveness Analysis
- By Country
- By Drive Type
- By Stack Height
- By Application
- By End-Use
- Key Takeaways
- South Asia Pacific Market Analysis 2020 to 2024 and Forecast 2025 to 2035, By Country
- Historical Market Size Value (USD Mn) & Volume (Units) Trend Analysis By Market Taxonomy, 2020 to 2024
- Market Size Value (USD Mn) & Volume (Units) Forecast By Market Taxonomy, 2025 to 2035
- By Country
- India
- ASEAN Countries
- Australia & New Zealand
- Rest of South Asia Pacific
- By Drive Type
- By Stack Height
- By Application
- By End-Use
- By Country
- Market Attractiveness Analysis
- By Country
- By Drive Type
- By Stack Height
- By Application
- By End-Use
- Key Takeaways
- Eastern Europe Market Analysis 2020 to 2024 and Forecast 2025 to 2035, By Country
- Historical Market Size Value (USD Mn) & Volume (Units) Trend Analysis By Market Taxonomy, 2020 to 2024
- Market Size Value (USD Mn) & Volume (Units) Forecast By Market Taxonomy, 2025 to 2035
- By Country
- Russia
- Poland
- Hungary
- Balkan & Baltics
- Rest of Eastern Europe
- By Drive Type
- By Stack Height
- By Application
- By End-Use
- By Country
- Market Attractiveness Analysis
- By Country
- By Drive Type
- By Stack Height
- By Application
- By End-Use
- Key Takeaways
- Middle East & Africa Market Analysis 2020 to 2024 and Forecast 2025 to 2035, By Country
- Historical Market Size Value (USD Mn) & Volume (Units) Trend Analysis By Market Taxonomy, 2020 to 2024
- Market Size Value (USD Mn) & Volume (Units) Forecast By Market Taxonomy, 2025 to 2035
- By Country
- KSA
- Other GCC Countries
- Turkiye
- South Africa
- Rest of MEA
- By Drive Type
- By Stack Height
- By Application
- By End-Use
- By Country
- Market Attractiveness Analysis
- By Country
- By Drive Type
- By Stack Height
- By Application
- By End-Use
- Key Takeaways
- Key Countries Market Analysis
- China
- Pricing Analysis
- Market Share Analysis, 2024
- By Drive Type
- By Stack Height
- By Application
- By End-Use
- Germany
- Pricing Analysis
- Market Share Analysis, 2024
- By Drive Type
- By Stack Height
- By Application
- By End-Use
- United States
- Pricing Analysis
- Market Share Analysis, 2024
- By Drive Type
- By Stack Height
- By Application
- By End-Use
- India
- Pricing Analysis
- Market Share Analysis, 2024
- By Drive Type
- By Stack Height
- By Application
- By End-Use
- Australia
- Pricing Analysis
- Market Share Analysis, 2024
- By Drive Type
- By Stack Height
- By Application
- By End-Use
- China
- Market Structure Analysis
- Competition Dashboard
- Competition Benchmarking
- Market Share Analysis of Top Players
- By Regional
- By Drive Type
- By Stack Height
- By Application
- By End-Use
- Competition Analysis
- Competition Deep Dive
- Kalmar
- Overview
- Product Portfolio
- Profitability by Market Segments (Product/Age /Sales Channel/Region)
- Sales Footprint
- Strategy Overview
- Marketing Strategy
- Product Strategy
- Channel Strategy
- Konecranes
- Overview
- Product Portfolio
- Profitability by Market Segments (Product/Age /Sales Channel/Region)
- Sales Footprint
- Strategy Overview
- Marketing Strategy
- Product Strategy
- Channel Strategy
- Terex Port Solutions
- Overview
- Product Portfolio
- Profitability by Market Segments (Product/Age /Sales Channel/Region)
- Sales Footprint
- Strategy Overview
- Marketing Strategy
- Product Strategy
- Channel Strategy
- Liebherr
- Overview
- Product Portfolio
- Profitability by Market Segments (Product/Age /Sales Channel/Region)
- Sales Footprint
- Strategy Overview
- Marketing Strategy
- Product Strategy
- Channel Strategy
- SANY
- Overview
- Product Portfolio
- Profitability by Market Segments (Product/Age /Sales Channel/Region)
- Sales Footprint
- Strategy Overview
- Marketing Strategy
- Product Strategy
- Channel Strategy
- ZPMC
- Overview
- Product Portfolio
- Profitability by Market Segments (Product/Age /Sales Channel/Region)
- Sales Footprint
- Strategy Overview
- Marketing Strategy
- Product Strategy
- Channel Strategy
- Kalmar
- Competition Deep Dive
- Assumptions & Acronyms Used
- Research Methodology
List Of Table
- Table 1: Global Market Value (USD Mn) Forecast by Region, 2020 to 2035
- Table 2: Global Market Volume (Units) Forecast by Region, 2020 to 2035
- Table 3: Global Market Value (USD Mn) Forecast by Drive Type, 2020 to 2035
- Table 4: Global Market Volume (Units) Forecast by Drive Type, 2020 to 2035
- Table 5: Global Market Value (USD Mn) Forecast by Stack Height, 2020 to 2035
- Table 6: Global Market Volume (Units) Forecast by Stack Height, 2020 to 2035
- Table 7: Global Market Value (USD Mn) Forecast by Application, 2020 to 2035
- Table 8: Global Market Volume (Units) Forecast by Application, 2020 to 2035
- Table 9: Global Market Value (USD Mn) Forecast by End-Use, 2020 to 2035
- Table 10: Global Market Volume (Units) Forecast by End-Use, 2020 to 2035
- Table 11: North America Market Value (USD Mn) Forecast by Country, 2020 to 2035
- Table 12: North America Market Volume (Units) Forecast by Country, 2020 to 2035
- Table 13: North America Market Value (USD Mn) Forecast by Drive Type, 2020 to 2035
- Table 14: North America Market Volume (Units) Forecast by Drive Type, 2020 to 2035
- Table 15: North America Market Value (USD Mn) Forecast by Stack Height, 2020 to 2035
- Table 16: North America Market Volume (Units) Forecast by Stack Height, 2020 to 2035
- Table 17: North America Market Value (USD Mn) Forecast by Application, 2020 to 2035
- Table 18: North America Market Volume (Units) Forecast by Application, 2020 to 2035
- Table 19: North America Market Value (USD Mn) Forecast by End-Use, 2020 to 2035
- Table 20: North America Market Volume (Units) Forecast by End-Use, 2020 to 2035
- Table 21: Latin America Market Value (USD Mn) Forecast by Country, 2020 to 2035
- Table 22: Latin America Market Volume (Units) Forecast by Country, 2020 to 2035
- Table 23: Latin America Market Value (USD Mn) Forecast by Drive Type, 2020 to 2035
- Table 24: Latin America Market Volume (Units) Forecast by Drive Type, 2020 to 2035
- Table 25: Latin America Market Value (USD Mn) Forecast by Stack Height, 2020 to 2035
- Table 26: Latin America Market Volume (Units) Forecast by Stack Height, 2020 to 2035
- Table 27: Latin America Market Value (USD Mn) Forecast by Application, 2020 to 2035
- Table 28: Latin America Market Volume (Units) Forecast by Application, 2020 to 2035
- Table 29: Latin America Market Value (USD Mn) Forecast by End-Use, 2020 to 2035
- Table 30: Latin America Market Volume (Units) Forecast by End-Use, 2020 to 2035
- Table 31: Western Europe Market Value (USD Mn) Forecast by Country, 2020 to 2035
- Table 32: Western Europe Market Volume (Units) Forecast by Country, 2020 to 2035
- Table 33: Western Europe Market Value (USD Mn) Forecast by Drive Type, 2020 to 2035
- Table 34: Western Europe Market Volume (Units) Forecast by Drive Type, 2020 to 2035
- Table 35: Western Europe Market Value (USD Mn) Forecast by Stack Height, 2020 to 2035
- Table 36: Western Europe Market Volume (Units) Forecast by Stack Height, 2020 to 2035
- Table 37: Western Europe Market Value (USD Mn) Forecast by Application, 2020 to 2035
- Table 38: Western Europe Market Volume (Units) Forecast by Application, 2020 to 2035
- Table 39: Western Europe Market Value (USD Mn) Forecast by End-Use, 2020 to 2035
- Table 40: Western Europe Market Volume (Units) Forecast by End-Use, 2020 to 2035
- Table 41: East Asia Market Value (USD Mn) Forecast by Country, 2020 to 2035
- Table 42: East Asia Market Volume (Units) Forecast by Country, 2020 to 2035
- Table 43: East Asia Market Value (USD Mn) Forecast by Drive Type, 2020 to 2035
- Table 44: East Asia Market Volume (Units) Forecast by Drive Type, 2020 to 2035
- Table 45: East Asia Market Value (USD Mn) Forecast by Stack Height, 2020 to 2035
- Table 46: East Asia Market Volume (Units) Forecast by Stack Height, 2020 to 2035
- Table 47: East Asia Market Value (USD Mn) Forecast by Application, 2020 to 2035
- Table 48: East Asia Market Volume (Units) Forecast by Application, 2020 to 2035
- Table 49: East Asia Market Value (USD Mn) Forecast by End-Use, 2020 to 2035
- Table 50: East Asia Market Volume (Units) Forecast by End-Use, 2020 to 2035
- Table 51: South Asia Pacific Market Value (USD Mn) Forecast by Country, 2020 to 2035
- Table 52: South Asia Pacific Market Volume (Units) Forecast by Country, 2020 to 2035
- Table 53: South Asia Pacific Market Value (USD Mn) Forecast by Drive Type, 2020 to 2035
- Table 54: South Asia Pacific Market Volume (Units) Forecast by Drive Type, 2020 to 2035
- Table 55: South Asia Pacific Market Value (USD Mn) Forecast by Stack Height, 2020 to 2035
- Table 56: South Asia Pacific Market Volume (Units) Forecast by Stack Height, 2020 to 2035
- Table 57: South Asia Pacific Market Value (USD Mn) Forecast by Application, 2020 to 2035
- Table 58: South Asia Pacific Market Volume (Units) Forecast by Application, 2020 to 2035
- Table 59: South Asia Pacific Market Value (USD Mn) Forecast by End-Use, 2020 to 2035
- Table 60: South Asia Pacific Market Volume (Units) Forecast by End-Use, 2020 to 2035
- Table 61: Eastern Europe Market Value (USD Mn) Forecast by Country, 2020 to 2035
- Table 62: Eastern Europe Market Volume (Units) Forecast by Country, 2020 to 2035
- Table 63: Eastern Europe Market Value (USD Mn) Forecast by Drive Type, 2020 to 2035
- Table 64: Eastern Europe Market Volume (Units) Forecast by Drive Type, 2020 to 2035
- Table 65: Eastern Europe Market Value (USD Mn) Forecast by Stack Height, 2020 to 2035
- Table 66: Eastern Europe Market Volume (Units) Forecast by Stack Height, 2020 to 2035
- Table 67: Eastern Europe Market Value (USD Mn) Forecast by Application, 2020 to 2035
- Table 68: Eastern Europe Market Volume (Units) Forecast by Application, 2020 to 2035
- Table 69: Eastern Europe Market Value (USD Mn) Forecast by End-Use, 2020 to 2035
- Table 70: Eastern Europe Market Volume (Units) Forecast by End-Use, 2020 to 2035
- Table 71: Middle East & Africa Market Value (USD Mn) Forecast by Country, 2020 to 2035
- Table 72: Middle East & Africa Market Volume (Units) Forecast by Country, 2020 to 2035
- Table 73: Middle East & Africa Market Value (USD Mn) Forecast by Drive Type, 2020 to 2035
- Table 74: Middle East & Africa Market Volume (Units) Forecast by Drive Type, 2020 to 2035
- Table 75: Middle East & Africa Market Value (USD Mn) Forecast by Stack Height, 2020 to 2035
- Table 76: Middle East & Africa Market Volume (Units) Forecast by Stack Height, 2020 to 2035
- Table 77: Middle East & Africa Market Value (USD Mn) Forecast by Application, 2020 to 2035
- Table 78: Middle East & Africa Market Volume (Units) Forecast by Application, 2020 to 2035
- Table 79: Middle East & Africa Market Value (USD Mn) Forecast by End-Use, 2020 to 2035
- Table 80: Middle East & Africa Market Volume (Units) Forecast by End-Use, 2020 to 2035
List Of Figures
- Figure 1: Global Market Volume (Units) Forecast 2020 to 2035
- Figure 2: Global Market Pricing Analysis
- Figure 3: Global Market Value (USD Mn) Forecast 2020 to 2035
- Figure 4: Global Market Value Share and BPS Analysis by Drive Type, 2025 and 2035
- Figure 5: Global Market Y-o-Y Growth Comparison by Drive Type, 2025 to 2035
- Figure 6: Global Market Attractiveness Analysis by Drive Type
- Figure 7: Global Market Value Share and BPS Analysis by Stack Height, 2025 and 2035
- Figure 8: Global Market Y-o-Y Growth Comparison by Stack Height, 2025 to 2035
- Figure 9: Global Market Attractiveness Analysis by Stack Height
- Figure 10: Global Market Value Share and BPS Analysis by Application, 2025 and 2035
- Figure 11: Global Market Y-o-Y Growth Comparison by Application, 2025 to 2035
- Figure 12: Global Market Attractiveness Analysis by Application
- Figure 13: Global Market Value Share and BPS Analysis by End-Use, 2025 and 2035
- Figure 14: Global Market Y-o-Y Growth Comparison by End-Use, 2025 to 2035
- Figure 15: Global Market Attractiveness Analysis by End-Use
- Figure 16: Global Market Value (USD Mn) Share and BPS Analysis by Region, 2025 and 2035
- Figure 17: Global Market Y-o-Y Growth Comparison by Region, 2025 to 2035
- Figure 18: Global Market Attractiveness Analysis by Region
- Figure 19: North America Market Incremental $ Opportunity, 2025 to 2035
- Figure 20: Latin America Market Incremental $ Opportunity, 2025 to 2035
- Figure 21: Western Europe Market Incremental $ Opportunity, 2025 to 2035
- Figure 22: East Asia Market Incremental $ Opportunity, 2025 to 2035
- Figure 23: South Asia Pacific Market Incremental $ Opportunity, 2025 to 2035
- Figure 24: Eastern Europe Market Incremental $ Opportunity, 2025 to 2035
- Figure 25: Middle East & Africa Market Incremental $ Opportunity, 2025 to 2035
- Figure 26: North America Market Value Share and BPS Analysis by Country, 2025 and 2035
- Figure 27: North America Market Value Share and BPS Analysis by Drive Type, 2025 and 2035
- Figure 28: North America Market Y-o-Y Growth Comparison by Drive Type, 2025 to 2035
- Figure 29: North America Market Attractiveness Analysis by Drive Type
- Figure 30: North America Market Value Share and BPS Analysis by Stack Height, 2025 and 2035
- Figure 31: North America Market Y-o-Y Growth Comparison by Stack Height, 2025 to 2035
- Figure 32: North America Market Attractiveness Analysis by Stack Height
- Figure 33: North America Market Value Share and BPS Analysis by Application, 2025 and 2035
- Figure 34: North America Market Y-o-Y Growth Comparison by Application, 2025 to 2035
- Figure 35: North America Market Attractiveness Analysis by Application
- Figure 36: North America Market Value Share and BPS Analysis by End-Use, 2025 and 2035
- Figure 37: North America Market Y-o-Y Growth Comparison by End-Use, 2025 to 2035
- Figure 38: North America Market Attractiveness Analysis by End-Use
- Figure 39: Latin America Market Value Share and BPS Analysis by Country, 2025 and 2035
- Figure 40: Latin America Market Value Share and BPS Analysis by Drive Type, 2025 and 2035
- Figure 41: Latin America Market Y-o-Y Growth Comparison by Drive Type, 2025 to 2035
- Figure 42: Latin America Market Attractiveness Analysis by Drive Type
- Figure 43: Latin America Market Value Share and BPS Analysis by Stack Height, 2025 and 2035
- Figure 44: Latin America Market Y-o-Y Growth Comparison by Stack Height, 2025 to 2035
- Figure 45: Latin America Market Attractiveness Analysis by Stack Height
- Figure 46: Latin America Market Value Share and BPS Analysis by Application, 2025 and 2035
- Figure 47: Latin America Market Y-o-Y Growth Comparison by Application, 2025 to 2035
- Figure 48: Latin America Market Attractiveness Analysis by Application
- Figure 49: Latin America Market Value Share and BPS Analysis by End-Use, 2025 and 2035
- Figure 50: Latin America Market Y-o-Y Growth Comparison by End-Use, 2025 to 2035
- Figure 51: Latin America Market Attractiveness Analysis by End-Use
- Figure 52: Western Europe Market Value Share and BPS Analysis by Country, 2025 and 2035
- Figure 53: Western Europe Market Value Share and BPS Analysis by Drive Type, 2025 and 2035
- Figure 54: Western Europe Market Y-o-Y Growth Comparison by Drive Type, 2025 to 2035
- Figure 55: Western Europe Market Attractiveness Analysis by Drive Type
- Figure 56: Western Europe Market Value Share and BPS Analysis by Stack Height, 2025 and 2035
- Figure 57: Western Europe Market Y-o-Y Growth Comparison by Stack Height, 2025 to 2035
- Figure 58: Western Europe Market Attractiveness Analysis by Stack Height
- Figure 59: Western Europe Market Value Share and BPS Analysis by Application, 2025 and 2035
- Figure 60: Western Europe Market Y-o-Y Growth Comparison by Application, 2025 to 2035
- Figure 61: Western Europe Market Attractiveness Analysis by Application
- Figure 62: Western Europe Market Value Share and BPS Analysis by End-Use, 2025 and 2035
- Figure 63: Western Europe Market Y-o-Y Growth Comparison by End-Use, 2025 to 2035
- Figure 64: Western Europe Market Attractiveness Analysis by End-Use
- Figure 65: East Asia Market Value Share and BPS Analysis by Country, 2025 and 2035
- Figure 66: East Asia Market Value Share and BPS Analysis by Drive Type, 2025 and 2035
- Figure 67: East Asia Market Y-o-Y Growth Comparison by Drive Type, 2025 to 2035
- Figure 68: East Asia Market Attractiveness Analysis by Drive Type
- Figure 69: East Asia Market Value Share and BPS Analysis by Stack Height, 2025 and 2035
- Figure 70: East Asia Market Y-o-Y Growth Comparison by Stack Height, 2025 to 2035
- Figure 71: East Asia Market Attractiveness Analysis by Stack Height
- Figure 72: East Asia Market Value Share and BPS Analysis by Application, 2025 and 2035
- Figure 73: East Asia Market Y-o-Y Growth Comparison by Application, 2025 to 2035
- Figure 74: East Asia Market Attractiveness Analysis by Application
- Figure 75: East Asia Market Value Share and BPS Analysis by End-Use, 2025 and 2035
- Figure 76: East Asia Market Y-o-Y Growth Comparison by End-Use, 2025 to 2035
- Figure 77: East Asia Market Attractiveness Analysis by End-Use
- Figure 78: South Asia Pacific Market Value Share and BPS Analysis by Country, 2025 and 2035
- Figure 79: South Asia Pacific Market Value Share and BPS Analysis by Drive Type, 2025 and 2035
- Figure 80: South Asia Pacific Market Y-o-Y Growth Comparison by Drive Type, 2025 to 2035
- Figure 81: South Asia Pacific Market Attractiveness Analysis by Drive Type
- Figure 82: South Asia Pacific Market Value Share and BPS Analysis by Stack Height, 2025 and 2035
- Figure 83: South Asia Pacific Market Y-o-Y Growth Comparison by Stack Height, 2025 to 2035
- Figure 84: South Asia Pacific Market Attractiveness Analysis by Stack Height
- Figure 85: South Asia Pacific Market Value Share and BPS Analysis by Application, 2025 and 2035
- Figure 86: South Asia Pacific Market Y-o-Y Growth Comparison by Application, 2025 to 2035
- Figure 87: South Asia Pacific Market Attractiveness Analysis by Application
- Figure 88: South Asia Pacific Market Value Share and BPS Analysis by End-Use, 2025 and 2035
- Figure 89: South Asia Pacific Market Y-o-Y Growth Comparison by End-Use, 2025 to 2035
- Figure 90: South Asia Pacific Market Attractiveness Analysis by End-Use
- Figure 91: Eastern Europe Market Value Share and BPS Analysis by Country, 2025 and 2035
- Figure 92: Eastern Europe Market Value Share and BPS Analysis by Drive Type, 2025 and 2035
- Figure 93: Eastern Europe Market Y-o-Y Growth Comparison by Drive Type, 2025 to 2035
- Figure 94: Eastern Europe Market Attractiveness Analysis by Drive Type
- Figure 95: Eastern Europe Market Value Share and BPS Analysis by Stack Height, 2025 and 2035
- Figure 96: Eastern Europe Market Y-o-Y Growth Comparison by Stack Height, 2025 to 2035
- Figure 97: Eastern Europe Market Attractiveness Analysis by Stack Height
- Figure 98: Eastern Europe Market Value Share and BPS Analysis by Application, 2025 and 2035
- Figure 99: Eastern Europe Market Y-o-Y Growth Comparison by Application, 2025 to 2035
- Figure 100: Eastern Europe Market Attractiveness Analysis by Application
- Figure 101: Eastern Europe Market Value Share and BPS Analysis by End-Use, 2025 and 2035
- Figure 102: Eastern Europe Market Y-o-Y Growth Comparison by End-Use, 2025 to 2035
- Figure 103: Eastern Europe Market Attractiveness Analysis by End-Use
- Figure 104: Middle East & Africa Market Value Share and BPS Analysis by Country, 2025 and 2035
- Figure 105: Middle East & Africa Market Value Share and BPS Analysis by Drive Type, 2025 and 2035
- Figure 106: Middle East & Africa Market Y-o-Y Growth Comparison by Drive Type, 2025 to 2035
- Figure 107: Middle East & Africa Market Attractiveness Analysis by Drive Type
- Figure 108: Middle East & Africa Market Value Share and BPS Analysis by Stack Height, 2025 and 2035
- Figure 109: Middle East & Africa Market Y-o-Y Growth Comparison by Stack Height, 2025 to 2035
- Figure 110: Middle East & Africa Market Attractiveness Analysis by Stack Height
- Figure 111: Middle East & Africa Market Value Share and BPS Analysis by Application, 2025 and 2035
- Figure 112: Middle East & Africa Market Y-o-Y Growth Comparison by Application, 2025 to 2035
- Figure 113: Middle East & Africa Market Attractiveness Analysis by Application
- Figure 114: Middle East & Africa Market Value Share and BPS Analysis by End-Use, 2025 and 2035
- Figure 115: Middle East & Africa Market Y-o-Y Growth Comparison by End-Use, 2025 to 2035
- Figure 116: Middle East & Africa Market Attractiveness Analysis by End-Use
- Figure 117: Global Market - Tier Structure Analysis
- Figure 118: Global Market - Company Share Analysis
- FAQs -
What is the global market size of the straddle carriers market in 2025?
The global straddle carriers market is valued at USD 921.5 million in 2025.
Who are the major players operating in the global straddle carriers market?
Prominent players in the market include Kalmar, Konecranes, Terex Port Solutions, Liebherr, SANY, and ZPMC.
What is the estimated valuation of the straddle carriers market by 2035?
The market is expected to reach a valuation of USD 1,604.2 million.
What value CAGR is the straddle carriers market exhibit over the last five years?
The historic growth rate of the straddle carriers market was 5.7% from 2020 to 2024.