- Market Value (2025): USD 14.6 Bn
- Estimated Value (2026): USD 15.7 Bn
- Forecast Value (2036): USD 32.1 Bn
- CAGR (2026-2036): 7.4%
What is the Diabetic Food Market forecast to be worth by 2036?
USD 15.7 billion in 2026 to USD 32.1 billion by 2036 at 7.4% CAGR.
- The diabetic food market crossed a valuation of USD 14.6 billion in 2025.
- Demand is projected to increase from USD 15.7 billion in 2026 to USD 32.1 billion by 2036.
- The market is forecast to record 7.4% CAGR from 2026 to 2036 as consumers and retailers use low-glycemic foods for routine diet control.
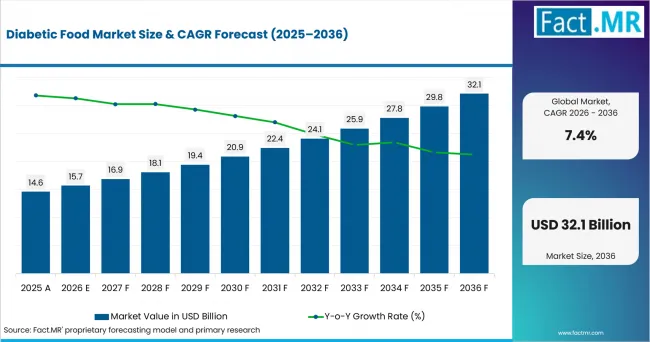
Diabetic Food Market Value Analysis | Source: Fact.MR
What are the defining numbers behind Diabetic Food Market growth?
USD 16.4 billion absolute opportunity by 2036, led by Low Glycemic Food Products, Sugar Replacement Technology and Individual Consumers.
- Demand Drivers in the Market
- Individual consumers need low-glycemic foods that fit breakfast and main meals without turning diet control into a clinical routine.
- Retail chains benefit from diabetic foods when shoppers buy them alongside broader wellness and weight management products.
- Food brands need sugar replacement systems that preserve sweetness and texture while lowering visible sugar claims.
- Nutrition teams are expected to prioritize fiber enrichment and protein fortification when products are positioned for daily glycemic support.
- Key Segments Analyzed
- By Product: Low Glycemic Food Products is expected to hold 53.8% share in 2026 supported by everyday meal control.
- By Application: Daily Meal Management is projected to account for 37.4% share in 2026 as home users need repeatable food choices.
- By End Use: Individual Consumers is anticipated to capture 68.7% share in 2026 since most purchases occur outside clinical settings.
- By Technology: Sugar Replacement Technology is estimated to represent 74.9% share in 2026 because taste acceptance remains the first purchase barrier.
- By Formulation: Dry Food Formulations is forecast to hold 45.6% share in 2026 owing to dry shelf stability.
- By Distribution Channel: Supermarkets & Hypermarkets is expected to account for 61.2% share in 2026 where organized retail gives shoppers label comparison and shelf choice.
- Analyst Opinion at Fact.MR
- Shambhu Nath Jha, Principal Consultant at Fact.MR, states: "Diabetic food succeeds when it feels like a normal food choice. Product acceptance is expected to depend on taste, label clarity and weekly repeat use. Suppliers should combine low-glycemic formulation skill with practical retail packaging."
- Strategic Implications
- Food manufacturers should build sugar-reduced recipes around flavor retention before expanding claims across more categories.
- Retail buyers should separate diabetic staples from general diet snacks so shoppers find routine meal options quickly.
- Ingredient suppliers should document glycemic response, sweetness profile, and texture performance for food brand trials.
- Investors should distinguish specialist diabetic brands from general wellness companies that only sell a few sugar-free items.
Germany is projected to record 8.5% CAGR through 2036 owing to high diabetes awareness and disciplined retail nutrition behavior. Brazil is anticipated to post 7.8% CAGR as adult diabetes prevalence keeps diet-control products relevant. The USA is forecast to advance at 7.0% CAGR because diagnosed diabetes and label attention expand the consumer base. The UK is estimated to reach 6.3% CAGR through retailer sugar reduction and prevention activity. Japan is expected to record 5.6% CAGR where aging and convenience nutrition shape demand.
How does the Diabetic Food Market break down by segment?
Low Glycemic Food Products lead Product at 53.8%; Sugar Replacement Technology leads Technology at 74.9%.
Which Product type leads?
Low Glycemic Food Products are expected to hold 53.8% share in 2026.
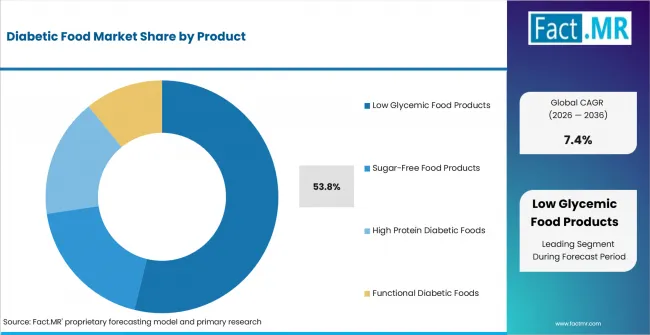
Diabetic Food Market Analysis By Product | Source: Fact.MR
Low glycemic food products are expected to lead Product because they suit routine meals without limiting shoppers to one eating occasion. Bakery and grain formats fit breakfast and snacking. Sugar-free foods support confectionery and desserts. High protein and functional foods serve consumers who want satiety or fiber alongside blood sugar control. NHS England stated in November 2025 that its Type 2 Diabetes Path to Remission Programme uses nutritionally complete total diet replacement products providing 800 to 900 calories per day during the first 12 weeks.
What leads the Application segment?
Daily Meal Management is projected to account for 37.4% share in 2026.
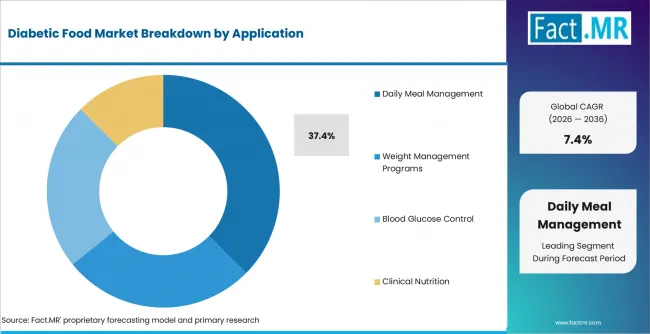
Diabetic Food Market Analysis By Application | Source: Fact.MR
Daily meal management is projected to lead Application since consumers need products across meals and snacks. Weight management remains linked to diabetes care. Blood glucose control supports postprandial and continuous glycemic support. Clinical nutrition remains narrower because hospitals and care facilities need stricter documentation before adoption.
How does End Use shape demand?
Individual Consumers are anticipated to capture 68.7% share in 2026.
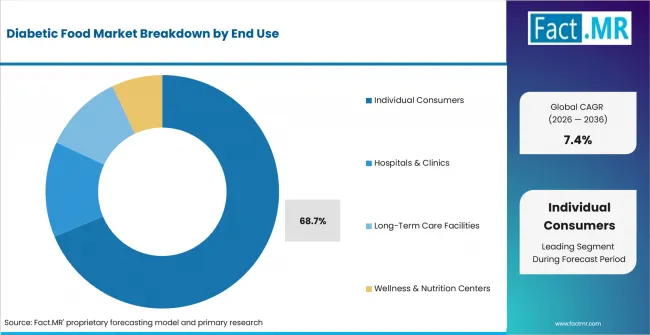
Diabetic Food Market Analysis By End Use | Source: Fact.MR
Individual consumers are anticipated to shape End Use because most purchases reflect household diet decisions. Adults favor products that need little education. Pediatric use depends on caregiver trust. Hospitals and long-term care facilities create demand where nutrition documentation and serving control are stronger. Japan's Statistics Bureau reported in February 2026 that two-or-more-person households spent an average of 314,001 yen per month in 2025, up 4.6% in nominal terms from 2024.
What supports Technology demand?
Sugar Replacement Technology is estimated to represent 74.9% share in 2026.
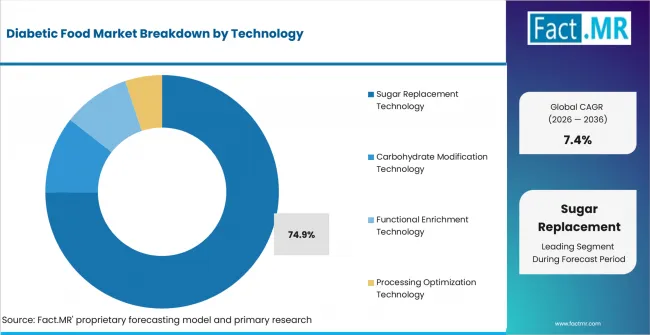
Diabetic Food Market Analysis By Technology | Source: Fact.MR
Sugar replacement technology is estimated to lead Technology because sweetness decides acceptance. Natural systems support cleaner labels. Artificial sweeteners remain useful where cost and taste stability count. Carbohydrate modification and functional enrichment support slower digestion and fiber fortification.
Which Formulation is selected most often?
Dry Food Formulations are forecast to hold 45.6% share in 2026.
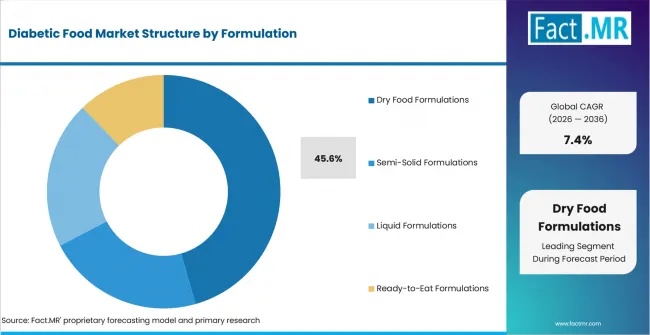
Diabetic Food Market Analysis By Formulation | Source: Fact.MR
Dry food formulations are forecast to lead Formulation as powders and snacks move easily through stores and online channels. Powders support meal replacement and breakfast nutrition. Semi-solid and liquid products serve more specific occasions. Shelf life and shipping efficiency make dry formats easier to scale.
What leads Distribution Channel demand?
Supermarkets & Hypermarkets are expected to account for 61.2% share in 2026.
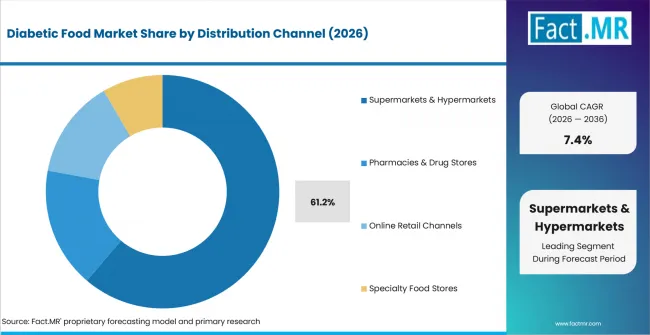
Diabetic Food Market Analysis By Distribution Channel | Source: Fact.MR
Supermarkets and hypermarkets are expected to lead Distribution Channel where shoppers compare diabetic foods with everyday groceries. National chains provide reach and shelf visibility. Premium grocers support higher-priced products. Pharmacies and online channels serve consumers who need advice or subscription packs. Germany's Federal Statistical Office reported in February 2026 that 2025 sales at broad-assortment food retailers such as supermarkets and self-service department stores rose 1.3% in real terms and 3.6% in nominal terms.
What is accelerating Diabetic Food Market adoption, and what is holding it back?
Daily blood sugar management drives it; taste, price and label clarity restrain it.
Drivers Impact Analysis
| DRIVER | (~) % IMPACT ON CAGR | GEOGRAPHIC RELEVANCE | IMPACT TIMELINE |
|---|---|---|---|
| Diabetes and prediabetes prevalence | +1.8% | USA, Germany, Brazil | Short term (<= 2 years) |
| Sugar reduction in retail foods | +1.5% | UK, USA, Japan | Short term (<= 2 years) |
| Low-glycemic meal routines | +1.2% | Germany, Japan | Medium term (2-4 years) |
| Organized retail access | +1.0% | USA, UK, Brazil | Medium term (2-4 years) |
| Ingredient reformulation capability | +0.8% | Global food brands | Long term (>= 4 years) |
- Diabetes and prediabetes prevalence: International Diabetes Federation reported in April 2025 that 589 million adults aged 20 to 79 lived with diabetes worldwide. The scale is expected to keep diabetic foods tied to everyday meals and routine pantry purchases.
- Low-glycemic meal routines: Daily breakfast and main meal products are expected to support repeat purchases. Familiar textures are likely to gain more trust than specialty formats that feel clinical.
- Organized retail access: Supermarkets and hypermarkets are expected to support label comparison and repeat replenishment. Shelf placement near wellness and sugar-free ranges is expected to improve discovery without relying on pharmacy traffic.
- Ingredient reformulation capability: Food developers need sweetener blends and fiber systems that work in snacks. Stable recipes are expected to protect texture and repeat purchase.
Opportunity Impact Analysis
| OPPORTUNITY | (~) % IMPACT ON CAGR | GEOGRAPHIC RELEVANCE | IMPACT TIMELINE |
| Daily breakfast nutrition | +1.1% | USA, Germany, UK | Short term (<= 2 years) |
| Sugar-free confectionery and desserts | +0.9% | USA, UK, Japan | Medium term (2-4 years) |
| Online replenishment packs | +0.7% | USA, Brazil, Japan | Medium term (2-4 years) |
| Clinical and dietitian-aligned meals | +0.6% | Germany, Japan | Long term (>= 4 years) |
- Daily breakfast nutrition: Breakfast products are expected to give brands a route into routine diabetic diets. Powders and bakery formats fit repeat morning use without changing household habits.
- Sugar-free confectionery and desserts: Desserts are expected to bring trial from shoppers who resist bland diet products. Texture quality and portion control are expected to decide repeat use.
- Online replenishment packs: E-commerce is expected to support repeat orders for specialist diabetic foods. Brand websites help smaller suppliers explain product fit and serving use.
- Clinical and dietitian-aligned meals: Hospitals and clinics need clearer nutrition documents. Simple serving guidance is anticipated to support selective institutional use.
Restraints Impact Analysis
| RESTRAINT | (~) % IMPACT ON CAGR | GEOGRAPHIC RELEVANCE | IMPACT TIMELINE |
|---|---|---|---|
| Taste gap versus regular foods | -1.2% | Global | Short term (<= 2 years) |
| Higher product price | -0.9% | Brazil, UK, USA | Short term (<= 2 years) |
| Consumer confusion over labels | -0.7% | USA, Germany, Japan | Medium term (2-4 years) |
| Specialist channel limits | -0.5% | Brazil and smaller markets | Long term (>= 4 years) |
- Taste gap versus regular foods: Diabetic foods lose repeat sales when sugar reduction changes flavor or mouthfeel. Brands need formulation work before wider retail expansion.
- Higher product price: Specialist ingredients raise shelf prices. Value-sensitive consumers are expected to choose standard foods when benefits are unclear.
- Consumer confusion over labels: Claims around low sugar, sugar-free, low glycemic and diabetic-friendly products can blur. Confusing labels are expected to slow trial.
- Specialist channel limits: Pharmacies add credibility but limit discovery. Supermarket availability is expected to support regular household purchase.
Which countries are scaling Diabetic Food Market fastest?
- The country comparison spans 2.9 percentage points across the forecast period.
- Germany remains above Brazil through strict nutrition awareness, retail depth, and a large diagnosed population.
- Brazil follows through high adult diabetes prevalence and a wide consumer base for practical diet foods.
- The USA remains a large value pool as diagnosed diabetes and prediabetes create repeat demand.
- The UK grows through sugar reduction policy and health survey evidence of diagnosed and undiagnosed diabetes.
- Japan closes the displayed range through aging, diet monitoring, and convenience nutrition needs.
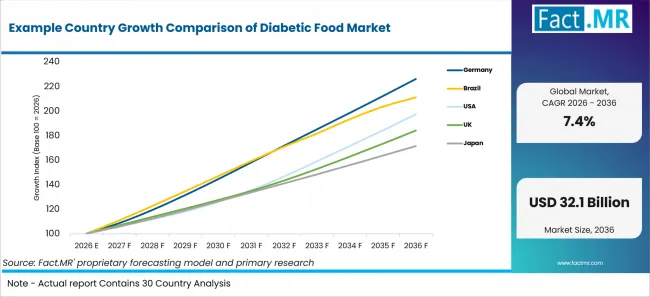
Example Country Growth Comparison Of Diabetic Food Market | Source: Fact.MR
Country CAGR (2026-2036)
| COUNTRY | CAGR (2026-2036) |
|---|---|
| Germany | 8.5% |
| Brazil | 7.8% |
| USA | 7.0% |
| UK | 6.3% |
| Japan | 5.6% |
What supports Germany adoption?
8.5% CAGR, supported by nutrition discipline and diabetes care awareness.
Germany’s growth is supported by a large diabetes population and stronger nutrition monitoring among consumers. Retailers are expected to benefit when shoppers compare sugar, fiber, and carbohydrate claims before repeat purchase, while dietitians and pharmacies add credibility when portion guidance is simple and meal use is clear. OECD reported in November 2025 that Germany recorded 810 avoidable chronic-condition admissions per 100,000 people. Premium diabetic foods also face price pressure when standard low-sugar products appear close enough for everyday shoppers, while small brands need clear nutrition proof before retailers expand shelf space.
How is Brazil scaling demand?
7.8% CAGR, shaped by high adult diabetes prevalence and wider retail access.
Brazil’s growth reflects high diabetes prevalence and broader access through supermarkets and other retail channels. Supermarkets are expected to support price visibility and frequent replenishment for routine diet foods. Income sensitivity restrains premium diabetic products when standard diet foods remain cheaper, while regional distribution gaps limit specialist brands outside major cities and pharmacy networks.
What is driving USA growth from 2026 to 2036?
7.0% CAGR, backed by diagnosed diabetes, prediabetes and zero-sugar reformulation.
The USA’s growth is supported by a large diagnosed diabetes population, nutrition-label reformulation and wider zero-sugar product development. USDA Economic Research Service reported in May 2026 that U.S. food-at-home prices increased 2.3% in 2025. Label overload can slow trial when diabetic foods compete against diet and keto products, while price premiums restrict regular household pantry use for consumers managing weekly grocery budgets.
How does the UK perform?
6.3% CAGR, reinforced by sugar policy and measured diabetes prevalence.
The UK’s growth is reinforced by diabetes awareness, prevention programs and policies encouraging lower-sugar food and beverage formulations. NHS England Digital reported in January 2026 that total adult diabetes reached 9% in the 2024 Health Survey for England, while NHS England said in December 2025 that nearly one million people had started its Diabetes Prevention Programme. Grocery retailers support sugar, calorie, and fiber comparison for shoppers reading front and back labels.
What supports Japan’s growth?
5.6% CAGR, led by aging consumers and routine diet monitoring.
Japan’s growth is supported by an aging population, a large diabetes burden and routine attention to nutrition information. Convenience retail and small packs are expected to support repeat buying among older consumers, while dry and ready-to-eat formats suit consumers who need simple meal control. Mature demand requires stronger taste proof before shoppers switch from familiar products, while imported specialist foods face shelf limits when domestic brands match local taste preferences.
Who leads the Diabetic Food Market?
Nestlé show the clearest direct relevance; Unilever, PepsiCo and Coca-Cola strengthen the reduced-sugar portfolio base.
Nestlé participates through medical nutrition and wellness portfolios. Unilever, PepsiCo and Coca-Cola contribute through sugar-reduced and zero-sugar portfolios.
Which companies are the key providers?
Key companies include Nestlé S.A., Unilever PLC, PepsiCo, Inc., Abbott Laboratories (Glucerna).
- Nestlé S.A.
- Unilever PLC
- PepsiCo, Inc.
- Abbott Laboratories (Glucerna)
Bibliography
- Centers for Disease Control and Prevention. (2026, January 21). National Diabetes Statistics Report.
- International Diabetes Federation. (2025, April 7). Over 250 million people worldwide unaware they have diabetes, according to new IDF research.
- International Diabetes Federation. (2025). IDF Diabetes Atlas (11th ed.).
- NHS England Digital. (2026, January 27). Adults’ health. In Health Survey for England, 2024.
- Organisation for Economic Co-operation and Development. (2025, November 13). Health at a Glance 2025: OECD indicators. OECD Publishing.
- Office for National Statistics. (2026, February 18). Consumer price inflation, UK: January 2026.
This Report Answers
- The report provides strategic intelligence on the Diabetic Food Market across low-glycemic foods, reduced sugar products, and retail channel choices.
- Segment analysis covers low-glycemic products alongside sugar-free confectionery and dry food formulations as practical retail categories.
- Technology coverage includes food sweeteners, sugar replacement systems, and carbohydrate modification for diabetic foods.
- Ingredient scope connects diabetic food formulation to resistant starch and slowly digestible carbohydrates where slower digestion supports glycemic positioning.
- Retail and product-scope checks compare diabetic foods with free-from foods where claims overlap but use cases differ.
What does the Diabetic Food Market cover?
The Diabetic Food Market covers packaged foods and beverages for blood sugar, calorie, or low-glycemic diet management. Coverage includes bakery products, grains, desserts, protein snacks, fiber foods, powders and drinks sold through retail and online channels.
What is included in the scope?
The scope includes consumer and institutional diabetic foods where formulation and labeling support blood sugar management. Low glycemic, sugar-free, high protein and functional diabetic foods are included. Distribution covers grocery, pharmacy, online and specialty channels.
What is excluded from the scope?
General diet foods without diabetic, low-glycemic, sugar-free or blood sugar positioning are excluded. Prescription drugs, glucose monitoring devices, insulin and clinical services are excluded. Standard snacks and beverages are counted only when they have a direct sugar-control use case.
How Was the Analysis Built?
The analysis draws on 120+ sources, 35+ company portfolios, 25+ countries and more than 20 industry interviews.
- Primary Research: Primary research includes discussions with manufacturers, ingredient suppliers, distributors, retailers, dietitians and subject-matter experts. These interviews examine purchasing priorities, product acceptance, pricing barriers, documentation needs and retail channel behavior.
- Desk Research: Desk research covers government statistics, health agency publications, diabetes associations, regulatory sources, company announcements, nutrition policy and company portfolios. Every source used in the analysis is documented in the bibliography.
- Market Sizing and Forecasting: Market estimates combine diabetes prevalence, retail availability, product pricing, company participation, country-level growth, reformulation activity and barriers to expansion.
- Data Validation and Update Cycle: Findings are validated against public data, company activity, regulatory changes, product launches and procurement trends.
What is the report’s scope and coverage?
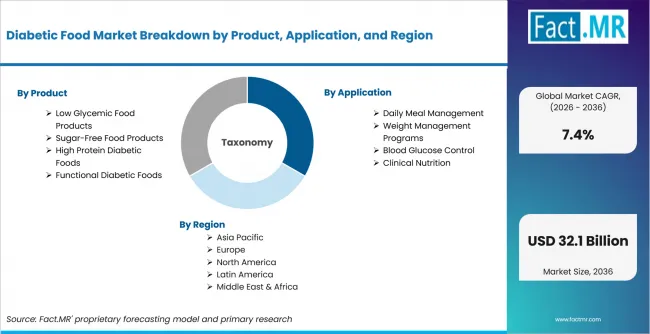
Diabetic Food Market Breakdown By Product, Application, And Region | Source: Fact.MR
| ATTRIBUTE | DETAILS |
|---|---|
| Quantitative Units | USD 15.7 billion |
| Market Definition | Packaged foods and beverages for diabetes, blood sugar, calorie, or low-glycemic diet management |
| Product | Low Glycemic Food Products; Sugar-Free Food Products; High Protein Diabetic Foods; Functional Diabetic Foods |
| Application | Daily Meal Management; Weight Management Programs; Blood Glucose Control; Clinical Nutrition |
| End Use | Individual Consumers; Hospitals & Clinics; Long-Term Care Facilities; Wellness & Nutrition Centers |
| Technology | Sugar Replacement Technology; Carbohydrate Modification Technology; Functional Enrichment Technology; Processing Optimization Technology |
| Formulation | Dry Food Formulations; Semi-Solid Formulations; Liquid Formulations; Ready-to-Eat Formulations |
| Distribution Channel | Supermarkets & Hypermarkets; Pharmacies & Drug Stores; Online Retail Channels; Specialty Food Stores |
| Regions Covered | North America; Latin America; Europe; East Asia; South Asia and Pacific; Middle East and Africa |
| Countries Covered | Germany; Brazil; USA; UK; Japan |
| Key Companies Profiled | Nestlé S.A.; Unilever PLC; PepsiCo, Inc.; Abbott Laboratories (Glucerna) |
| Forecast Period | 2026 to 2036 |
| Approach | Hybrid top-down and bottom-up approach using diabetes prevalence, retail channels, product formats, sugar policy, formulation systems, country patterns, and company portfolios |
How is the market segmented?
-
By Product
- Low Glycemic Food Products
- Low Glycemic Bakery Products
- Low Glycemic Grain Products
- Sugar-Free Food Products
- Sugar-Free Confectionery
- Sugar-Free Desserts
- High Protein Diabetic Foods
- Protein Enriched Snacks
- Protein Meal Products
- Functional Diabetic Foods
- Fiber Enriched Foods
- Probiotic Functional Foods
- Low Glycemic Food Products
-
By Application
- Daily Meal Management
- Breakfast Nutrition
- Main Meal Nutrition
- Weight Management Programs
- Calorie Controlled Diets
- Lifestyle Nutrition
- Blood Glucose Control
- Postprandial Management
- Continuous Glycemic Support
- Clinical Nutrition
- Hospital Dietary Nutrition
- Long-Term Care Nutrition
- Daily Meal Management
-
By End Use
- Individual Consumers
- Adult Consumers
- Pediatric Consumers
- Hospitals & Clinics
- General Hospitals
- Specialty Clinics
- Long-Term Care Facilities
- Nursing Homes
- Rehabilitation Centers
- Wellness & Nutrition Centers
- Diet Counseling Centers
- Fitness Nutrition Centers
- Individual Consumers
-
By Technology
- Sugar Replacement Technology
- Natural Sweetener Systems
- Artificial Sweetener Systems
- Carbohydrate Modification Technology
- Slow Digestible Carbohydrates
- Carbohydrate Blending Systems
- Functional Enrichment Technology
- Fiber Fortification Systems
- Protein Enrichment Systems
- Processing Optimization Technology
- Low Temperature Processing
- Encapsulation Technology
- Sugar Replacement Technology
-
By Formulation
- Dry Food Formulations
- Powder Based Products
- Granular Products
- Semi-Solid Formulations
- Spread Formulations
- Gel Formulations
- Liquid Formulations
- Ready-to-Drink Products
- Concentrated Liquids
- Ready-to-Eat Formulations
- Packaged Meal Products
- Snack Products
- Dry Food Formulations
-
By Distribution Channel
- Supermarkets & Hypermarkets
- National Retail Chains
- Premium Grocery Stores
- Pharmacies & Drug Stores
- Retail Pharmacy Chains
- Specialty Medical Stores
- Online Retail Channels
- E-Commerce Platforms
- Direct Brand Websites
- Specialty Food Stores
- Health Food Retailers
- Nutrition Boutiques
- Supermarkets & Hypermarkets
-
By Region
- North America
- USA
- Latin America
- Brazil
- Europe
- Germany
- UK
- East Asia
- Japan
- South Asia & Pacific
- Middle East & Africa