Mobile Construction Cranes Market
Mobile Construction Cranes Market Analysis, By Product Type, By Capacity, By End-Use and Region - Market Insights 2025 to 2035
Analysis Of Mobile Construction Cranes Market Covering 30 + Countries Including Analysis Of US, Canada, UK, Germany, France, Nordics, GCC Countries, Japan, Korea And Many More
Mobile Construction Cranes Market Outlook (2025 to 2035)
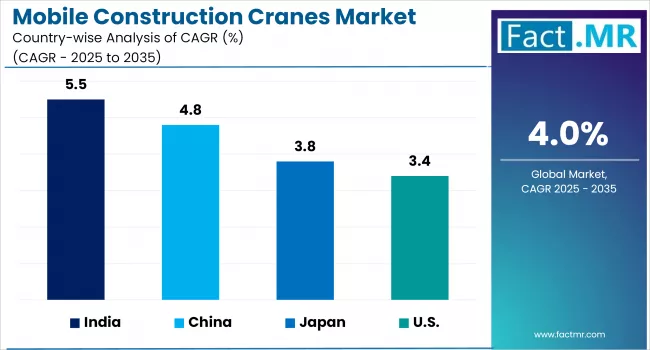
The global mobile construction cranes market is projected to increase from USD 11.6 billion in 2025 to USD 17.2 billion by 2035, with a CAGR of 4.0%, driven by steady infrastructure expansion, renewable energy projects, and urban development.
Emerging economies are driving this growth through large-scale construction activity, while trends in wind energy and modular building are increasing crane utilization.
What are the Drivers of the Mobile Construction Cranes Market?
The mobile construction cranes market is gaining traction globally, driven by rising infrastructure development, increased investments in renewable energy, and the growing need for versatile lifting solutions on modern construction sites.
One of the primary growth catalysts is the global infrastructure push, particularly in emerging markets across Asia-Pacific, Latin America, and the Middle East. Governments and private stakeholders are investing heavily in road, bridge, urban transit system, and industrial zone projects that require reliable and mobile heavy lifting capabilities. For instance, India’s National Infrastructure Pipeline (NIP) and China’s Belt and Road Initiative (BRI) are driving demand for high-capacity, road-legal cranes that can quickly move between sites.
The expansion of renewable energy, especially wind power, has become a major driver. Wind turbine installation requires cranes with extended reach and precision handling, especially for lifting nacelles and rotor blades at significant heights. As countries accelerate their clean energy targets, crane utilization is increasing in both onshore and offshore wind projects.
Another key factor is the shift toward modular and prefabricated construction methods, which require efficient lifting of large structural components. Mobile cranes provide flexibility and speed in assembling modules, particularly in urban environments where space constraints demand maneuverability.
Technological innovation also plays a crucial role. The integration of telematics, GPS tracking, load monitoring systems, and remote diagnostics is enhancing operational safety and equipment utilization. Hybrid and electric cranes are emerging to meet sustainability goals, particularly in regions with stringent emissions regulations, such as Europe.
What are the Regional Trends of the Mobile Construction Cranes Market?
Regional dynamics in the mobile construction cranes market vary based on infrastructure priorities, industrialization, and energy transitions.
Asia-Pacific leads in market share, driven by large-scale infrastructure development in China, India, Indonesia, and Vietnam. Massive investments in transportation corridors, smart cities, and energy projects, especially wind farms, are fueling sustained demand for mobile cranes.
China’s Belt and Road Initiative and India’s Smart Cities Mission are prime examples of bolstering equipment usage across civil and industrial projects.
North America shows steady growth, supported by infrastructure renewal programs in the U.S. and Canada. The Bipartisan Infrastructure Law in the U.S. is driving upgrades in roads, bridges, and energy systems, increasing demand for high-performance, emission-compliant mobile cranes.
Urban redevelopment and wind energy installations, particularly in the Midwest, are also contributing to the growing demand for versatile, heavy-lifting equipment that can operate efficiently in diverse construction environments.
Europe is focusing on sustainability, prompting the use of hybrid and electric cranes in densely populated cities. Countries like Germany, France, and the Netherlands are advancing green construction practices and offshore wind farms, pushing demand for low-emission, compact lifting equipment. Additionally, aging fleet replacement is a key trend in the region.
The Middle East & Africa are witnessing an uptick in crane demand, with Gulf countries undertaking mega-projects such as NEOM in Saudi Arabia and Expo-related developments in the UAE. Construction of airports, entertainment hubs, and logistics zones is driving growth, despite occasional economic headwinds.
Latin America remains a developing opportunity. Brazil, Mexico, and Chile are investing in transport and energy infrastructure, though market volatility and political uncertainty can impact project timelines and equipment imports.
What are the Challenges and Restraining Factors of the Mobile Construction Cranes Market?
The mobile construction cranes market faces barriers despite rising demand. High equipment costs remain a significant challenge, particularly for smaller contractors, prompting many to opt for rentals over new purchases. Fluctuating raw material prices and global supply chain disruptions also increase manufacturing and delivery costs.
A shortage of skilled operators further limits deployment, as newer crane models require advanced handling and maintenance expertise. In developed regions, strict emission regulations raise production expenses, while in developing markets, inconsistent infrastructure investment and import restrictions can hinder growth. Together, these factors pose operational and financial hurdles that may temper the market's expansion.
Country-Wise Outlook
U.S. Mobile Construction Cranes Market Strengthens Amid Infrastructure Push and Technological Upgrades
The U.S. market for mobile construction cranes is tightening its grip due to historic infrastructure spending and evolving construction demands. Federal policies, such as the Bipartisan Infrastructure Law, are funding large-scale upgrades to roads, bridges, and transit systems, driving consistent demand for versatile lifting equipment, particularly crawler and rough-terrain cranes, which are well-suited for resilient concrete and transportation projects.
Crane utilization is also increasing in energy sectors, with wind farm installations and oil and gas projects requiring high-capacity lifting solutions. North America is rapidly adopting hybrid and electric mobile cranes, driven by projects such as the hydrogen-powered crane at the Port of Los Angeles and evolving emission regulations.
Urban logistics and industrial expansion are further driving demand for truck-mounted cranes and modular designs, which are ideal for navigating tight urban sites. Technological advancements in crane telematics, remote monitoring, and safety systems are enhancing jobsite efficiency while ensuring compliance with stringent U.S. regulations.
Meanwhile, rental services are gaining popularity among smaller contractors who prefer flexible access to advanced crane models without committing to large upfront investments.
China’s Mobile Construction Cranes Market Expands on Infrastructure and Energy Demand
China is experiencing robust growth in its mobile construction crane market, driven by large-scale infrastructure projects, rapid urbanization, and expanding renewable energy capacity. The government's ongoing investments, totaling nearly ¥24 trillion in 2023, in highways, high-speed rail, airports, and smart city developments have significantly increased the demand for high-capacity, mobile lifting equipment. Urban development in major cities like Shanghai, Shenzhen, and Chengdu has intensified the need for agile cranes that can operate efficiently in dense construction zones.
At the same time, China’s aggressive push into renewable energy, wind power, has created new opportunities for mobile cranes capable of handling heavy turbine components at high elevations. According to the Chinese Wind Energy Association, crane deployment in wind energy installations grew by over 50% year-over-year in 2023 alone. Furthermore, domestic manufacturers such as XCMG, Sany, and Zoomlion are expanding their product portfolios with hybrid and electric crane models, aligning with national sustainability goals and the “Made in China 2025” initiative.
Japan Strengthens Mobile Construction Crane Market Through Infrastructure Renewal and Technological Precision
Japan’s mobile construction crane market is gaining momentum, driven by large-scale infrastructure maintenance, urban redevelopment, and a push toward smarter construction practices.
Scheduled upgrades to aging bridges, tunnels, and rail networks under the National Resilience Plan are driving increased demand for high-precision crawler and rough-terrain cranes. Cranes featuring automated leveling, load monitoring, and compact designs are especially favored for their suitability in narrow urban construction environments.
The rise in modular building and steel-structured developments, especially in metropolitan regions such as Tokyo and Osaka, has also driven crane utilization in prefabricated assembly and vertical lift operations. These requirements are being met by mobile cranes offering high reach and telescopic flexibility.
Industrial renewal initiatives in key manufacturing and port cities, such as Nagoya and Kobe, have boosted demand for truck-mounted and all-terrain cranes that can operate effectively in both indoor and outdoor environments. A preference is growing for hybrid and low-emission models to comply with the strict environmental standards set by Japan’s Energy Conservation Law. Local manufacturers like Tadano, Kobelco, and Kato are leading the market with Japan-built, precise, and eco-efficient crane models.
Category-wise Analysis
Truck Crane to Exhibit Leading by Product Type
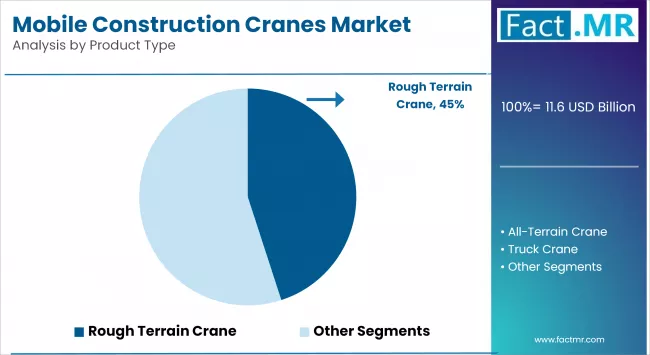
Truck cranes are expected to hold the leading share within mobile construction crane types, due to their unmatched flexibility and ease of deployment. Mounted on standard or all-terrain truck chassis, these cranes are ideal for tasks ranging from urban construction and logistics to utility maintenance and emergency recovery.
Their capability to travel on public roads without needing licensed transport equipment allows rapid repositioning between job sites and lower transport costs compared to crawler or rough-terrain models. Truck cranes also offer a broad lifting range, from 20 to 400 tons, meeting diverse project needs without the need for additional accessories.
Manufacturers are enhancing these cranes with telescopic booms, hydraulic counterweights, and smart load-moment indicators, improving safety, precision, and efficiency. As urban projects and infrastructure expansions grow, truck cranes remain the preferred choice for contractors due to their mobility, scalability, and cost-effective performance.
<100 T to Exhibit Leading by Capacity
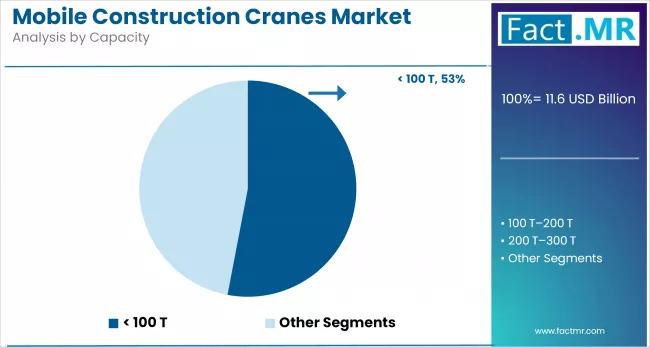
Mobile construction cranes with lifting capacities below 100 tons are expected to maintain the largest market share, driven by their adaptability and cost-effectiveness on varied job sites.
These mid-range cranes typically weigh between 20 and 100 tons. They are ideal for general construction, utility installation, pipeline work, and modular building, where they strike a balance between portability and capable lifting performance.
Design updates, such as full 360° rotation, multi-section telescopic booms, and hydraulic jib attachments, are increasing their versatility. The integration of smart features, including load-sensing systems, onboard telematics, and remote diagnostics, is also enhancing safety and job site efficiency.
Because they require minimal transportation permits and can operate on standard roads, sub-100-ton cranes offer rapid setup and relocation, making them attractive to contractors working on residential, commercial, and energy infrastructure projects. Their balance of operating cost, mobility, and lifting capacity cements their position as the top choice in the mid-capacity crane segment.
Construction to Exhibit Leading by End-Use
The construction industry remains the largest end-user segment for mobile construction cranes, driven by a steady pipeline of infrastructure development, urban redevelopment, and commercial building projects. These cranes are crucial for lifting and placing structural elements, such as steel beams, precast concrete panels, and mechanical systems, in high-rise and modular construction.
Ongoing investment in public infrastructure, including highways, rail networks, and smart city initiatives, has driven consistent demand for versatile lifting equipment that can be rapidly deployed and relocated. Mobile cranes are also favored in time-sensitive commercial and industrial projects where efficiency and maneuverability are key. The adoption of safety-enhancing technologies, automated controls, and emission-compliant engines further solidifies their role in modern construction operations.
Competitive Analysis
The mobile construction cranes industry is increasingly competitive, with both global heavyweights and regionally specialized manufacturers. Leading players, including Liebherr International AG, Terex Corporation, The Manitowoc Company, Inc., Tadano Ltd., and Kobelco Construction Machinery Co., Ltd., continue to set industry benchmarks in innovation, lifting capacity, and operational safety.
These companies are investing heavily in smart technologies such as telematics integration, load monitoring systems, and emission-reducing hybrid powertrains to meet evolving construction demands and regulatory standards. Liebherr, for example, has expanded its line of all-terrain cranes with digital control systems, while Tadano has introduced electric-powered rough-terrain models for lower carbon operations.
Beyond the major OEMs, regional players like Zoomlion, XCMG, SANY, Kato Works, and Böcker Maschinenwerke GmbH are intensifying competition by offering cost-effective, locally adapted machines in Asia and Europe. Meanwhile, companies such as Demag, Link-Belt Cranes, and Fassi Gru continue to grow their niche footprints in specialized applications and compact lifting solutions.
The market’s competitiveness is further shaped by rising demand for rental fleets, prompting collaboration between OEMs and service providers to offer flexible leasing options and aftersales support. As infrastructure projects grow in complexity, manufacturers are differentiating through performance, automation, fuel efficiency, and operator safety, ensuring the competitive landscape remains dynamic and innovation-driven.
Recent Development
- In April 2025, Liebherr International AG introduced a hybrid mobile crane capable of zero-emission, battery-powered operation on-site for up to five hours, offering full diesel-electric flexibility, making it ideal for low-emission zones.
- In January 2025, Liebherr International AG unveiled its next-generation LICCON3 control system on a new compact 120 t crane, setting a new benchmark for crane technology and operator experience.
Segmentation of the Mobile Construction Cranes Market
-
By Product Type :
- Truck Crane
- Rough Terrain Crane
- All-Terrain Crane
- Crawler Crane
-
By Capacity :
- <100 T
- 100 T-200 T
- 200 T-300T
- >300 T
-
By End-Use :
- Construction
- Industrial
- Utility
-
By Region :
- North America
- Latin America
- Western Europe
- Eastern Europe
- East Asia
- South Asia Pacific
- Middle East & Africa
Table of Content
- Executive Summary
- Global Market Outlook
- Demand-side Trends
- Supply-side Trends
- Technology Roadmap Analysis
- Analysis and Recommendations
- Market Overview
- Market Coverage / Taxonomy
- Market Definition / Scope / Limitations
- Market Background
- Market Dynamics
- Drivers
- Restraints
- Opportunity
- Trends
- Scenario Forecast
- Demand in Optimistic Scenario
- Demand in Likely Scenario
- Demand in Conservative Scenario
- Opportunity Map Analysis
- Product Life Cycle Analysis
- Supply Chain Analysis
- Supply Side Participants and their Roles
- Producers
- Mid-Level Participants (Traders/ Agents/ Brokers)
- Wholesalers and Distributors
- Value Added and Value Created at Node in the Supply Chain
- List of Component Suppliers
- List of Existing and Potential Buyers
- Supply Side Participants and their Roles
- Investment Feasibility Matrix
- Value Chain Analysis
- Profit Margin Analysis
- Wholesalers and Distributors
- PESTLE and Porter’s Analysis
- Regulatory Landscape
- By Key Regions
- By Key Countries
- Production and Consumption Statistics
- Import and Export Statistics
- Market Dynamics
- Global Market Analysis 2020 to 2024 and Forecast, 2020 to 2035
- Historical Market Size Value (USD Bn) & Volume (Units) Analysis, 2020 to 2024
- Current and Future Market Size Value (USD Bn) & Volume (Units) Projections, 2020 to 2035
- Y-o-Y Growth Trend Analysis
- Absolute $ Opportunity Analysis
- Global Market Pricing Analysis 2020 to 2024 and Forecast 2020 to 2035
- Global Market Analysis 2020 to 2024 and Forecast 2020 to 2035, By Product Type
- Introduction / Key Findings
- Historical Market Size Value (USD Bn) & Volume (Units) Analysis By Product Type, 2020 to 2024
- Current and Future Market Size Value (USD Bn) & Volume (Units) Analysis and Forecast By Product Type, 2020 to 2035
- Truck Crane
- Rough Terrain Crane
- All Terrain Crane
- Crawler Crane
- Y-o-Y Growth Trend Analysis By Product Type, 2020 to 2024
- Absolute $ Opportunity Analysis By Product Type, 2020 to 2035
- Global Market Analysis 2020 to 2024 and Forecast 2020 to 2035, By Capacity
- Introduction / Key Findings
- Historical Market Size Value (USD Bn) & Volume (Units) Analysis By Capacity, 2020 to 2024
- Current and Future Market Size Value (USD Bn) & Volume (Units) Analysis and Forecast By Capacity, 2020 to 2035
- <100 T
- 100 T–200 T
- 200 T–300 T
- >300 T
- Y-o-Y Growth Trend Analysis By Capacity, 2020 to 2024
- Absolute $ Opportunity Analysis By Capacity, 2020 to 2035
- Global Market Analysis 2020 to 2024 and Forecast 2020 to 2035, By End-Use
- Introduction / Key Findings
- Historical Market Size Value (USD Bn) & Volume (Units) Analysis By End-Use, 2020 to 2024
- Current and Future Market Size Value (USD Bn) & Volume (Units) Analysis and Forecast By End-Use, 2020 to 2035
- Construction
- Industrial
- Utility
- Y-o-Y Growth Trend Analysis By End-Use, 2020 to 2024
- Absolute $ Opportunity Analysis By End-Use, 2020 to 2035
- Global Market Analysis 2020 to 2024 and Forecast 2020 to 2035, By Region
- Introduction
- Historical Market Size Value (USD Bn) & Volume (Units) Analysis By Region, 2020 to 2024
- Current Market Size Value (USD Bn) & Volume (Units) Analysis and Forecast By Region, 2020 to 2035
- North America
- Latin America
- Europe
- East Asia
- South Asia
- Oceania
- MEA
- Market Attractiveness Analysis By Region
- North America Market Analysis 2020 to 2024 and Forecast 2020 to 2035, By Country
- Historical Market Size Value (USD Bn) & Volume (Units) Trend Analysis By Market Taxonomy, 2020 to 2024
- Market Size Value (USD Bn) & Volume (Units) Forecast By Market Taxonomy, 2020 to 2035
- By Country
- U.S.
- Canada
- By Product Type
- By Capacity
- By End-Use
- By Country
- Market Attractiveness Analysis
- By Country
- By Product Type
- By Capacity
- By End-Use
- Key Takeaways
- Latin America Market Analysis 2020 to 2024 and Forecast 2020 to 2035, By Country
- Historical Market Size Value (USD Bn) & Volume (Units) Trend Analysis By Market Taxonomy, 2020 to 2024
- Market Size Value (USD Bn) & Volume (Units) Forecast By Market Taxonomy, 2020 to 2035
- By Country
- Brazil
- Mexico
- Argentina
- Chile
- Peru
- Rest of Latin America
- By Product Type
- By Capacity
- By End-Use
- By Country
- Market Attractiveness Analysis
- By Country
- By Product Type
- By Capacity
- By End-Use
- Key Takeaways
- Europe Market Analysis 2020 to 2024 and Forecast 2020 to 2035, By Country
- Historical Market Size Value (USD Bn) & Volume (Units) Trend Analysis By Market Taxonomy, 2020 to 2024
- Market Size Value (USD Bn) & Volume (Units) Forecast By Market Taxonomy, 2020 to 2035
- By Country
- Germany
- Italy
- France
- U.K.
- Spain
- Russia
- BENELUX
- Rest of Europe
- By Product Type
- By Capacity
- By End-Use
- By Country
- Market Attractiveness Analysis
- By Country
- By Product Type
- By Capacity
- By End-Use
- Key Takeaways
- East Asia Market Analysis 2020 to 2024 and Forecast 2020 to 2035, By Country
- Historical Market Size Value (USD Bn) & Volume (Units) Trend Analysis By Market Taxonomy, 2020 to 2024
- Market Size Value (USD Bn) & Volume (Units) Forecast By Market Taxonomy, 2020 to 2035
- By Country
- China
- Japan
- South Korea
- By Product Type
- By Capacity
- By End-Use
- By Country
- Market Attractiveness Analysis
- By Country
- By Product Type
- By Capacity
- By End-Use
- Key Takeaways
- South Asia Market Analysis 2020 to 2024 and Forecast 2020 to 2035, By Country
- Historical Market Size Value (USD Bn) & Volume (Units) Trend Analysis By Market Taxonomy, 2020 to 2024
- Market Size Value (USD Bn) & Volume (Units) Forecast By Market Taxonomy, 2020 to 2035
- By Country
- India
- Thailand
- Malaysia
- Indonesia
- Rest of South Asia
- By Product Type
- By Capacity
- By End-Use
- By Country
- Market Attractiveness Analysis
- By Country
- By Product Type
- By Capacity
- By End-Use
- Key Takeaways
- Oceania Market Analysis 2020 to 2024 and Forecast 2020 to 2035, By Country
- Historical Market Size Value (USD Bn) & Volume (Units) Trend Analysis By Market Taxonomy, 2020 to 2024
- Market Size Value (USD Bn) & Volume (Units) Forecast By Market Taxonomy, 2020 to 2035
- By Country
- Australia
- New Zealand
- By Product Type
- By Capacity
- By End-Use
- By Country
- Market Attractiveness Analysis
- By Country
- By Product Type
- By Capacity
- By End-Use
- Key Takeaways
- MEA Market Analysis 2020 to 2024 and Forecast 2020 to 2035, By Country
- Historical Market Size Value (USD Bn) & Volume (Units) Trend Analysis By Market Taxonomy, 2020 to 2024
- Market Size Value (USD Bn) & Volume (Units) Forecast By Market Taxonomy, 2020 to 2035
- By Country
- GCC
- Rest of MEA
- By Product Type
- By Capacity
- By End-Use
- By Country
- Market Attractiveness Analysis
- By Country
- By Product Type
- By Capacity
- By End-Use
- Key Takeaways
- Key Countries Market Analysis
- Value (USD Bn) & Volume (Units)ed States
- Pricing Analysis
- Market Share Analysis, 2024
- By Product Type
- By Capacity
- By End-Use
- China
- Pricing Analysis
- Market Share Analysis, 2024
- By Product Type
- By Capacity
- By End-Use
- Germany
- Pricing Analysis
- Market Share Analysis, 2024
- By Product Type
- By Capacity
- By End-Use
- India
- Pricing Analysis
- Market Share Analysis, 2024
- By Product Type
- By Capacity
- By End-Use
- Japan
- Pricing Analysis
- Market Share Analysis, 2024
- By Product Type
- By Capacity
- By End-Use
- Value (USD Bn) & Volume (Units)ed States
- Market Structure Analysis
- Competition Dashboard
- Competition Benchmarking
- Market Share Analysis of Top Players
- By Regional
- By Product Type
- By Capacity
- By End-Use
- Competition Analysis
- Competition Deep Dive
- Liebherr International AG
- Overview
- Product Portfolio
- Profitability by Market Segments (Product/Age /Sales Channel/Region)
- Sales Footprint
- Strategy Overview
- Marketing Strategy
- Product Strategy
- Channel Strategy
- Terex Corporation
- Overview
- Product Portfolio
- Profitability by Market Segments (Product/Age /Sales Channel/Region)
- Sales Footprint
- Strategy Overview
- Marketing Strategy
- Product Strategy
- Channel Strategy
- Manitowoc Co. Inc.
- Overview
- Product Portfolio
- Profitability by Market Segments (Product/Age /Sales Channel/Region)
- Sales Footprint
- Strategy Overview
- Marketing Strategy
- Product Strategy
- Channel Strategy
- Tadano Ltd.
- Overview
- Product Portfolio
- Profitability by Market Segments (Product/Age /Sales Channel/Region)
- Sales Footprint
- Strategy Overview
- Marketing Strategy
- Product Strategy
- Channel Strategy
- Kobelco Construction Machinery
- Overview
- Product Portfolio
- Profitability by Market Segments (Product/Age /Sales Channel/Region)
- Sales Footprint
- Strategy Overview
- Marketing Strategy
- Product Strategy
- Channel Strategy
- Palfinger AG
- Overview
- Product Portfolio
- Profitability by Market Segments (Product/Age /Sales Channel/Region)
- Sales Footprint
- Strategy Overview
- Marketing Strategy
- Product Strategy
- Channel Strategy
- Sumitomo Heavy Industries
- Overview
- Product Portfolio
- Profitability by Market Segments (Product/Age /Sales Channel/Region)
- Sales Footprint
- Strategy Overview
- Marketing Strategy
- Product Strategy
- Channel Strategy
- Zoomlion Heavy Industries
- Overview
- Product Portfolio
- Profitability by Market Segments (Product/Age /Sales Channel/Region)
- Sales Footprint
- Strategy Overview
- Marketing Strategy
- Product Strategy
- Channel Strategy
- XCMG Co. Ltd
- Overview
- Product Portfolio
- Profitability by Market Segments (Product/Age /Sales Channel/Region)
- Sales Footprint
- Strategy Overview
- Marketing Strategy
- Product Strategy
- Channel Strategy
- Sany Heavy Industries Co. Ltd.
- Overview
- Product Portfolio
- Profitability by Market Segments (Product/Age /Sales Channel/Region)
- Sales Footprint
- Strategy Overview
- Marketing Strategy
- Product Strategy
- Channel Strategy
- Konecranes
- Overview
- Product Portfolio
- Profitability by Market Segments (Product/Age /Sales Channel/Region)
- Sales Footprint
- Strategy Overview
- Marketing Strategy
- Product Strategy
- Channel Strategy
- Manitex International Inc.
- Overview
- Product Portfolio
- Profitability by Market Segments (Product/Age /Sales Channel/Region)
- Sales Footprint
- Strategy Overview
- Marketing Strategy
- Product Strategy
- Channel Strategy
- Link-Belt Cranes L.P.
- Overview
- Product Portfolio
- Profitability by Market Segments (Product/Age /Sales Channel/Region)
- Sales Footprint
- Strategy Overview
- Marketing Strategy
- Product Strategy
- Channel Strategy
- Elliot Equipment Company
- Overview
- Product Portfolio
- Profitability by Market Segments (Product/Age /Sales Channel/Region)
- Sales Footprint
- Strategy Overview
- Marketing Strategy
- Product Strategy
- Channel Strategy
- Liebherr International AG
- Competition Deep Dive
- Assumptions & Acronyms Used
- Research Methodology
List Of Table
- Table 1: Global Market Value (USD Bn) Forecast by Region, 2020 to 2035
- Table 2: Global Market Volume (Units) Forecast by Region, 2020 to 2035
- Table 3: Global Market Value (USD Bn) Forecast by Product Type, 2020 to 2035
- Table 4: Global Market Volume (Units) Forecast by Product Type, 2020 to 2035
- Table 5: Global Market Value (USD Bn) Forecast by Capacity, 2020 to 2035
- Table 6: Global Market Volume (Units) Forecast by Capacity, 2020 to 2035
- Table 7: Global Market Value (USD Bn) Forecast by End-Use, 2020 to 2035
- Table 8: Global Market Volume (Units) Forecast by End-Use, 2020 to 2035
- Table 9: North America Market Value (USD Bn) Forecast by Country, 2020 to 2035
- Table 10: North America Market Volume (Units) Forecast by Country, 2020 to 2035
- Table 11: North America Market Value (USD Bn) Forecast by Product Type, 2020 to 2035
- Table 12: North America Market Volume (Units) Forecast by Product Type, 2020 to 2035
- Table 13: North America Market Value (USD Bn) Forecast by Capacity, 2020 to 2035
- Table 14: North America Market Volume (Units) Forecast by Capacity, 2020 to 2035
- Table 15: North America Market Value (USD Bn) Forecast by End-Use, 2020 to 2035
- Table 16: North America Market Volume (Units) Forecast by End-Use, 2020 to 2035
- Table 17: Latin America Market Value (USD Bn) Forecast by Country, 2020 to 2035
- Table 18: Latin America Market Volume (Units) Forecast by Country, 2020 to 2035
- Table 19: Latin America Market Value (USD Bn) Forecast by Product Type, 2020 to 2035
- Table 20: Latin America Market Volume (Units) Forecast by Product Type, 2020 to 2035
- Table 21: Latin America Market Value (USD Bn) Forecast by Capacity, 2020 to 2035
- Table 22: Latin America Market Volume (Units) Forecast by Capacity, 2020 to 2035
- Table 23: Latin America Market Value (USD Bn) Forecast by End-Use, 2020 to 2035
- Table 24: Latin America Market Volume (Units) Forecast by End-Use, 2020 to 2035
- Table 25: Europe Market Value (USD Bn) Forecast by Country, 2020 to 2035
- Table 26: Europe Market Volume (Units) Forecast by Country, 2020 to 2035
- Table 27: Europe Market Value (USD Bn) Forecast by Product Type, 2020 to 2035
- Table 28: Europe Market Volume (Units) Forecast by Product Type, 2020 to 2035
- Table 29: Europe Market Value (USD Bn) Forecast by Capacity, 2020 to 2035
- Table 30: Europe Market Volume (Units) Forecast by Capacity, 2020 to 2035
- Table 31: Europe Market Value (USD Bn) Forecast by End-Use, 2020 to 2035
- Table 32: Europe Market Volume (Units) Forecast by End-Use, 2020 to 2035
- Table 33: East Asia Market Value (USD Bn) Forecast by Country, 2020 to 2035
- Table 34: East Asia Market Volume (Units) Forecast by Country, 2020 to 2035
- Table 35: East Asia Market Value (USD Bn) Forecast by Product Type, 2020 to 2035
- Table 36: East Asia Market Volume (Units) Forecast by Product Type, 2020 to 2035
- Table 37: East Asia Market Value (USD Bn) Forecast by Capacity, 2020 to 2035
- Table 38: East Asia Market Volume (Units) Forecast by Capacity, 2020 to 2035
- Table 39: East Asia Market Value (USD Bn) Forecast by End-Use, 2020 to 2035
- Table 40: East Asia Market Volume (Units) Forecast by End-Use, 2020 to 2035
- Table 41: South Asia Market Value (USD Bn) Forecast by Country, 2020 to 2035
- Table 42: South Asia Market Volume (Units) Forecast by Country, 2020 to 2035
- Table 43: South Asia Market Value (USD Bn) Forecast by Product Type, 2020 to 2035
- Table 44: South Asia Market Volume (Units) Forecast by Product Type, 2020 to 2035
- Table 45: South Asia Market Value (USD Bn) Forecast by Capacity, 2020 to 2035
- Table 46: South Asia Market Volume (Units) Forecast by Capacity, 2020 to 2035
- Table 47: South Asia Market Value (USD Bn) Forecast by End-Use, 2020 to 2035
- Table 48: South Asia Market Volume (Units) Forecast by End-Use, 2020 to 2035
- Table 49: Oceania Market Value (USD Bn) Forecast by Country, 2020 to 2035
- Table 50: Oceania Market Volume (Units) Forecast by Country, 2020 to 2035
- Table 51: Oceania Market Value (USD Bn) Forecast by Product Type, 2020 to 2035
- Table 52: Oceania Market Volume (Units) Forecast by Product Type, 2020 to 2035
- Table 53: Oceania Market Value (USD Bn) Forecast by Capacity, 2020 to 2035
- Table 54: Oceania Market Volume (Units) Forecast by Capacity, 2020 to 2035
- Table 55: Oceania Market Value (USD Bn) Forecast by End-Use, 2020 to 2035
- Table 56: Oceania Market Volume (Units) Forecast by End-Use, 2020 to 2035
- Table 57: MEA Market Value (USD Bn) Forecast by Country, 2020 to 2035
- Table 58: MEA Market Volume (Units) Forecast by Country, 2020 to 2035
- Table 59: MEA Market Value (USD Bn) Forecast by Product Type, 2020 to 2035
- Table 60: MEA Market Volume (Units) Forecast by Product Type, 2020 to 2035
- Table 61: MEA Market Value (USD Bn) Forecast by Capacity, 2020 to 2035
- Table 62: MEA Market Volume (Units) Forecast by Capacity, 2020 to 2035
- Table 63: MEA Market Value (USD Bn) Forecast by End-Use, 2020 to 2035
- Table 64: MEA Market Volume (Units) Forecast by End-Use, 2020 to 2035
List Of Figures
- Figure 1: Global Market Volume (Units) Forecast 2020 to 2035
- Figure 2: Global Market Pricing Analysis
- Figure 3: Global Market Value (USD Bn) Forecast 2020 to 2035
- Figure 4: Global Market Value Share and BPS Analysis by Product Type, 2025 to 2035
- Figure 5: Global Market Y-o-Y Growth Comparison by Product Type, 2025 to 2035
- Figure 6: Global Market Attractiveness Analysis by Product Type
- Figure 7: Global Market Value Share and BPS Analysis by Capacity, 2025 to 2035
- Figure 8: Global Market Y-o-Y Growth Comparison by Capacity, 2025 to 2035
- Figure 9: Global Market Attractiveness Analysis by Capacity
- Figure 10: Global Market Value Share and BPS Analysis by End-Use, 2025 to 2035
- Figure 11: Global Market Y-o-Y Growth Comparison by End-Use, 2025 to 2035
- Figure 12: Global Market Attractiveness Analysis by End-Use
- Figure 13: Global Market Value (USD Bn) Share and BPS Analysis by Region, 2025 to 2035
- Figure 14: Global Market Y-o-Y Growth Comparison by Region, 2025 to 2035
- Figure 15: Global Market Attractiveness Analysis by Region
- Figure 16: North America Market Incremental $ Opportunity, 2025 to 2035
- Figure 17: Latin America Market Incremental $ Opportunity, 2025 to 2035
- Figure 18: Europe Market Incremental $ Opportunity, 2025 to 2035
- Figure 19: East Asia Market Incremental $ Opportunity, 2025 to 2035
- Figure 20: South Asia Market Incremental $ Opportunity, 2025 to 2035
- Figure 21: Oceania Market Incremental $ Opportunity, 2025 to 2035
- Figure 22: MEA Market Incremental $ Opportunity, 2025 to 2035
- Figure 23: North America Market Value Share and BPS Analysis by Country, 2025 to 2035
- Figure 24: North America Market Value Share and BPS Analysis by Product Type, 2025 to 2035
- Figure 25: North America Market Y-o-Y Growth Comparison by Product Type, 2025 to 2035
- Figure 26: North America Market Attractiveness Analysis by Product Type
- Figure 27: North America Market Value Share and BPS Analysis by Capacity, 2025 to 2035
- Figure 28: North America Market Y-o-Y Growth Comparison by Capacity, 2025 to 2035
- Figure 29: North America Market Attractiveness Analysis by Capacity
- Figure 30: North America Market Value Share and BPS Analysis by End-Use, 2025 to 2035
- Figure 31: North America Market Y-o-Y Growth Comparison by End-Use, 2025 to 2035
- Figure 32: North America Market Attractiveness Analysis by End-Use
- Figure 33: Latin America Market Value Share and BPS Analysis by Country, 2025 to 2035
- Figure 34: Latin America Market Value Share and BPS Analysis by Product Type, 2025 to 2035
- Figure 35: Latin America Market Y-o-Y Growth Comparison by Product Type, 2025 to 2035
- Figure 36: Latin America Market Attractiveness Analysis by Product Type
- Figure 37: Latin America Market Value Share and BPS Analysis by Capacity, 2025 to 2035
- Figure 38: Latin America Market Y-o-Y Growth Comparison by Capacity, 2025 to 2035
- Figure 39: Latin America Market Attractiveness Analysis by Capacity
- Figure 40: Latin America Market Value Share and BPS Analysis by End-Use, 2025 to 2035
- Figure 41: Latin America Market Y-o-Y Growth Comparison by End-Use, 2025 to 2035
- Figure 42: Latin America Market Attractiveness Analysis by End-Use
- Figure 43: Europe Market Value Share and BPS Analysis by Country, 2025 to 2035
- Figure 44: Europe Market Value Share and BPS Analysis by Product Type, 2025 to 2035
- Figure 45: Europe Market Y-o-Y Growth Comparison by Product Type, 2025 to 2035
- Figure 46: Europe Market Attractiveness Analysis by Product Type
- Figure 47: Europe Market Value Share and BPS Analysis by Capacity, 2025 to 2035
- Figure 48: Europe Market Y-o-Y Growth Comparison by Capacity, 2025 to 2035
- Figure 49: Europe Market Attractiveness Analysis by Capacity
- Figure 50: Europe Market Value Share and BPS Analysis by End-Use, 2025 to 2035
- Figure 51: Europe Market Y-o-Y Growth Comparison by End-Use, 2025 to 2035
- Figure 52: Europe Market Attractiveness Analysis by End-Use
- Figure 53: East Asia Market Value Share and BPS Analysis by Country, 2025 to 2035
- Figure 54: East Asia Market Value Share and BPS Analysis by Product Type, 2025 to 2035
- Figure 55: East Asia Market Y-o-Y Growth Comparison by Product Type, 2025 to 2035
- Figure 56: East Asia Market Attractiveness Analysis by Product Type
- Figure 57: East Asia Market Value Share and BPS Analysis by Capacity, 2025 to 2035
- Figure 58: East Asia Market Y-o-Y Growth Comparison by Capacity, 2025 to 2035
- Figure 59: East Asia Market Attractiveness Analysis by Capacity
- Figure 60: East Asia Market Value Share and BPS Analysis by End-Use, 2025 to 2035
- Figure 61: East Asia Market Y-o-Y Growth Comparison by End-Use, 2025 to 2035
- Figure 62: East Asia Market Attractiveness Analysis by End-Use
- Figure 63: South Asia Market Value Share and BPS Analysis by Country, 2025 to 2035
- Figure 64: South Asia Market Value Share and BPS Analysis by Product Type, 2025 to 2035
- Figure 65: South Asia Market Y-o-Y Growth Comparison by Product Type, 2025 to 2035
- Figure 66: South Asia Market Attractiveness Analysis by Product Type
- Figure 67: South Asia Market Value Share and BPS Analysis by Capacity, 2025 to 2035
- Figure 68: South Asia Market Y-o-Y Growth Comparison by Capacity, 2025 to 2035
- Figure 69: South Asia Market Attractiveness Analysis by Capacity
- Figure 70: South Asia Market Value Share and BPS Analysis by End-Use, 2025 to 2035
- Figure 71: South Asia Market Y-o-Y Growth Comparison by End-Use, 2025 to 2035
- Figure 72: South Asia Market Attractiveness Analysis by End-Use
- Figure 73: Oceania Market Value Share and BPS Analysis by Country, 2025 to 2035
- Figure 74: Oceania Market Value Share and BPS Analysis by Product Type, 2025 to 2035
- Figure 75: Oceania Market Y-o-Y Growth Comparison by Product Type, 2025 to 2035
- Figure 76: Oceania Market Attractiveness Analysis by Product Type
- Figure 77: Oceania Market Value Share and BPS Analysis by Capacity, 2025 to 2035
- Figure 78: Oceania Market Y-o-Y Growth Comparison by Capacity, 2025 to 2035
- Figure 79: Oceania Market Attractiveness Analysis by Capacity
- Figure 80: Oceania Market Value Share and BPS Analysis by End-Use, 2025 to 2035
- Figure 81: Oceania Market Y-o-Y Growth Comparison by End-Use, 2025 to 2035
- Figure 82: Oceania Market Attractiveness Analysis by End-Use
- Figure 83: MEA Market Value Share and BPS Analysis by Country, 2025 to 2035
- Figure 84: MEA Market Value Share and BPS Analysis by Product Type, 2025 to 2035
- Figure 85: MEA Market Y-o-Y Growth Comparison by Product Type, 2025 to 2035
- Figure 86: MEA Market Attractiveness Analysis by Product Type
- Figure 87: MEA Market Value Share and BPS Analysis by Capacity, 2025 to 2035
- Figure 88: MEA Market Y-o-Y Growth Comparison by Capacity, 2025 to 2035
- Figure 89: MEA Market Attractiveness Analysis by Capacity
- Figure 90: MEA Market Value Share and BPS Analysis by End-Use, 2025 to 2035
- Figure 91: MEA Market Y-o-Y Growth Comparison by End-Use, 2025 to 2035
- Figure 92: MEA Market Attractiveness Analysis by End-Use
- Figure 93: Global Market - Tier Structure Analysis
- Figure 94: Global Market - Company Share Analysis
- FAQs -
What is the Global Mobile Construction Cranes Market Size in 2025?
The mobile construction cranes market is valued at USD 11.6 billion in 2025.
Who are the Major Players Operating in the Mobile Construction Cranes Market?
Prominent players in the mobile construction cranes market include Liebherr International AG, Terex Corporation, Manitowoc Co. Inc., Tadano Ltd., and others.
What is the Estimated Valuation of the Mobile Construction Cranes Market by 2035?
The mobile construction cranes market is expected to reach a valuation of USD 17.2 billion by 2035.
What Value CAGR Did the Mobile Construction Cranes Market Exhibit over the Last Five Years?
The historic growth rate of the mobile construction cranes market was 2.7% from 2020-2024.