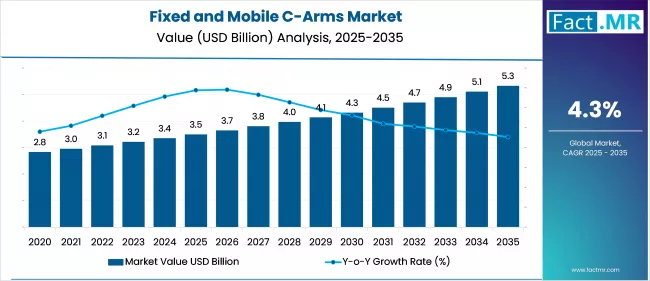
Fixed And Mobile C-Arms Market

Fixed And Mobile C-Arms Market Analysis, By Technology, By Model Type, By Application, By End-User, and Region - Market Insights 2025 to 2035

Analysis of Fixed And Mobile C-Arms Market Covering 30+ Countries Including Analysis of US, Canada, UK, Germany, France, Nordics, GCC countries, Japan, Korea and many more.

Fixed And Mobile C-Arms Market Outlook (2025 to 2035)

The global fixed and mobile C-arms market is projected to increase from USD 3.5 billion in 2025 to USD 5.3 billion by 2035, with a CAGR of 4.3%, driven by the prevalence of chronic diseases, advancements in healthcare infrastructure, and the increasing demand for minimally invasive procedures. Their use in providing real-time, high-resolution imaging makes them ideal for guiding complex surgical and diagnostic procedures with enhanced precision and minimal invasiveness.

Fixed And Mobile C Arms Market

What are the Drivers of the Fixed and Mobile C-Arms Market?

The shift toward minimally invasive surgery is a key driver of growth in the fixed and mobile C-arms market. Minimally invasive procedures offer several benefits over traditional surgery, including shorter hospital stays, faster recovery times, and reduced postoperative pain. Their adoption has experienced a significant increase over the past decade, largely due to these advantages.

C-arms enable surgeons to execute intricate procedures with precision by delivering real-time, high-resolution fluoroscopic images. The demand for advanced imaging equipment is expected to increase as healthcare systems worldwide continue to prioritize cost efficiency and improved patient outcomes, thereby driving fixed and mobile C-arms market growth.

The rapid technological advancements in imaging technology are another significant factor that is propelling the market. Manufacturers are making substantial investments in the development of advanced C-arms that offer improved image quality and reduced radiation exposure.

The capabilities of C-arm systems have been significantly enhanced by the integration of digital imaging systems with advanced features, including flat-panel detectors and 3D imaging. These developments not only enhance diagnostic accuracy but also enable a broader range of applications, thereby expanding the use of C-arms in various medical disciplines, including neurology, orthopedics, and cardiology.

The fixed and mobile C-arms market is being further stimulated by the rising incidence of chronic diseases, including cardiovascular disorders, cancer, and orthopedic conditions. Worldwide, chronic diseases are the primary causes of mortality and morbidity, necessitating frequent diagnostic imaging to monitor the efficacy of treatment and the progression of the disease.

The demand for C-arms is expected to increase in tandem with the growing disease burden, as they are essential for diagnosing and planning treatment for these conditions. Furthermore, the market is expected to experience substantial growth during the forecast period, driven by the ongoing expansion of healthcare services in emerging economies, fueled by government investments and rising healthcare expenditures.

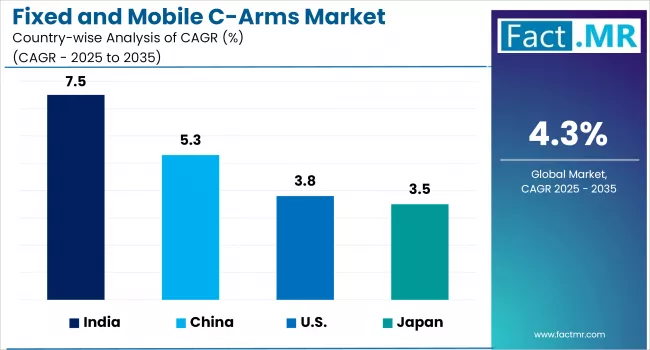
What are the Regional Trends of the Fixed and Mobile C-Arms Market?

The North American market held the largest share globally, primarily due to technological advancements such as improved imaging quality, enhanced mobility, and the integration of features like 3D mapping and AI. These innovations, coupled with a growing geriatric population that is more susceptible to chronic diseases and in need of surgical interventions, have significantly boosted demand in the region.

The U.S. leads the North American market, driven by the presence of major manufacturers, the widespread adoption of advanced imaging solutions, and a high volume of surgical procedures that require precise imaging. In Europe, the market remains strong, bolstered by key players introducing new products and technologies, as seen with Fujifilm Europe’s launch of its hybrid C-arm and portable X-ray.

The U.K., France, and Germany are experiencing notable growth due to rising chronic disease prevalence, robust healthcare infrastructure, and ongoing technological improvements. Meanwhile, the Asia Pacific region is expected to witness the fastest growth through the forecast period, fueled by expanding healthcare markets in countries such as China, Japan, and India, increasing chronic disease burdens, and greater awareness and access to advanced medical devices.

Latin America and the Middle East & Africa are also seeing growth, driven by improved healthcare infrastructure, government initiatives, and rising demand for advanced diagnostic and treatment technologies. Overall, the global market for fixed and mobile C-arms is poised for significant expansion, driven by continuous technological advancements, demographic shifts, and increased investment in healthcare infrastructure across all regions.

What are the Challenges And Restraining Factors of the Fixed And Mobile c-Arms Market?

The fixed and mobile C-arms market faces several challenges and restraining factors that can hinder its growth. High system costs remain a significant barrier, especially for smaller healthcare facilities and those in emerging markets, as the initial investment and ongoing maintenance expenses can be substantial. Stringent regulatory requirements and lengthy approval processes also slow down product launches and increase compliance costs, particularly in regions with strict healthcare regulations.

Additionally, competition from alternative imaging modalities such as MRI and ultrasound can limit the adoption of C-arms for certain procedures. The market is further restrained by the need for skilled professionals to operate these advanced imaging systems, with a shortage of trained personnel particularly evident in less developed healthcare settings.

Complex installation requirements, especially for fixed C-arm systems, often necessitate infrastructure modifications that may not be feasible for all hospitals or clinics. Concerns about radiation exposure for both patients and medical staff, despite advancements in dose reduction technologies, continue to be a deterrent.

Moreover, inconsistent or inadequate reimbursement policies for procedures involving C-arms can affect the financial viability of healthcare providers, particularly in countries with less developed insurance systems. Collectively, these factors limit the accessibility and widespread adoption of fixed and mobile C-arm systems, despite the ongoing advancements in technology and growing demand for advanced imaging solutions.

Country-Wise Outlook

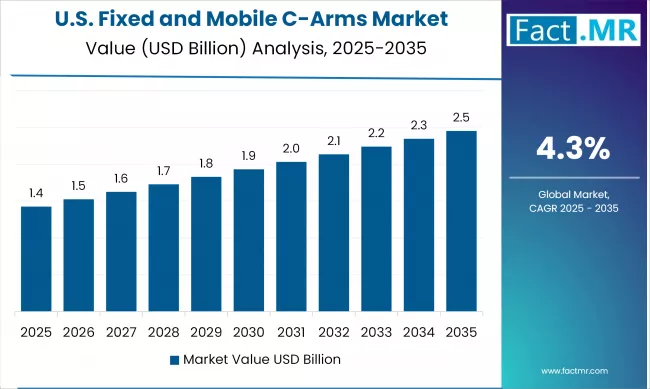
U.S. Fixed and Mobile C-Arms Market Sees Growth Driven by Growth in Minimally Invasive and Outpatient Procedures

Fixed And Mobile C Arms Market Cagr Analysis By Country

The U.S. fixed and mobile C-arms market is experiencing growth primarily driven by several key factors. The increasing prevalence of chronic diseases such as cardiovascular disorders, orthopedic conditions, and cancer is fueling demand for minimally invasive surgical procedures, where C-arms are essential for real-time intraoperative imaging.

Technological advancements, including the integration of 3D imaging, flat-panel detectors, and digital radiography, are enhancing diagnostic accuracy and operational efficiency, further supporting market expansion. The expanding geriatric population, which is more susceptible to age-related conditions requiring surgical interventions, is also a significant growth driver.

Additionally, the shift toward outpatient and ambulatory surgery centers has increased demand for mobile C-arms, as these facilities require compact and efficient imaging solutions. The presence of a well-established healthcare infrastructure, ongoing investments in healthcare innovation, and favorable reimbursement policies further contribute to the robust growth of the U.S. C-arms market.

United States Fixed And Mobile C Arms Market Value Analysis

The ongoing consolidation and expansion in medical imaging and interventional device sectors suggest active market dynamics that could include C-arm technologies as a part of larger deals or strategic acquisitions.

RadNet Inc., a major outpatient imaging center operator, is actively expanding its footprint through acquisitions and new center constructions across multiple states, aiming to increase capacity amid rising imaging demand and workforce shortages. While RadNet primarily focuses on imaging centers, its growth strategy may include acquiring facilities equipped with advanced imaging modalities such as C-arms.

China Witnesses Rapid Market Growth Backed by Domestic Manufacturing Strength

China is witnessing rapid market growth in 2025, supported by strong government support for innovation, technology, and sustainability. Key sectors driving this expansion include chiplet technology, optical chips, and quantum computing, each benefitting from increased R&D investment and policy backing.

Online shopping continues robust growth, with the industry expected to drive by increased internet penetration and mobile usage. Artificial intelligence, machine learning, and aerospace technology are also highlighted as transformative sectors, leveraging digital adoption and government investment to reshape manufacturing, healthcare, and national defense.

Additionally, lower-tier cities present vast untapped consumption potential, and the leisure economy is booming as consumer demand shifts toward emotionally fulfilling activities and experiences. Despite a projected overall GDP growth rate of around 4-4.8% for 2025, these emerging industries and consumption trends are providing strong momentum for China’s ongoing market expansion.

Japan is Experiencing Rapid Market Growth for Digital Transformation and Saas

Japan is witnessing rapid growth in the digital transformation and SaaS market, driven by government-led digitalization initiatives, labor shortages caused by an aging population, and rising demand for automation and operational efficiency. The government’s Digital Agency and initiatives like Society 5.0 are accelerating adoption, especially among SMEs, where SaaS penetration remains low but is rising quickly.

The adoption of AI in retail is also accelerating, with strong growth expected as companies seek to enhance operational efficiency and customer experience through AI-powered solutions. The fixed and mobile C-arms market in Japan is experiencing significant growth, fueled by increasing initiatives in the healthcare sector.

For instance, in July 2024, FUJIFILM Holdings Corporation announced plans to issue a USD 1.36 billion social bond, the largest of its kind in Japan’s corporate bond market. The proceeds from this bond will be used to expand FUJIFILM’s biopharmaceutical contract development and manufacturing (Bio CDMO) business, aiming to address unmet medical needs and improve global access to essential medicines.

Category-wise Analysis

Fixed C-Arms to Exhibit Leading by Model Type

Fixed And Mobile C Arms Market Analysis By Model Type

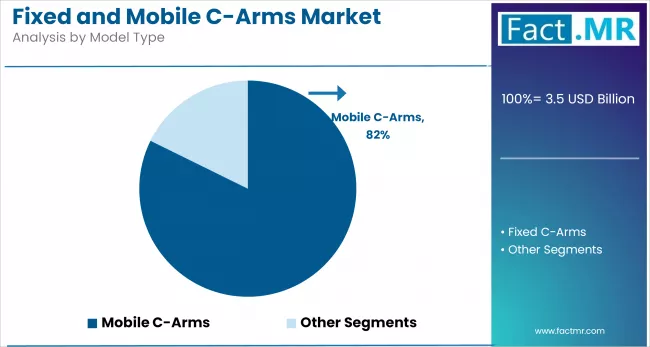
The fixed C-arms segment led the market, primarily due to its extensive use in large hospitals and surgical centers for complex procedures requiring consistent, high-resolution imaging. Fixed C-arms provide real-time, detailed visuals that are critical in specialties such as neurology, cardiology, and orthopedics, where precision is essential. The segment's dominance is also supported by ongoing technological advancements, including the integration of artificial intelligence and 3D imaging capabilities, which enhance diagnostic accuracy and procedural outcomes.

The mobile C-arms segment is expected to witness the fastest CAGR during the forecast period, driven by their versatility and ease of use. Their ability to be maneuvered around the patient for optimal imaging angles makes them especially valuable in dynamic, time-sensitive clinical settings. This flexibility not only improves patient comfort but also supports better imaging results. The adoption of motorized axes further accelerates this segment's growth by improving positioning accuracy, minimizing manual adjustments, and enhancing workflow efficiency during medical procedures.

Orthopedics and Trauma to Exhibit Leading by Application

Fixed And Mobile C Arms Market Analysis By Application

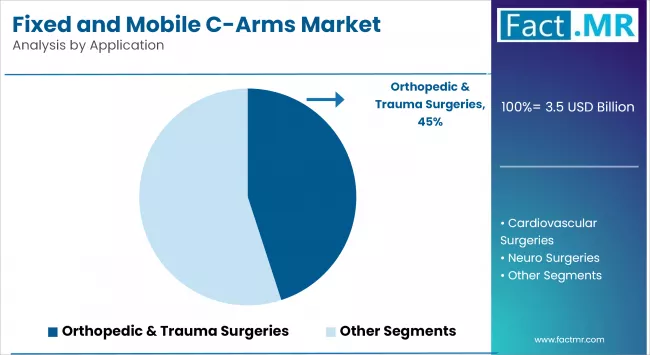
The orthopedics and trauma segment accounted for the largest revenue share in the fixed and mobile C-arms market. This dominance is attributed to the extensive use of C-arm systems in procedures like spinal surgeries, joint replacements, and fracture repairs. Real-time, high-quality imaging is crucial for accurate positioning during such procedures. The growing incidence of musculoskeletal disorders, trauma injuries, and an aging population further fuels the demand for advanced imaging in orthopedic care.

The cardiovascular segment is expected to grow at the fastest rate during the forecast period. Rising cases of heart-related conditions, such as coronary artery disease, arrhythmias, and heart failure, are driving the need for precise imaging during diagnostic and interventional procedures like angioplasty and stenting. The demand for minimally invasive treatments is accelerating the adoption of C-arms, which provide real-time, high-resolution imaging and improve clinical outcomes while minimizing patient risk.

Image Intensifiers to Exhibit Leading by Technology

The image intensifiers segment currently dominates the fixed and mobile C-arms market due to its widespread adoption, affordability, and established presence in healthcare settings. These systems are reliable and cost-effective, making them a preferred choice for routine imaging applications in hospitals and diagnostic centers. Their ability to provide real-time imaging during surgeries and procedures has made them a staple, particularly in regions with budget constraints or limited infrastructure.

The flat panel technology segment is projected to be the fastest-growing during the forecast period. The increasing demand for advanced imaging quality, compact design, and better spatial resolution fuels this growth. Flat panel detectors also offer reduced radiation exposure and improved digital integration, making them suitable for complex procedures in modern medical facilities. The rising preference for minimally invasive surgeries is further accelerating the adoption of flat panel-based C-arms.

Hospitals to Exhibit Leading by End-User

Hospitals hold the largest share in the fixed and mobile C-arms market due to their high patient volumes, availability of advanced infrastructure, and growing demand for intraoperative imaging. The integration of C-arms in surgical suites allows hospitals to enhance workflow efficiency and procedural accuracy, particularly in orthopedic, cardiovascular, and urology departments. Their capacity to invest in both fixed and mobile systems further reinforces hospitals' dominance.

Specialty clinics are expected to witness the fastest growth, driven by the surge in outpatient procedures and demand for cost-effective, portable diagnostic solutions. Clinics specializing in orthopedics, pain management, and cardiology are increasingly adopting mobile C-arms to support minimally invasive procedures. The shift toward decentralized care and the expansion of specialty practices in emerging markets are also contributing to this rapid growth.

Competitive Analysis

The fixed and mobile C-arms market is becoming moderately competitive, with a combination of established medical imaging companies and emerging players competing on innovation, image quality, and system mobility. Key participants are expanding their product portfolios and investing in R&D to introduce advanced C-arm systems with reduced radiation exposure, enhanced mobility, and high-resolution imaging.

Companies are also leveraging strong distribution networks, particularly across North America, Europe, and Asia-Pacific, to strengthen market presence. Leading players maintain their edge through technological advancements, trusted brand reputation, and clinical expertise.

Additionally, market participants engage in partnerships, collaborations, and acquisitions to expand their market presence, access new markets, and meet the growing demand for advanced diagnostic and surgical solutions. These efforts are driving the overall growth of the fixed and mobile C-arms market.

Key players in the fixed and mobile C-arms industry include GE HealthCare, Koninklijke Philips N.V., Siemens Healthineers AG, Medtronic, Shimadzu Corporation, Hologic, Inc., Canon Medical Systems Corporation, Fujifilm Holdings Corporation, Ziehm Imaging GmbH, and other notable companies.

Recent Development

  • In September 2024, Siemens Healthineers launched the Ciartic Move, a fully motorized mobile C-arm with self-driving features, first installed in the U.S. It offers high-quality imaging with low radiation and improves workflow by automating positioning. Alongside, Siemens provides a range of mobile C-arms designed for versatile clinical use, combining excellent image quality, dose efficiency, and ease of operation.
  • In February 2024, Philips launched the Philips Image Guided Therapy Mobile C-arm System 9000 - Zenition 90 Motorized. This advanced system is designed to help surgeons deliver high-quality care to more patients by enhancing imaging capabilities and workflow efficiency in surgical settings.

Segmentation of Fixed and Mobile C-Arms Market

  • By Technology :

    • Image Intensifiers
    • Flat Panel
  • By Application :

    • Orthopedic and Trauma surgeries
    • Cardiovascular surgeries
    • Neuro surgeries
    • Gastrointestinal surgeries
    • Urology
    • Pain Management
    • General Surgery
    • Others
  • By Model Type :

    • Floor Mounted Fixed and Mobile C-Arms
    • Ceiling Mounted Fixed and Mobile C-Arms
  • By End-User :

    • Hospitals
    • Diagnostic
    • Specialty Clinics
    • Others
  • By Region :

    • North America
    • Latin America
    • Western Europe
    • Eastern Europe
    • East Asia
    • South Asia & Pacific
    • Middle East & Africa

Table of Content

  1. Executive Summary
    • Global Market Outlook
    • Demand-side Trends
    • Supply-side Trends
    • Technology Roadmap Analysis
    • Analysis and Recommendations
  2. Market Overview
    • Market Coverage / Taxonomy
    • Market Definition / Scope / Limitations
  3. Market Background
    • Market Dynamics
      • Drivers
      • Restraints
      • Opportunity
      • Trends
    • Scenario Forecast
      • Demand in Optimistic Scenario
      • Demand in Likely Scenario
      • Demand in Conservative Scenario
    • Opportunity Map Analysis
    • Product Life Cycle Analysis
    • Supply Chain Analysis
      • Supply Side Participants and their Roles
        • Producers
        • Mid-Level Participants (Traders/ Agents/ Brokers)
        • Wholesalers and Distributors
      • Value Added and Value Created at Node in the Supply Chain
      • List of Component Suppliers
      • List of Existing and Potential Buyers
    • Investment Feasibility Matrix
    • Value Chain Analysis
      • Profit Margin Analysis
      • Wholesalers and Distributors
      • Retailers
    • PESTLE and Porter’s Analysis
    • Regulatory Landscape
      • By Key Regions
      • By Key Countries
    • Production and Consumption Statistics
    • Import and Export Statistics
  4. Global Market Analysis 2020 to 2024 and Forecast, 2025 to 2035
    • Historical Market Size Value (USD Bn) & Volume (Units) Analysis, 2020 to 2024
    • Current and Future Market Size Value (USD Bn) & Volume (Units) Projections, 2025 to 2035
      • Y-o-Y Growth Trend Analysis
      • Absolute $ Opportunity Analysis
  5. Global Market Pricing Analysis 2020 to 2024 and Forecast 2025 to 2035
  6. Global Market Analysis 2020 to 2024 and Forecast 2025 to 2035, By Technology
    • Introduction / Key Findings
    • Historical Market Size Value (USD Bn) & Volume (Units) Analysis By Technology, 2020 to 2024
    • Current and Future Market Size Value (USD Bn) & Volume (Units) Analysis and Forecast By Technology, 2025 to 2035
      • Image Intensifiers
      • Flat Panel
    • Y-o-Y Growth Trend Analysis By Technology, 2020 to 2024
    • Absolute $ Opportunity Analysis By Technology, 2025 to 2035
  7. Global Global Market Analysis 2020 to 2024 and Forecast 2025 to 2035, By Application
    • Introduction / Key Findings
    • Historical Market Size Value (USD Bn) & Volume (Units) Analysis By Application, 2020 to 2024
    • Current and Future Market Size Value (USD Bn) & Volume (Units) Analysis and Forecast By Application, 2025 to 2035
      • Orthopedic and Trauma Surgeries
      • Cardiovascular Surgeries
      • Neuro Surgeries
      • Gastrointestinal Surgeries
      • Urology
      • Pain Management
      • General Surgery
      • Others
    • Y-o-Y Growth Trend Analysis By Application, 2020 to 2024
    • Absolute $ Opportunity Analysis By Application, 2025 to 2035
  8. Global Market Analysis 2020 to 2024 and Forecast 2025 to 2035, By Model Type
    • Introduction / Key Findings
    • Historical Market Size Value (USD Bn) & Volume (Units) Analysis By Model Type, 2020 to 2024
    • Current and Future Market Size Value (USD Bn) & Volume (Units) Analysis and Forecast By Model Type, 2025 to 2035
      • Floor Mounted Fixed and Mobile C-Arms
      • Ceiling Mounted Fixed and Mobile C-Arms
    • Y-o-Y Growth Trend Analysis By Model Type, 2020 to 2024
    • Absolute $ Opportunity Analysis By Model Type, 2025 to 2035
  9. Global Market Analysis 2020 to 2024 and Forecast 2025 to 2035, By End-User
    • Introduction / Key Findings
    • Historical Market Size Value (USD Bn) & Volume (Units) Analysis By End-User, 2020 to 2024
    • Current and Future Market Size Value (USD Bn) & Volume (Units) Analysis and Forecast By End-User, 2025 to 2035
      • Hospitals
      • Diagnostic
      • Speciality Clinics
      • Others
    • Y-o-Y Growth Trend Analysis By End-User, 2020 to 2024
    • Absolute $ Opportunity Analysis By End-User, 2025 to 2035
  10. Global Market Analysis 2020 to 2024 and Forecast 2025 to 2035, By Region
    • Introduction
    • Historical Market Size Value (USD Bn) & Volume (Units) Analysis By Region, 2020 to 2024
    • Current Market Size Value (USD Bn) & Volume (Units) Analysis and Forecast By Region, 2025 to 2035
      • North America
      • Latin America
      • Western Europe
      • East Asia
      • South Asia Pacific
      • Eastern Europe
      • Middle East & Africa
    • Market Attractiveness Analysis By Region
  11. North America Global Market Analysis 2020 to 2024 and Forecast 2025 to 2035, By Country
    • Historical Market Size Value (USD Bn) & Volume (Units) Trend Analysis By Market Taxonomy, 2020 to 2024
    • Market Size Value (USD Bn) & Volume (Units) Forecast By Market Taxonomy, 2025 to 2035
      • By Country
        • U.S.
        • Canada
        • Mexico
      • By Technology
      • By Application
      • By Model Type
      • By End-User
    • Market Attractiveness Analysis
      • By Country
      • By Technology
      • By Application
      • By Model Type
      • By End-User
    • Key Takeaways
  12. Latin America Global Market Analysis 2020 to 2024 and Forecast 2025 to 2035, By Country
    • Historical Market Size Value (USD Bn) & Volume (Units) Trend Analysis By Market Taxonomy, 2020 to 2024
    • Market Size Value (USD Bn) & Volume (Units) Forecast By Market Taxonomy, 2025 to 2035
      • By Country
        • Brazil
        • Chile
        • Rest of Latin America
      • By Technology
      • By Application
      • By Model Type
      • By End-User
    • Market Attractiveness Analysis
      • By Country
      • By Technology
      • By Application
      • By Model Type
      • By End-User
    • Key Takeaways
  13. Western Europe Global Market Analysis 2020 to 2024 and Forecast 2025 to 2035, By Country
    • Historical Market Size Value (USD Bn) & Volume (Units) Trend Analysis By Market Taxonomy, 2020 to 2024
    • Market Size Value (USD Bn) & Volume (Units) Forecast By Market Taxonomy, 2025 to 2035
      • By Country
        • Germany
        • Italy
        • France
        • U.K.
        • Spain
        • Russia
        • BENELUX
        • Rest of Europe
      • By Technology
      • By Application
      • By Model Type
      • By End-User
    • Market Attractiveness Analysis
      • By Country
      • By Technology
      • By Application
      • By Model Type
      • By End-User
    • Key Takeaways
  14. East Asia Global Market Analysis 2020 to 2024 and Forecast 2025 to 2035, By Country
    • Historical Market Size Value (USD Bn) & Volume (Units) Trend Analysis By Market Taxonomy, 2020 to 2024
    • Market Size Value (USD Bn) & Volume (Units) Forecast By Market Taxonomy, 2025 to 2035
      • By Country
        • China
        • Japan
        • South Korea
      • By Technology
      • By Application
      • By Model Type
      • By End-User
    • Market Attractiveness Analysis
      • By Country
      • By Technology
      • By Application
      • By Model Type
      • By End-User
    • Key Takeaways
  15. South Asia Pacific Global Market Analysis 2020 to 2024 and Forecast 2025 to 2035, By Country
    • Historical Market Size Value (USD Bn) & Volume (Units) Trend Analysis By Market Taxonomy, 2020 to 2024
    • Market Size Value (USD Bn) & Volume (Units) Forecast By Market Taxonomy, 2025 to 2035
      • By Country
        • India
        • ASEAN Countries
        • Australia & New Zealand
        • Rest of South Asia Pacific
      • By Technology
      • By Application
      • By Model Type
      • By End-User
    • Market Attractiveness Analysis
      • By Country
      • By Technology
      • By Application
      • By Model Type
      • By End-User
    • Key Takeaways
  16. Eastern Europe Global Market Analysis 2020 to 2024 and Forecast 2025 to 2035, By Country
    • Historical Market Size Value (USD Bn) & Volume (Units) Trend Analysis By Market Taxonomy, 2020 to 2024
    • Market Size Value (USD Bn) & Volume (Units) Forecast By Market Taxonomy, 2025 to 2035
      • By Country
        • Russia
        • Poland
        • Hungary
        • Balkan & Baltics
        • Rest of Eastern Europe
      • By Technology
      • By Application
      • By Model Type
      • By End-User
    • Market Attractiveness Analysis
      • By Country
      • By Technology
      • By Application
      • By Model Type
      • By End-User
    • Key Takeaways
  17. Middle East & Africa Global Market Analysis 2020 to 2024 and Forecast 2025 to 2035, By Country
    • Historical Market Size Value (USD Bn) & Volume (Units) Trend Analysis By Market Taxonomy, 2020 to 2024
    • Market Size Value (USD Bn) & Volume (Units) Forecast By Market Taxonomy, 2025 to 2035
      • By Country
        • KSA
        • Other GCC Countries
        • Turkiye
        • South Africa
        • Rest of MEA
      • By Technology
      • By Application
      • By Model Type
      • By End-User
    • Market Attractiveness Analysis
      • By Country
      • By Technology
      • By Application
      • By Model Type
      • By End-User
    • Key Takeaways
  18. Key Countries Global Market Analysis
    • United States
      • Pricing Analysis
      • Market Share Analysis, 2024
        • By Technology
        • By Application
        • By Model Type
        • By End-User
    • Germany
      • Pricing Analysis
      • Market Share Analysis, 2024
        • By Technology
        • By Application
        • By Model Type
        • By End-User
    • China
      • Pricing Analysis
      • Market Share Analysis, 2024
        • By Technology
        • By Application
        • By Model Type
        • By End-User
    • Japan
      • Pricing Analysis
      • Market Share Analysis, 2024
        • By Technology
        • By Application
        • By Model Type
        • By End-User
    • India
      • Pricing Analysis
      • Market Share Analysis, 2024
        • By Technology
        • By Application
        • By Model Type
        • By End-User
  19. Market Structure Analysis
    • Competition Dashboard
    • Competition Benchmarking
    • Market Share Analysis of Top Players
      • By Regional
      • By Technology
      • By Application
      • By Model Type
      • By End-User
  20. Competition Analysis
    • Competition Deep Dive
      • GE HealthCare
        • Overview
        • Product Portfolio
        • Profitability by Market Segments (Product/Age /Sales Channel/Region)
        • Sales Footprint
        • Strategy Overview
          • Marketing Strategy
          • Product Strategy
          • Channel Strategy
      • Koninklijke Philips N.V.
        • Overview
        • Product Portfolio
        • Profitability by Market Segments (Product/Age /Sales Channel/Region)
        • Sales Footprint
        • Strategy Overview
          • Marketing Strategy
          • Product Strategy
          • Channel Strategy
      • Siemens Healthineers AG
        • Overview
        • Product Portfolio
        • Profitability by Market Segments (Product/Age /Sales Channel/Region)
        • Sales Footprint
        • Strategy Overview
          • Marketing Strategy
          • Product Strategy
          • Channel Strategy
      • Medtronic
        • Overview
        • Product Portfolio
        • Profitability by Market Segments (Product/Age /Sales Channel/Region)
        • Sales Footprint
        • Strategy Overview
          • Marketing Strategy
          • Product Strategy
          • Channel Strategy
      • Shimadzu Corporation
        • Overview
        • Product Portfolio
        • Profitability by Market Segments (Product/Age /Sales Channel/Region)
        • Sales Footprint
        • Strategy Overview
          • Marketing Strategy
          • Product Strategy
          • Channel Strategy
      • Hologic, Inc.
        • Overview
        • Product Portfolio
        • Profitability by Market Segments (Product/Age /Sales Channel/Region)
        • Sales Footprint
        • Strategy Overview
          • Marketing Strategy
          • Product Strategy
          • Channel Strategy
      • Canon Medical Systems Corporation
        • Overview
        • Product Portfolio
        • Profitability by Market Segments (Product/Age /Sales Channel/Region)
        • Sales Footprint
        • Strategy Overview
          • Marketing Strategy
          • Product Strategy
          • Channel Strategy
      • Fujifilm Holdings Corporation
        • Overview
        • Product Portfolio
        • Profitability by Market Segments (Product/Age /Sales Channel/Region)
        • Sales Footprint
        • Strategy Overview
          • Marketing Strategy
          • Product Strategy
          • Channel Strategy
      • Ziehm Imaging GmbH
        • Overview
        • Product Portfolio
        • Profitability by Market Segments (Product/Age /Sales Channel/Region)
        • Sales Footprint
        • Strategy Overview
          • Marketing Strategy
          • Product Strategy
          • Channel Strategy
  21. Assumptions & Acronyms Used
  22. Research Methodology

List Of Table

  • Table 1: Global Market Value (USD Bn) Forecast by Region, 2020 to 2035
  • Table 2: Global Market Volume (Units) Forecast by Region, 2020 to 2035
  • Table 3: Global Market Value (USD Bn) Forecast by Technology, 2020 to 2035
  • Table 4: Global Market Volume (Units) Forecast by Technology, 2020 to 2035
  • Table 5: Global Market Value (USD Bn) Forecast by Application, 2020 to 2035
  • Table 6: Global Market Volume (Units) Forecast by Application, 2020 to 2035
  • Table 7: Global Market Value (USD Bn) Forecast by Model Type, 2020 to 2035
  • Table 8: Global Market Volume (Units) Forecast by Model Type, 2020 to 2035
  • Table 9: Global Market Value (USD Bn) Forecast by End-User, 2020 to 2035
  • Table 10: Global Market Volume (Units) Forecast by End-User, 2020 to 2035
  • Table 11: North America Global Market Value (USD Bn) Forecast by Country, 2020 to 2035
  • Table 12: North America Global Market Volume (Units) Forecast by Country, 2020 to 2035
  • Table 13: North America Global Market Value (USD Bn) Forecast by Technology, 2020 to 2035
  • Table 14: North America Global Market Volume (Units) Forecast by Technology, 2020 to 2035
  • Table 15: North America Global Market Value (USD Bn) Forecast by Application, 2020 to 2035
  • Table 16: North America Global Market Volume (Units) Forecast by Application, 2020 to 2035
  • Table 17: North America Global Market Value (USD Bn) Forecast by Model Type, 2020 to 2035
  • Table 18: North America Global Market Volume (Units) Forecast by Model Type, 2020 to 2035
  • Table 19: North America Global Market Value (USD Bn) Forecast by End-User, 2020 to 2035
  • Table 20: North America Global Market Volume (Units) Forecast by End-User, 2020 to 2035
  • Table 21: Latin America Global Market Value (USD Bn) Forecast by Country, 2020 to 2035
  • Table 22: Latin America Global Market Volume (Units) Forecast by Country, 2020 to 2035
  • Table 23: Latin America Global Market Value (USD Bn) Forecast by Technology, 2020 to 2035
  • Table 24: Latin America Global Market Volume (Units) Forecast by Technology, 2020 to 2035
  • Table 25: Latin America Global Market Value (USD Bn) Forecast by Application, 2020 to 2035
  • Table 26: Latin America Global Market Volume (Units) Forecast by Application, 2020 to 2035
  • Table 27: Latin America Global Market Value (USD Bn) Forecast by Model Type, 2020 to 2035
  • Table 28: Latin America Global Market Volume (Units) Forecast by Model Type, 2020 to 2035
  • Table 29: Latin America Global Market Value (USD Bn) Forecast by End-User, 2020 to 2035
  • Table 30: Latin America Global Market Volume (Units) Forecast by End-User, 2020 to 2035
  • Table 31: Western Europe Global Market Value (USD Bn) Forecast by Country, 2020 to 2035
  • Table 32: Western Europe Global Market Volume (Units) Forecast by Country, 2020 to 2035
  • Table 33: Western Europe Global Market Value (USD Bn) Forecast by Technology, 2020 to 2035
  • Table 34: Western Europe Global Market Volume (Units) Forecast by Technology, 2020 to 2035
  • Table 35: Western Europe Global Market Value (USD Bn) Forecast by Application, 2020 to 2035
  • Table 36: Western Europe Global Market Volume (Units) Forecast by Application, 2020 to 2035
  • Table 37: Western Europe Global Market Value (USD Bn) Forecast by Model Type, 2020 to 2035
  • Table 38: Western Europe Global Market Volume (Units) Forecast by Model Type, 2020 to 2035
  • Table 39: Western Europe Global Market Value (USD Bn) Forecast by End-User, 2020 to 2035
  • Table 40: Western Europe Global Market Volume (Units) Forecast by End-User, 2020 to 2035
  • Table 41: East Asia Global Market Value (USD Bn) Forecast by Country, 2020 to 2035
  • Table 42: East Asia Global Market Volume (Units) Forecast by Country, 2020 to 2035
  • Table 43: East Asia Global Market Value (USD Bn) Forecast by Technology, 2020 to 2035
  • Table 44: East Asia Global Market Volume (Units) Forecast by Technology, 2020 to 2035
  • Table 45: East Asia Global Market Value (USD Bn) Forecast by Application, 2020 to 2035
  • Table 46: East Asia Global Market Volume (Units) Forecast by Application, 2020 to 2035
  • Table 47: East Asia Global Market Value (USD Bn) Forecast by Model Type, 2020 to 2035
  • Table 48: East Asia Global Market Volume (Units) Forecast by Model Type, 2020 to 2035
  • Table 49: East Asia Global Market Value (USD Bn) Forecast by End-User, 2020 to 2035
  • Table 50: East Asia Global Market Volume (Units) Forecast by End-User, 2020 to 2035
  • Table 51: South Asia Pacific Global Market Value (USD Bn) Forecast by Country, 2020 to 2035
  • Table 52: South Asia Pacific Global Market Volume (Units) Forecast by Country, 2020 to 2035
  • Table 53: South Asia Pacific Global Market Value (USD Bn) Forecast by Technology, 2020 to 2035
  • Table 54: South Asia Pacific Global Market Volume (Units) Forecast by Technology, 2020 to 2035
  • Table 55: South Asia Pacific Global Market Value (USD Bn) Forecast by Application, 2020 to 2035
  • Table 56: South Asia Pacific Global Market Volume (Units) Forecast by Application, 2020 to 2035
  • Table 57: South Asia Pacific Global Market Value (USD Bn) Forecast by Model Type, 2020 to 2035
  • Table 58: South Asia Pacific Global Market Volume (Units) Forecast by Model Type, 2020 to 2035
  • Table 59: South Asia Pacific Global Market Value (USD Bn) Forecast by End-User, 2020 to 2035
  • Table 60: South Asia Pacific Global Market Volume (Units) Forecast by End-User, 2020 to 2035
  • Table 61: Eastern Europe Global Market Value (USD Bn) Forecast by Country, 2020 to 2035
  • Table 62: Eastern Europe Global Market Volume (Units) Forecast by Country, 2020 to 2035
  • Table 63: Eastern Europe Global Market Value (USD Bn) Forecast by Technology, 2020 to 2035
  • Table 64: Eastern Europe Global Market Volume (Units) Forecast by Technology, 2020 to 2035
  • Table 65: Eastern Europe Global Market Value (USD Bn) Forecast by Application, 2020 to 2035
  • Table 66: Eastern Europe Global Market Volume (Units) Forecast by Application, 2020 to 2035
  • Table 67: Eastern Europe Global Market Value (USD Bn) Forecast by Model Type, 2020 to 2035
  • Table 68: Eastern Europe Global Market Volume (Units) Forecast by Model Type, 2020 to 2035
  • Table 69: Eastern Europe Global Market Value (USD Bn) Forecast by End-User, 2020 to 2035
  • Table 70: Eastern Europe Global Market Volume (Units) Forecast by End-User, 2020 to 2035
  • Table 71: Middle East & Africa Global Market Value (USD Bn) Forecast by Country, 2020 to 2035
  • Table 72: Middle East & Africa Global Market Volume (Units) Forecast by Country, 2020 to 2035
  • Table 73: Middle East & Africa Global Market Value (USD Bn) Forecast by Technology, 2020 to 2035
  • Table 74: Middle East & Africa Global Market Volume (Units) Forecast by Technology, 2020 to 2035
  • Table 75: Middle East & Africa Global Market Value (USD Bn) Forecast by Application, 2020 to 2035
  • Table 76: Middle East & Africa Global Market Volume (Units) Forecast by Application, 2020 to 2035
  • Table 77: Middle East & Africa Global Market Value (USD Bn) Forecast by Model Type, 2020 to 2035
  • Table 78: Middle East & Africa Global Market Volume (Units) Forecast by Model Type, 2020 to 2035
  • Table 79: Middle East & Africa Global Market Value (USD Bn) Forecast by End-User, 2020 to 2035
  • Table 80: Middle East & Africa Global Market Volume (Units) Forecast by End-User, 2020 to 2035

List Of Figures

  • Figure 1: Global Market Volume (Units) Forecast 2020 to 2035
  • Figure 2: Global Market Pricing Analysis
  • Figure 3: Global Market Value (USD Bn) Forecast 2020 to 2035
  • Figure 4: Global Market Value Share and BPS Analysis by Technology, 2025 and 2035
  • Figure 5: Global Market Y-o-Y Growth Comparison by Technology, 2025 to 2035
  • Figure 6: Global Market Attractiveness Analysis by Technology
  • Figure 7: Global Market Value Share and BPS Analysis by Application, 2025 and 2035
  • Figure 8: Global Market Y-o-Y Growth Comparison by Application, 2025 to 2035
  • Figure 9: Global Market Attractiveness Analysis by Application
  • Figure 10: Global Market Value Share and BPS Analysis by Model Type, 2025 and 2035
  • Figure 11: Global Market Y-o-Y Growth Comparison by Model Type, 2025 to 2035
  • Figure 12: Global Market Attractiveness Analysis by Model Type
  • Figure 13: Global Market Value Share and BPS Analysis by End-User, 2025 and 2035
  • Figure 14: Global Market Y-o-Y Growth Comparison by End-User, 2025 to 2035
  • Figure 15: Global Market Attractiveness Analysis by End-User
  • Figure 16: Global Market Value (USD Bn) Share and BPS Analysis by Region, 2025 and 2035
  • Figure 17: Global Market Y-o-Y Growth Comparison by Region, 2025 to 2035
  • Figure 18: Global Market Attractiveness Analysis by Region
  • Figure 19: North America Global Market Incremental $ Opportunity, 2025 to 2035
  • Figure 20: Latin America Global Market Incremental $ Opportunity, 2025 to 2035
  • Figure 21: Western Europe Global Market Incremental $ Opportunity, 2025 to 2035
  • Figure 22: East Asia Global Market Incremental $ Opportunity, 2025 to 2035
  • Figure 23: South Asia Pacific Global Market Incremental $ Opportunity, 2025 to 2035
  • Figure 24: Eastern Europe Global Market Incremental $ Opportunity, 2025 to 2035
  • Figure 25: Middle East & Africa Global Market Incremental $ Opportunity, 2025 to 2035
  • Figure 26: North America Global Market Value Share and BPS Analysis by Country, 2025 and 2035
  • Figure 27: North America Global Market Value Share and BPS Analysis by Technology, 2025 and 2035
  • Figure 28: North America Global Market Y-o-Y Growth Comparison by Technology, 2025 to 2035
  • Figure 29: North America Global Market Attractiveness Analysis by Technology
  • Figure 30: North America Global Market Value Share and BPS Analysis by Application, 2025 and 2035
  • Figure 31: North America Global Market Y-o-Y Growth Comparison by Application, 2025 to 2035
  • Figure 32: North America Global Market Attractiveness Analysis by Application
  • Figure 33: North America Global Market Value Share and BPS Analysis by Model Type, 2025 and 2035
  • Figure 34: North America Global Market Y-o-Y Growth Comparison by Model Type, 2025 to 2035
  • Figure 35: North America Global Market Attractiveness Analysis by Model Type
  • Figure 36: North America Global Market Value Share and BPS Analysis by End-User, 2025 and 2035
  • Figure 37: North America Global Market Y-o-Y Growth Comparison by End-User, 2025 to 2035
  • Figure 38: North America Global Market Attractiveness Analysis by End-User
  • Figure 39: Latin America Global Market Value Share and BPS Analysis by Country, 2025 and 2035
  • Figure 40: Latin America Global Market Value Share and BPS Analysis by Technology, 2025 and 2035
  • Figure 41: Latin America Global Market Y-o-Y Growth Comparison by Technology, 2025 to 2035
  • Figure 42: Latin America Global Market Attractiveness Analysis by Technology
  • Figure 43: Latin America Global Market Value Share and BPS Analysis by Application, 2025 and 2035
  • Figure 44: Latin America Global Market Y-o-Y Growth Comparison by Application, 2025 to 2035
  • Figure 45: Latin America Global Market Attractiveness Analysis by Application
  • Figure 46: Latin America Global Market Value Share and BPS Analysis by Model Type, 2025 and 2035
  • Figure 47: Latin America Global Market Y-o-Y Growth Comparison by Model Type, 2025 to 2035
  • Figure 48: Latin America Global Market Attractiveness Analysis by Model Type
  • Figure 49: Latin America Global Market Value Share and BPS Analysis by End-User, 2025 and 2035
  • Figure 50: Latin America Global Market Y-o-Y Growth Comparison by End-User, 2025 to 2035
  • Figure 51: Latin America Global Market Attractiveness Analysis by End-User
  • Figure 52: Western Europe Global Market Value Share and BPS Analysis by Country, 2025 and 2035
  • Figure 53: Western Europe Global Market Value Share and BPS Analysis by Technology, 2025 and 2035
  • Figure 54: Western Europe Global Market Y-o-Y Growth Comparison by Technology, 2025 to 2035
  • Figure 55: Western Europe Global Market Attractiveness Analysis by Technology
  • Figure 56: Western Europe Global Market Value Share and BPS Analysis by Application, 2025 and 2035
  • Figure 57: Western Europe Global Market Y-o-Y Growth Comparison by Application, 2025 to 2035
  • Figure 58: Western Europe Global Market Attractiveness Analysis by Application
  • Figure 59: Western Europe Global Market Value Share and BPS Analysis by Model Type, 2025 and 2035
  • Figure 60: Western Europe Global Market Y-o-Y Growth Comparison by Model Type, 2025 to 2035
  • Figure 61: Western Europe Global Market Attractiveness Analysis by Model Type
  • Figure 62: Western Europe Global Market Value Share and BPS Analysis by End-User, 2025 and 2035
  • Figure 63: Western Europe Global Market Y-o-Y Growth Comparison by End-User, 2025 to 2035
  • Figure 64: Western Europe Global Market Attractiveness Analysis by End-User
  • Figure 65: East Asia Global Market Value Share and BPS Analysis by Country, 2025 and 2035
  • Figure 66: East Asia Global Market Value Share and BPS Analysis by Technology, 2025 and 2035
  • Figure 67: East Asia Global Market Y-o-Y Growth Comparison by Technology, 2025 to 2035
  • Figure 68: East Asia Global Market Attractiveness Analysis by Technology
  • Figure 69: East Asia Global Market Value Share and BPS Analysis by Application, 2025 and 2035
  • Figure 70: East Asia Global Market Y-o-Y Growth Comparison by Application, 2025 to 2035
  • Figure 71: East Asia Global Market Attractiveness Analysis by Application
  • Figure 72: East Asia Global Market Value Share and BPS Analysis by Model Type, 2025 and 2035
  • Figure 73: East Asia Global Market Y-o-Y Growth Comparison by Model Type, 2025 to 2035
  • Figure 74: East Asia Global Market Attractiveness Analysis by Model Type
  • Figure 75: East Asia Global Market Value Share and BPS Analysis by End-User, 2025 and 2035
  • Figure 76: East Asia Global Market Y-o-Y Growth Comparison by End-User, 2025 to 2035
  • Figure 77: East Asia Global Market Attractiveness Analysis by End-User
  • Figure 78: South Asia Pacific Global Market Value Share and BPS Analysis by Country, 2025 and 2035
  • Figure 79: South Asia Pacific Global Market Value Share and BPS Analysis by Technology, 2025 and 2035
  • Figure 80: South Asia Pacific Global Market Y-o-Y Growth Comparison by Technology, 2025 to 2035
  • Figure 81: South Asia Pacific Global Market Attractiveness Analysis by Technology
  • Figure 82: South Asia Pacific Global Market Value Share and BPS Analysis by Application, 2025 and 2035
  • Figure 83: South Asia Pacific Global Market Y-o-Y Growth Comparison by Application, 2025 to 2035
  • Figure 84: South Asia Pacific Global Market Attractiveness Analysis by Application
  • Figure 85: South Asia Pacific Global Market Value Share and BPS Analysis by Model Type, 2025 and 2035
  • Figure 86: South Asia Pacific Global Market Y-o-Y Growth Comparison by Model Type, 2025 to 2035
  • Figure 87: South Asia Pacific Global Market Attractiveness Analysis by Model Type
  • Figure 88: South Asia Pacific Global Market Value Share and BPS Analysis by End-User, 2025 and 2035
  • Figure 89: South Asia Pacific Global Market Y-o-Y Growth Comparison by End-User, 2025 to 2035
  • Figure 90: South Asia Pacific Global Market Attractiveness Analysis by End-User
  • Figure 91: Eastern Europe Global Market Value Share and BPS Analysis by Country, 2025 and 2035
  • Figure 92: Eastern Europe Global Market Value Share and BPS Analysis by Technology, 2025 and 2035
  • Figure 93: Eastern Europe Global Market Y-o-Y Growth Comparison by Technology, 2025 to 2035
  • Figure 94: Eastern Europe Global Market Attractiveness Analysis by Technology
  • Figure 95: Eastern Europe Global Market Value Share and BPS Analysis by Application, 2025 and 2035
  • Figure 96: Eastern Europe Global Market Y-o-Y Growth Comparison by Application, 2025 to 2035
  • Figure 97: Eastern Europe Global Market Attractiveness Analysis by Application
  • Figure 98: Eastern Europe Global Market Value Share and BPS Analysis by Model Type, 2025 and 2035
  • Figure 99: Eastern Europe Global Market Y-o-Y Growth Comparison by Model Type, 2025 to 2035
  • Figure 100: Eastern Europe Global Market Attractiveness Analysis by Model Type
  • Figure 101: Eastern Europe Global Market Value Share and BPS Analysis by End-User, 2025 and 2035
  • Figure 102: Eastern Europe Global Market Y-o-Y Growth Comparison by End-User, 2025 to 2035
  • Figure 103: Eastern Europe Global Market Attractiveness Analysis by End-User
  • Figure 104: Middle East & Africa Global Market Value Share and BPS Analysis by Country, 2025 and 2035
  • Figure 105: Middle East & Africa Global Market Value Share and BPS Analysis by Technology, 2025 and 2035
  • Figure 106: Middle East & Africa Global Market Y-o-Y Growth Comparison by Technology, 2025 to 2035
  • Figure 107: Middle East & Africa Global Market Attractiveness Analysis by Technology
  • Figure 108: Middle East & Africa Global Market Value Share and BPS Analysis by Application, 2025 and 2035
  • Figure 109: Middle East & Africa Global Market Y-o-Y Growth Comparison by Application, 2025 to 2035
  • Figure 110: Middle East & Africa Global Market Attractiveness Analysis by Application
  • Figure 111: Middle East & Africa Global Market Value Share and BPS Analysis by Model Type, 2025 and 2035
  • Figure 112: Middle East & Africa Global Market Y-o-Y Growth Comparison by Model Type, 2025 to 2035
  • Figure 113: Middle East & Africa Global Market Attractiveness Analysis by Model Type
  • Figure 114: Middle East & Africa Global Market Value Share and BPS Analysis by End-User, 2025 and 2035
  • Figure 115: Middle East & Africa Global Market Y-o-Y Growth Comparison by End-User, 2025 to 2035
  • Figure 116: Middle East & Africa Global Market Attractiveness Analysis by End-User
  • Figure 117: Global Market - Tier Structure Analysis
  • Figure 118: Global Market - Company Share Analysis

- FAQs -

What Is The Global Fixed And Mobile c-Arms Market Size in 2025?

The fixed and mobile C-arms market is valued at USD 3.5 billion in 2025.

Who Are The Major Players Operating In The Fixed And Mobile c-Arms Market?

Prominent players in the market include GE HealthCare, Koninklijke Philips N.V., Siemens Healthineers AG, Medtronic, and other players.

What Is The Estimated Valuation Of The Fixed And Mobile c-Arms Market By 2035?

The market is expected to reach a valuation of USD 5.3 billion by 2035.

What Value CAGR Did The Fixed And Mobile c-Arms Market Exhibit During The Last Five Years?

The growth rate of the fixed and mobile C-arms market is 3.7% from 2020 to 2024.

Fixed And Mobile C-Arms Market

Schedule a Call