Construction Robot Market Size, Share, Growth and Forecast (2026 - 2036)
Construction Robot Market is segmented by Product (Bricklaying Robots, Concrete Dispensing Robots, Rebar Tying Robots, Demolition Robots, Site Inspection Robots, Material Handling Robots), Application (Building Construction, Infrastructure Development, Industrial Construction, Demolition and Renovation, Tunnel and Underground Works), End Use (Construction Companies, Government Infrastructure Bodies, Industrial Developers, Real Estate Developers), and Region, with forecasts covering the period from 2026 to 2036.
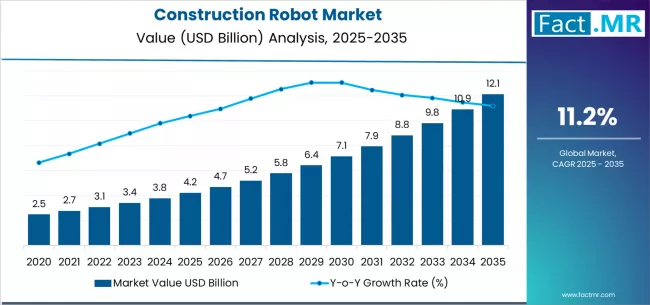
According to Fact.MR estimates, the global construction robot Market was valued at USD 4.2 billion in 2025. The market is projected to reach USD 4.7 billion in 2026 and is expected to grow to USD 13.5 billion by 2036, expanding at a CAGR of 11.2%. Bricklaying Robots is anticipated to account for 46.0% of the product segment in 2026, while Building Construction is expected to remain the leading application with around 52.0% share.
Construction Robot Market Analysis and Forecast by Fact.MR
- The global construction robot market covers automated and semi-automated robotic systems used for building construction, infrastructure development, demolition, site inspection, and material handling on construction sites.
- The category includes bricklaying robots, concrete dispensing robots, rebar tying robots, demolition robots, site inspection robots, and material handling robots.
- These systems use robotic manipulation, AI and computer vision, automation, and positioning technologies to improve construction speed, precision, and worker safety.
- Demand is shaped by construction labor shortages, productivity improvement targets, safety regulation, infrastructure investment, and the growing maturity of construction-specific robotic platforms.
Summary of Construction Robot Market
- Market Snapshot
- In 2025, the global Construction Robot Market was valued at approximately USD 4.2 billion.
- The market is estimated to reach USD 4.67 billion in 2026 and is projected to attain USD 13.5 billion by 2036.
- The construction robot market is likely to expand at a CAGR of 11.2% during the forecast period.
- The market is anticipated to create an absolute dollar opportunity of USD 8.83 billion between 2026 and 2036.
- Bricklaying Robots accounts for 46% of product share in 2026.
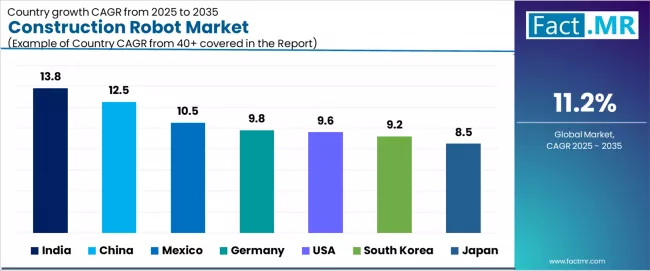
- India (13.8%) and China (12.5%) are the key growth markets during the forecast period.
- Demand and Growth Drivers
- Labour shortage in skilled trades is the main reason for the adoption of robotics in construction. Contractors rely on automation to deliver projects on time despite labour shortages.
- Investment in bricklaying, concrete dispensing and rebar tying robots that speed up repetitive tasks on commercial and residential job sites is being driven by productivity targets in building construction.
- The development of infrastructure programs for roads, bridges, tunnels, and public works is driving demand for robotic systems that can operate in complex, high-risk construction environments.
- Construction-site safety requirements are speeding up the adoption of demolition robots and material-handling systems that reduce worker exposure to hazardous tasks.
- AI and computer vision are also being integrated into site inspection robots and autonomous equipment, allowing them to carry out surveying, progress monitoring and quality control tasks with less human input.
- Product and Segment View
- Bricklaying Robots to capture 46% of the product segment by 2026, backed by wide applicability and mature installed base across core end-use verticals.
- Demand is driven by institutional buying, regulatory requirements and increasing professional adoption. * Building Construction held the largest application segment in 2026.
- Robotic Manipulation Technology accounts for 65% of the technology segment owing to its well-established standard operational approach.
- Key segmentation includes:
- Product: Bricklaying Robots, Concrete Dispensing Robots, Rebar Tying Robots, Demolition Robots, Site Inspection Robots
- Application Building Construction Infrastructure Construction Industrial Construction Demolition and Renovation Tunnel and Underground Works
- Distribution Channel: Direct Sales, Distributors, System Integrators, Aftermarket Service
- These systems enable:
- Functionality for measurement, monitoring, or control in distributed operational settings.
- Integrated platforms for remote management and data integration.
- Optimization of performance in applications where accuracy and reliability are the main criteria for procurement.
- Geography and Competitive Outlook
- Demand in North America is stable, propelled by established end-use verticals, replacement cycles and technology upgrade activity.
- Europe is steadily growing from regulatory compliance, process modernization and increasing professional adoption.
- Asia Pacific is the fastest-growing region, with India (13.8%) and China (12.5%) leading demand expansion.
- Key companies include Komatsu, Caterpillar, Doosan Robotics, Hyundai CE, Built Robotics, and Trimble, DJI, Leica Geosystems.
- Analyst Opinion
- Shambhu Nath Jha, Principal Consultant at Fact.MR, says 'The construction robot market is at an inflection point between pilot deployment and commercial scale. Bricklaying robots lead by value because masonry is one of the most labor-intensive and repetitive construction tasks, making it the first application where robotic productivity gains justify equipment investment. Building construction accounts for the largest application share because it represents the highest volume of repetitive, automatable tasks across residential, commercial, and institutional projects. India and China are the fastest-growing markets because both countries face severe construction labor gaps while simultaneously executing the largest building programs globally. The critical barrier is not technology but site integration, meaning the ability to operate robots reliably in the unstructured, changing environment of a real construction site rather than a controlled factory.'
Key Growth Drivers, Constraints, and Opportunities
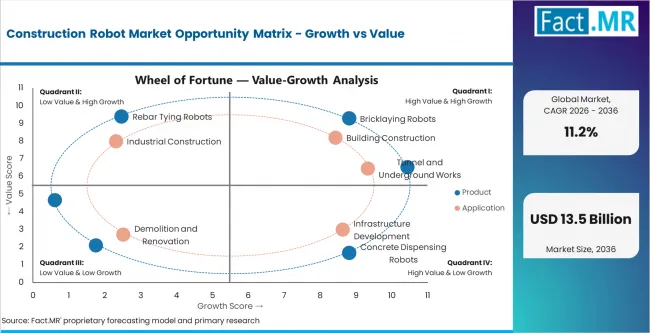
Key Factors Driving Growth
- Construction labor shortages are accelerating the use of robotics as contractors are having difficulty finding skilled masons, rebar workers and equipment operators for large projects.
- Productivity goals in building construction are motivating the procurement of robots that automate repetitive, labor-intensive tasks such as bricklaying, concrete placement, and rebar tying.
- Adherence to safety regulation is driving the demand for demolition robots and automated material handling systems that minimize worker exposure to high-risk site conditions.
Key Market Constraints
- The high cost of equipment and the uncertain return on investment in unstructured site environments limit adoption to well-funded contractors and large-scale projects that can amortize robotic investment.
- This makes robotic deployment more challenging than factory automation. Site variability and integration complexity add to the challenge. Weather, terrain, and design changes may impact system performance.
- In markets where there is no developed construction technology ecosystem, the speed of deployment is constrained by the availability of trained robotic operators and maintenance technicians.
Key Opportunity Areas
- 3D printing and concrete dispensing robots are creating new ways to construct buildings with less material waste, manpower and project time for some types of buildings.
- Drones and ground robots are automating site inspections, driving demand for artificial intelligence-enabled progress monitoring, safety surveillance and quality control systems.
- The addressable market for off-site automated building systems is expanding as modular and prefabricated construction are combined with robotic assembly.
Segment-wise Analysis of the Construction Robot Market
- Construction Robot Market Segment Outlook Market Size Market Share Market Trends Market Growth Market Research
- Bricklaying Robots hold the largest share in the product segment with 46% in 2026, owing to the broad applicability, low complexity, and consistent usage among the largest end-use verticals.
- Robotic Manipulation Technology accounts for 65% of the technology segment, reflecting its established operational role and broad installed base.
The construction robot market is segmented by product, application, end use, technology, formulation, distribution channel, and region. By product, the market covers Bricklaying Robots, Concrete Dispensing Robots, Rebar Tying Robots, Demolition Robots, Site Inspection Robots. By application, coverage includes Building Construction, Infrastructure Development, Industrial Construction, Demolition and Renovation, Tunnel and Underground Works. Bricklaying Robots leads by value in the near term because of their installed base and broad applicability, while emerging segments are expected to drive the next phase of growth as requirements evolve.
Which Product Segment Dominates the Construction Robot Market?
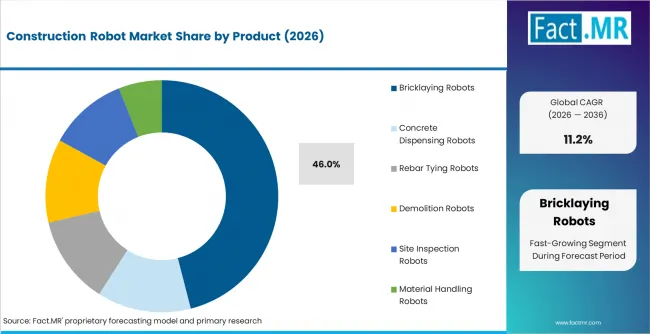
The product type segment is expected to account for 46.0% of the bricklaying robots in 2026. Their leadership is a reflection of the high labor intensity of masonry work and the maturity of robotic bricklaying platforms that deliver measurable productivity gains on commercial and residential construction sites. Automation in bricklaying solves one of the oldest skilled labor shortages in the construction industry. The second largest segment is concrete dispensing robots, with demand expected to grow due to increased use of robotic and 3D concrete printing systems for foundations, walls and structural elements where automated placement reduces labor requirements and increases placement precision.
Which Application Segment Dominates the Construction Robot Market?
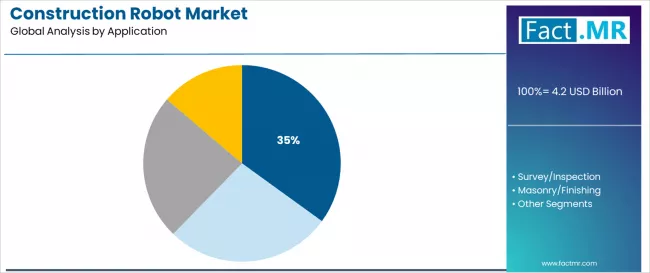
In 2026, the application segment will account for 52.0% of building construction. This dominance is a function of the concentration of repetitive automatable tasks in building projects, where bricklaying, concrete work, rebar tying and material handling represent the highest volume opportunities for robot deployment. The second largest application is in infrastructure development driven by road, bridge, tunnel and public works projects, where robotic systems improve safety and productivity in complex, high-risk construction environments.
Which Product Trend is Shaping the Next Phase of Growth in the Construction Robot Market?
AI-powered site inspection and autonomous construction monitoring systems aren’t the largest product category yet, but they are the fastest growing segment. The share is expected to expand as contractors implement drone-based progress monitoring, ground robot safety surveillance and computer vision quality control at active construction sites. This move to autonomous inspections is in line with the digitization of construction project management. Site managers increasingly want real-time visibility into work progress, safety compliance and quality issues without having to rely solely on manual walkthroughs. Manufacturers with integrated drone and ground robot platforms with AI-powered analytics, BIM comparison and automated reporting are well-positioned to capture a fast-growing share of the construction technology market.
Regional Outlook Across Key Markets
.webp)
- India takes the lead with 13.8% growth, driven by rising domestic demand, infrastructure investment and policy-driven adoption.
- North America is mixed, with the U.S. at 9.6%, a mature market with established replacement cycles and technology upgrade activity.
- Demand in Europe is stable, with Germany at 9.8% supported by compliance, modernisation and quality based procurement.
CAGR Table
| Country | CAGR (%) |
|---|---|
| India | 13.8% |
| China | 12.5% |
| Mexico | 10.5% |
| Germany | 9.8% |
| USA | 9.6% |
| South Korea | 9.2% |
| Japan | 8.5% |
Source: Fact MR (FMR) analysis, based on proprietary forecasting model and primary research.
Market Outlook for Construction Robots in India
The India construction robot market is projected to grow at a CAGR of 13.8% through 2036. Demand is shaped by massive building construction programs, severe labor shortages in skilled trades, and growing government interest in construction technology adoption.
- Building construction programs drive robotic deployment demand.
- Labor shortages accelerate automation adoption on job sites.
- Government interest supports construction technology investment.
China Construction Robot Demand Trends
The China construction robot market is projected to grow at a CAGR of 12.5% through 2036. Demand is supported by large-scale building programs, domestic robotics manufacturing capability, and strategic investment in construction automation.
- Large-scale building programs generate high-volume robotic demand.
- Domestic manufacturing supports competitive pricing and rapid deployment.
- Strategic investment accelerates construction automation technology development.
Mexico Construction Robot Growth Assessment
The Mexico construction robot market is projected to grow at a CAGR of 10.5% through 2036. Demand is supported by infrastructure development, nearshoring construction activity, and growing adoption of construction automation.
- Infrastructure development drives robotic system procurement.
- Nearshoring construction supports building automation demand.
- Construction automation adoption is increasing across large projects.
Germany Construction Robot Market Demand Analysis
The Germany construction robot market is projected to grow at a CAGR of 9.8% through 2036. Demand is supported by skilled labor shortages, construction productivity targets, and strong industrial robotics expertise.
- Skilled labor shortages drive construction automation investment.
- Productivity targets support robotic system procurement.
- Industrial robotics expertise enables rapid technology transfer.
United States Construction Robot Market Outlook
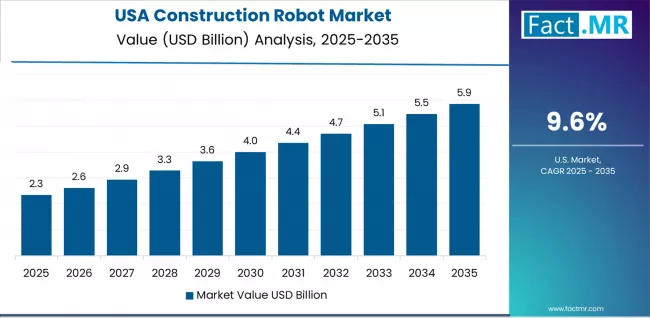
The U.S. construction robot market is projected to grow at a CAGR of 9.6% through 2036. Demand is supported by construction labor shortages, infrastructure investment, and growing venture capital and corporate investment in construction technology.
- Labor shortages accelerate robotic adoption on construction sites.
- Infrastructure investment generates demand for automated construction systems.
- Technology investment supports construction robotics commercialization.
South Korea Construction Robot Demand Analysis
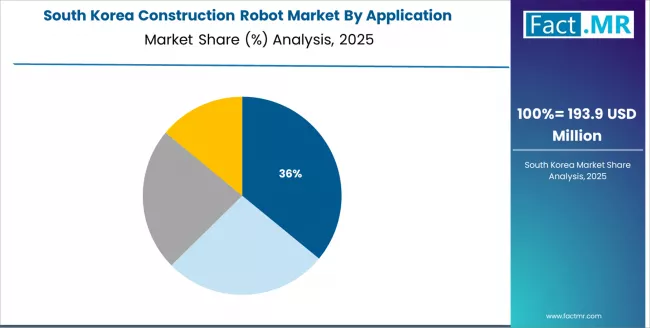
The South Korea construction robot market is projected to grow at a CAGR of 9.2% through 2036. Demand is supported by construction automation policy, robotics R&D capability, and high-rise building construction activity.
- Construction automation policy supports robotic deployment.
- Robotics R&D capability enables technology development.
- High-rise construction generates demand for automated systems.
Japan Construction Robot Growth Outlook
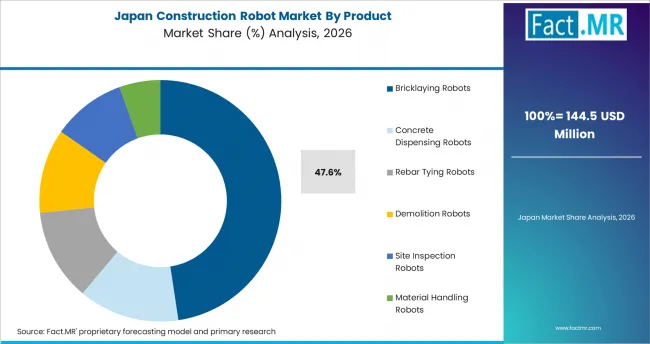
The Japan construction robot market is projected to grow at a CAGR of 8.5% through 2036. Demand is shaped by severe labor shortages, aging workforce, and strong tradition of construction automation investment by major contractors.
- Severe labor shortages drive construction automation necessity.
- Aging workforce accelerates robotic replacement of manual tasks.
- Major contractors lead investment in construction robotics R&D.
Competitive Benchmarking and Company Positioning
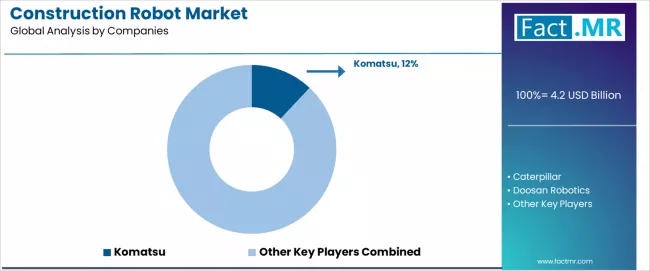
Construction Robot Market Analysis By Company
- Komatsu, Caterpillar, Doosan Robotics, and Hyundai CE hold strong positions in the construction robot market through equipment manufacturing scale, construction industry relationships, and growing investment in autonomous and robotic construction platforms.
- Built Robotics, Trimble, DJI, and Leica Geosystems compete through focused construction technology capability, autonomous equipment retrofits, site inspection platforms, and positioning technology that enables robotic precision on construction sites.
- Now the race is more defined by AI integration, site adaptability and contractor-friendly deployment models, with companies offering turnkey robotic solutions and robotics-as-a-service gaining traction with early-adopter contractors.
The competitive landscape includes traditional construction equipment manufacturers and robotics firms. Scale is brought to manufacturing, dealer networks and contractor relationships by manufacturers Komatsu, Caterpillar, Hyundai CE, Volvo CE and SANY.
Doosan Robotics, Built Robotics, Boston Dynamics and ABB bring core robotic manipulation, autonomy and AI expertise from industrial and general purpose robotics backgrounds.
Competition comes with the addition of positioning technology, site inspection platforms, demolition robotics and specialty construction tool automation from Trimble, DJI, Leica Geosystems, Hilti, Brokk and Husqvarna.
Strategic priorities are the development of site-ready robotic platforms, expanding autonomous equipment capability, contractor deployment support and scalable business models for construction robotics adoption.
Key Companies in the Construction Robot Market
- Komatsu, Caterpillar, Doosan Robotics, Hyundai CE are among the leading players in the construction robot market globally, supported by strong brand visibility, broad product portfolios, and established positions across core end-use segments.
- Built Robotics, Trimble, DJI, Leica Geosystems hold established positions across specific application verticals, geographic markets, and technology tiers, supported by product quality, distribution penetration, and category experience.
- Hilti, Brokk, Boston Dynamics, ABB, Volvo CE, Husqvarna, SANY continue to compete through focused product offerings, price-point coverage, and niche strength in specific applications or regional markets.
Recent Industry Developments
- Built Robotics – Technology Expansion / Autonomous Excavation Platform (Ongoing 2025) Built Robotics continued expanding its Exosystem platform, an aftermarket autonomy kit that converts standard excavators into fully autonomous machines for trenching, grading, and excavation tasks on construction sites.
- Doosan Robotics – Collaborative Robots in Construction (2025) Doosan Robotics advanced its AI-powered collaborative robot solutions, focusing on material handling, pick-and-place, and repetitive tasks suitable for construction environments through integration with vision systems and intelligent software.
- Hilti – Jaibot Semi-Autonomous Drilling Robot (Ongoing) Hilti continued deployment and enhancements of its Jaibot, a semi-autonomous mobile drilling robot designed for overhead ceiling drilling and anchoring in MEP (mechanical, electrical, plumbing) installations on commercial projects.
Leading Companies Shaping the Construction Robot Market
- Komatsu
- Caterpillar
- Doosan Robotics
- Hyundai CE
- Built Robotics
- Trimble
- DJI
- Leica Geosystems
- Hilti
- Brokk
- Boston Dynamics
- ABB
- Volvo CE
- Husqvarna
- SANY
Sources and Research References
- Built Robotics. Autonomous excavation platform and construction automation updates.
- Doosan Robotics. Construction collaborative robot product launch.
- Hilti. Semi-autonomous drilling robot and construction technology expansion.
- Construction industry labor statistics, infrastructure investment data, robotics deployment reports, and construction technology publications.
- Primary interviews with construction contractors, robotics developers, equipment manufacturers, and construction technology investors.
This bibliography is provided for reader reference and is not exhaustive. The full report contains the complete reference list and detailed citations.
Key Questions This Report Addresses
- What is the current and future size of the Construction Robot Market?
- How fast is the market expected to grow between 2026 and 2036?
- Which product type is likely to lead the market by 2026?
- Which application segment accounts for the highest demand by 2026?
- What factors are driving demand for construction robots globally?
- How are labor shortages influencing automation adoption?
- Why are India and China the fastest-growing markets?
- How is AI and computer vision shaping construction robotics?
- Which countries are projected to show the fastest growth through 2036?
- Who are the key companies active in the Construction Robot Market?
- How does Fact.MR estimate and validate the market forecast?
Construction Robot Market Definition
The construction robot market covers automated and semi-automated robotic systems for building construction, infrastructure development, demolition, site inspection, and material handling across bricklaying, concrete dispensing, rebar tying, demolition, and inspection robot configurations.
Construction Robot Market Inclusions
- The scope covers global and regional market size and forecasts for 2026 to 2036 across product type, application, end use, technology, formulation, and distribution channel.
- It includes regional demand analysis based on construction activity, labor availability, infrastructure investment, and construction technology adoption.
- The report covers technology trends, market drivers and constraints, and the competitive landscape, including robotics capability, contractor relationships, and deployment track records.
- It includes pricing and cost analysis across semi-automated, fully automated, and autonomous construction robot categories.
Construction Robot Market Exclusions
- The scope excludes conventional non-robotic construction equipment including standard excavators, cranes, and loaders without autonomous or robotic capability.
- It excludes industrial manufacturing robots used in factory settings outside of construction sites.
- The report excludes construction management software, BIM platforms, and project management tools sold without robotic hardware.
- It also excludes personal protective equipment, safety systems, and manual construction tools.
Construction Robot Market Research Methodology
- The methodology combines secondary research, primary interviews, and forecast modelling.
- It draws on 100+ secondary sources and benchmarks 50+ company product portfolios.
- Market sizing covers 30+ countries through a demand-side model, supported by top-down validation.
- Key inputs include application demand trends, regulatory activity, end-use adoption rates, pricing analysis and distribution penetration.
- The model also checks demand against shipments, pricing trends, channel mix, and new product introductions.
- First level validation is carried out through 25+ interviews with manufacturers, distributors, end users and industry players.
- Final estimates are subject to trade-flow checks, review and sensitivity testing of sales patterns.
Scope of Analysis
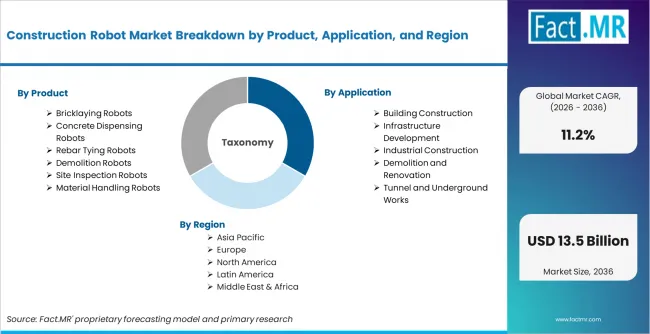
| Parameter | Details |
|---|---|
| Quantitative Units | USD 4.67 billion to USD 13.5 billion, at a CAGR of 11.2% |
| Market Definition | The construction robot market covers automated and semi-automated robotic systems for building construction, infrastructure development, demolition, site inspection, and material handling across bricklaying, concrete dispensing, rebar tying, demolition, and inspection robot configurations. |
| Regions Covered | North America, Latin America, Europe, East Asia, South Asia and Pacific, Middle East and Africa |
| Countries Covered | India, China, Mexico, Germany, USA, South Korea, Japan, 30 plus countries |
| Key Companies | Komatsu, Caterpillar, Doosan Robotics, Hyundai CE, Built Robotics, Trimble, DJI, Leica Geosystems, Hilti, Brokk, Boston Dynamics, ABB, Volvo CE, Husqvarna, SANY |
| Forecast Period | 2026 to 2036 |
| Approach | Hybrid demand-side and top-down methodology built on country-level application demand, product benchmarking, pricing analysis, shipment validation, and primary interviews across manufacturers, distributors, and end users |
Construction Robot Market Segmentation
-
Construction Robot Market Segmented by Product:
- Bricklaying Robots
- Autonomous Bricklayers
- Single Arm Bricklaying Systems
- Multi Axis Bricklaying Robots
- Semi Autonomous Bricklayers
- Operator Assisted Systems
- Guided Brick Placement Robots
- Autonomous Bricklayers
- Concrete Dispensing Robots
- 3D Concrete Printing Robots
- Large Scale Printing Systems
- Structural Printing Units
- Concrete Pouring Robots
- Automated Pouring Systems
- Precision Casting Robots
- 3D Concrete Printing Robots
- Rebar Tying Robots
- Automatic Binding Robots
- High Speed Tying Systems
- Construction Reinforcement Robots
- Semi Automated Binding Robots
- Manual Assisted Systems
- Portable Rebar Units
- Automatic Binding Robots
- Demolition Robots
- Hydraulic Demolition Robots
- High Reach Demolition Systems
- Heavy Duty Breaking Robots
- Remote Controlled Demolition Robots
- Hazardous Area Robots
- Precision Demolition Units
- Hydraulic Demolition Robots
- Site Inspection Robots
- Autonomous Inspection Robots
- AI Vision Based Robots
- Mapping and Survey Robots
- Drone Integrated Ground Robots
- Hybrid Inspection Systems
- 3D Scanning Robots
- Autonomous Inspection Robots
- Material Handling Robots
- Construction Transport Robots
- Heavy Load Carrying Robots
- Automated Site Logistics Robots
- Loader Assistance Robots
- Smart Loading Systems
- AI Guided Transport Robots
- Construction Transport Robots
- Bricklaying Robots
-
Construction Robot Market Segmented by Application:
- Building Construction
- Residential Construction
- Housing Projects
- Apartment Construction
- Commercial Construction
- Office Buildings
- Retail Complexes
- Residential Construction
- Infrastructure Development
- Road Construction
- Highway Projects
- Urban Road Works
- Bridge Construction
- Structural Bridge Works
- Cable Stayed Bridge Projects
- Road Construction
- Industrial Construction
- Factory Construction
- Manufacturing Plants
- Industrial Warehouses
- Energy Facilities
- Power Plant Construction
- Renewable Energy Installations
- Factory Construction
- Demolition and Renovation
- Controlled Demolition
- High Rise Demolition
- Industrial Site Clearing
- Renovation Works
- Building Retrofit Projects
- Structural Repairs
- Controlled Demolition
- Tunnel and Underground Works
- Metro Construction
- Underground Rail Projects
- Utility Tunnel Works
- Mining Infrastructure
- Underground Facility Construction
- Support Structure Installation
- Metro Construction
- Building Construction
-
Construction Robot Market Segmented by End Use:
- Construction Companies
- General Contractors
- Civil Engineering Firms
- EPC Contractors
- Specialized Builders
- High Rise Builders
- Infrastructure Developers
- General Contractors
- Government Infrastructure Bodies
- Public Works Departments
- Urban Development Authorities
- Transport Infrastructure Agencies
- Defense Construction Units
- Military Engineering Services
- Strategic Infrastructure Builders
- Public Works Departments
- Industrial Developers
- Manufacturing Facility Builders
- Plant Construction Firms
- Warehouse Developers
- Energy Sector Builders
- Power Plant Developers
- Renewable Energy EPC Firms
- Manufacturing Facility Builders
- Real Estate Developers
- Residential Developers
- Housing Societies
- Smart City Developers
- Commercial Developers
- Mall Developers
- Office Complex Developers
- Residential Developers
- Construction Companies
-
Construction Robot Market Segmented by Technology:
- Robotic Manipulation Technology
- Multi Axis Robotics
- 6 Axis Construction Robots
- High Precision Robotic Arms
- Hydraulic Robotics
- Heavy Load Actuation Systems
- Industrial Strength Robot Arms
- Multi Axis Robotics
- AI and Computer Vision
- Object Recognition Systems
- Material Detection AI
- Site Mapping Vision Systems
- Path Planning AI
- Autonomous Navigation Systems
- Dynamic Obstacle Avoidance
- Object Recognition Systems
- Automation Technology
- Semi Autonomous Systems
- Operator Assisted Robotics
- Remote Controlled Robots
- Fully Autonomous Systems
- Self Learning Construction Robots
- Unmanned Site Robots
- Semi Autonomous Systems
- Positioning Technology
- GPS Based Systems
- RTK GPS Navigation
- Construction Site Mapping
- Laser Positioning Systems
- LIDAR Based Guidance
- 3D Scanning Systems
- GPS Based Systems
- Robotic Manipulation Technology
-
Construction Robot Market Segmented by Formulation:
- Robotic Systems
- Construction Robots
- Bricklaying Robots
- Demolition Robots
- Support Systems
- Control Units
- Power Systems
- Construction Robots
- Integrated Construction Systems
- Automated Construction Lines
- 3D Printing Construction Systems
- Modular Building Robots
- Site Automation Systems
- Smart Site Management Systems
- Digital Construction Platforms
- Automated Construction Lines
- Material Handling Systems
- Robotic Transport Units
- Automated Loaders
- Site Logistics Robots
- Robotic Transport Units
- Service Systems
- Maintenance Services
- Robot Calibration Services
- Repair Services
- Upgrade Services
- AI Upgrade Modules
- Hardware Retrofit Kits
- Maintenance Services
- Robotic Systems
-
Construction Robot Market Segmented by Distribution Channel:
- Direct Sales
- OEM Supply
- Construction Robot Manufacturers
- Industrial Automation OEMs
- Project Sales
- Infrastructure Projects
- Smart City Projects
- OEM Supply
- Distributors
- Industrial Distributors
- Automation Equipment Suppliers
- Construction Equipment Dealers
- Authorized Dealers
- Local Robotics Dealers
- Construction Machinery Dealers
- Industrial Distributors
- System Integrators
- Robotics Integrators
- Site Automation Integrators
- Engineering Solution Providers
- Robotics Integrators
- Aftermarket Services
- Maintenance Services
- Robot Repair Firms
- Spare Parts Suppliers
- Upgrade Services
- Software Upgrade Providers
- Hardware Retrofit Services
- Maintenance Services
- Direct Sales
-
Construction Robot Market by Region:
- North America
- USA
- Canada
- Mexico
- Latin America
- Brazil
- Chile
- Rest of Latin America
- Western Europe
- Germany
- UK
- Italy
- Spain
- France
- Nordic
- BENELUX
- Rest of Western Europe
- Eastern Europe
- Russia
- Poland
- Hungary
- Balkan & Baltic
- Rest of Eastern Europe
- East Asia
- China
- Japan
- South Korea
- South Asia and Pacific
- India
- ASEAN
- Australia & New Zealand
- Rest of South Asia and Pacific
- Middle East & Africa
- Kingdom of Saudi Arabia
- Other GCC Countries
- Turkiye
- South Africa
- Other African Union
- Rest of Middle East & Africa
- North America

- Frequently Asked Questions -
How big is the Construction Robot Market in 2025?
The global construction robot market is estimated to be valued at USD 4.2 billion in 2025.
What will be the size of the Construction Robot Market in 2036?
The market size is projected to reach USD 13.5 billion by 2036.
How much will the Construction Robot Market grow between 2026 and 2036?
The market is expected to grow at an 11.2% CAGR between 2026 and 2036.
What are the key product types in the Construction Robot Market?
The key product types are bricklaying robots, concrete dispensing robots, rebar tying robots, demolition robots, site inspection robots, and material handling robots.
Which application segment will contribute significant share in the Construction Robot Market in 2026?
Building construction is expected to account for 52.0% share in the market in 2026.
Table of Content
- Executive Summary
- Global Market Outlook
- Demand to side Trends
- Supply to side Trends
- Technology Roadmap Analysis
- Analysis and Recommendations
- Market Overview
- Market Coverage / Taxonomy
- Market Definition / Scope / Limitations
- Research Methodology
- Chapter Orientation
- Analytical Lens and Working Hypotheses
- Market Structure, Signals, and Trend Drivers
- Benchmarking and Cross-market Comparability
- Market Sizing, Forecasting, and Opportunity Mapping
- Research Design and Evidence Framework
- Desk Research Programme (Secondary Evidence)
- Company Annual and Sustainability Reports
- Peer-reviewed Journals and Academic Literature
- Corporate Websites, Product Literature, and Technical Notes
- Earnings Decks and Investor Briefings
- Statutory Filings and Regulatory Disclosures
- Technical White Papers and Standards Notes
- Trade Journals, Industry Magazines, and Analyst Briefs
- Conference Proceedings, Webinars, and Seminar Materials
- Government Statistics Portals and Public Data Releases
- Press Releases and Reputable Media Coverage
- Specialist Newsletters and Curated Briefings
- Sector Databases and Reference Repositories
- Fact.MR Internal Proprietary Databases and Historical Market Datasets
- Subscription Datasets and Paid Sources
- Social Channels, Communities, and Digital Listening Inputs
- Additional Desk Sources
- Expert Input and Fieldwork (Primary Evidence)
- Primary Modes
- Qualitative Interviews and Expert Elicitation
- Quantitative Surveys and Structured Data Capture
- Blended Approach
- Why Primary Evidence is Used
- Field Techniques
- Interviews
- Surveys
- Focus Groups
- Observational and In-context Research
- Social and Community Interactions
- Stakeholder Universe Engaged
- C-suite Leaders
- Board Members
- Presidents and Vice Presidents
- R&D and Innovation Heads
- Technical Specialists
- Domain Subject-matter Experts
- Scientists
- Physicians and Other Healthcare Professionals
- Governance, Ethics, and Data Stewardship
- Research Ethics
- Data Integrity and Handling
- Primary Modes
- Tooling, Models, and Reference Databases
- Desk Research Programme (Secondary Evidence)
- Data Engineering and Model Build
- Data Acquisition and Ingestion
- Cleaning, Normalisation, and Verification
- Synthesis, Triangulation, and Analysis
- Quality Assurance and Audit Trail
- Market Background
- Market Dynamics
- Drivers
- Restraints
- Opportunity
- Trends
- Scenario Forecast
- Demand in Optimistic Scenario
- Demand in Likely Scenario
- Demand in Conservative Scenario
- Opportunity Map Analysis
- Product Life Cycle Analysis
- Supply Chain Analysis
- Investment Feasibility Matrix
- Value Chain Analysis
- PESTLE and Porter’s Analysis
- Regulatory Landscape
- Regional Parent Market Outlook
- Production and Consumption Statistics
- Import and Export Statistics
- Market Dynamics
- Global Market Analysis 2021 to 2025 and Forecast, 2026 to 2036
- Historical Market Size Value (USD Million) Analysis, 2021 to 2025
- Current and Future Market Size Value (USD Million) Projections, 2026 to 2036
- Y to o to Y Growth Trend Analysis
- Absolute $ Opportunity Analysis
- Global Market Pricing Analysis 2021 to 2025 and Forecast 2026 to 2036
- Global Market Analysis 2021 to 2025 and Forecast 2026 to 2036, By Product
- Introduction / Key Findings
- Historical Market Size Value (USD Million) Analysis By Product, 2021 to 2025
- Current and Future Market Size Value (USD Million) Analysis and Forecast By Product, 2026 to 2036
- Bricklaying Robots
- Autonomous Bricklayers
- Single Arm Bricklaying Systems
- Multi Axis Bricklaying Robots
- Semi Autonomous Bricklayers
- Operator Assisted Systems
- Guided Brick Placement Robots
- Concrete Dispensing Robots
- 3D Concrete Printing Robots
- Large Scale Printing Systems
- Structural Printing Value (USD Million)s
- Concrete Pouring Robots
- Automated Pouring Systems
- Rebar Tying Robots
- Automatic Binding Robots
- High Speed Tying Systems
- Construction Reinforcement Robots
- Semi Automated Binding Robots
- Manual Assisted Systems
- Demolition Robots
- Hydraulic Demolition Robots
- High Reach Demolition Systems
- Heavy Duty Breaking Robots
- Remote Controlled Demolition Robots
- Hazardous Area Robots
- Site Inspection Robots
- Autonomous Inspection Robots
- AI Vision Based Robots
- Mapping and Survey Robots
- Drone Integrated Ground Robots
- Hybrid Inspection Systems
- Material Handling Robots
- Construction Transport Robots
- Heavy Load Carrying Robots
- Automated Site Logistics Robots
- Loader Assistance Robots
- Smart Loading Systems
- Bricklaying Robots
- Y to o to Y Growth Trend Analysis By Product, 2021 to 2025
- Absolute $ Opportunity Analysis By Product, 2026 to 2036
- Global Market Analysis 2021 to 2025 and Forecast 2026 to 2036, By Application
- Introduction / Key Findings
- Historical Market Size Value (USD Million) Analysis By Application, 2021 to 2025
- Current and Future Market Size Value (USD Million) Analysis and Forecast By Application, 2026 to 2036
- Building Construction
- Residential Construction
- Housing Projects
- Apartment Construction
- Commercial Construction
- Office Buildings
- Retail Complexes
- Infrastructure Development
- Road Construction
- Highway Projects
- Urban Road Works
- Bridge Construction
- Structural Bridge Works
- Industrial Construction
- Factory Construction
- Manufacturing Plants
- Industrial Warehouses
- Energy Facilities
- Power Plant Construction
- Demolition and Renovation
- Controlled Demolition
- High Rise Demolition
- Industrial Site Clearing
- Renovation Works
- Building Retrofit Projects
- Tunnel and Underground Works
- Metro Construction
- Underground Rail Projects
- Utility Tunnel Works
- Mining Infrastructure
- Underground Facility Construction
- Building Construction
- Y to o to Y Growth Trend Analysis By Application, 2021 to 2025
- Absolute $ Opportunity Analysis By Application, 2026 to 2036
- Global Market Analysis 2021 to 2025 and Forecast 2026 to 2036, By End Use
- Introduction / Key Findings
- Historical Market Size Value (USD Million) Analysis By End Use, 2021 to 2025
- Current and Future Market Size Value (USD Million) Analysis and Forecast By End Use, 2026 to 2036
- Construction Companies
- General Contractors
- Civil Engineering Firms
- EPC Contractors
- Specialized Builders
- High Rise Builders
- Infrastructure Developers
- Government Infrastructure Bodies
- Public Works Departments
- Urban Development Authorities
- Transport Infrastructure Agencies
- Defense Construction Value (USD Million)s
- Military Engineering Services
- Industrial Developers
- Manufacturing Facility Builders
- Plant Construction Firms
- Warehouse Developers
- Energy Sector Builders
- Power Plant Developers
- Real Estate Developers
- Residential Developers
- Housing Societies
- Smart City Developers
- Commercial Developers
- Mall Developers
- Construction Companies
- Y to o to Y Growth Trend Analysis By End Use, 2021 to 2025
- Absolute $ Opportunity Analysis By End Use, 2026 to 2036
- Global Market Analysis 2021 to 2025 and Forecast 2026 to 2036, By Technology
- Introduction / Key Findings
- Historical Market Size Value (USD Million) Analysis By Technology, 2021 to 2025
- Current and Future Market Size Value (USD Million) Analysis and Forecast By Technology, 2026 to 2036
- Robotic Manipulation Technology
- Multi Axis Robotics
- 6 Axis Construction Robots
- High Precision Robotic Arms
- Hydraulic Robotics
- Heavy Load Actuation Systems
- Industrial Strength Robot Arms
- AI and Computer Vision
- Object Recognition Systems
- Material Detection AI
- Site Mapping Vision Systems
- Path Planning AI
- Autonomous Navigation Systems
- Automation Technology
- Semi Autonomous Systems
- Operator Assisted Robotics
- Remote Controlled Robots
- Fully Autonomous Systems
- Self Learning Construction Robots
- Positioning Technology
- GPS Based Systems
- RTK GPS Navigation
- Construction Site Mapping
- Laser Positioning Systems
- LIDAR Based Guidance
- Robotic Manipulation Technology
- Y to o to Y Growth Trend Analysis By Technology, 2021 to 2025
- Absolute $ Opportunity Analysis By Technology, 2026 to 2036
- Global Market Analysis 2021 to 2025 and Forecast 2026 to 2036, By Formulation
- Introduction / Key Findings
- Historical Market Size Value (USD Million) Analysis By Formulation, 2021 to 2025
- Current and Future Market Size Value (USD Million) Analysis and Forecast By Formulation, 2026 to 2036
- Robotic Systems
- Construction Robots
- Bricklaying Robots
- Demolition Robots
- Support Systems
- Control Value (USD Million)s
- Power Systems
- Integrated Construction Systems
- Automated Construction Lines
- 3D Printing Construction Systems
- Modular Building Robots
- Site Automation Systems
- Smart Site Management Systems
- Material Handling Systems
- Robotic Transport Value (USD Million)s
- Automated Loaders
- Site Logistics Robots
- Service Systems
- Maintenance Services
- Robot Calibration Services
- Repair Services
- Upgrade Services
- AI Upgrade Modules
- Robotic Systems
- Y to o to Y Growth Trend Analysis By Formulation, 2021 to 2025
- Absolute $ Opportunity Analysis By Formulation, 2026 to 2036
- Global Market Analysis 2021 to 2025 and Forecast 2026 to 2036, By Distribution Channel
- Introduction / Key Findings
- Historical Market Size Value (USD Million) Analysis By Distribution Channel, 2021 to 2025
- Current and Future Market Size Value (USD Million) Analysis and Forecast By Distribution Channel, 2026 to 2036
- Direct Sales
- OEM Supply
- Construction Robot Manufacturers
- Industrial Automation OEMs
- Project Sales
- Infrastructure Projects
- Smart City Projects
- Distributors
- Industrial Distributors
- Automation Equipment Suppliers
- Construction Equipment Dealers
- Authorized Dealers
- Local Robotics Dealers
- System Integrators
- Robotics Integrators
- Site Automation Integrators
- Engineering Solution Providers
- Aftermarket Services
- Maintenance Services
- Robot Repair Firms
- Spare Parts Suppliers
- Upgrade Services
- Software Upgrade Providers
- Direct Sales
- Y to o to Y Growth Trend Analysis By Distribution Channel, 2021 to 2025
- Absolute $ Opportunity Analysis By Distribution Channel, 2026 to 2036
- Global Market Analysis 2021 to 2025 and Forecast 2026 to 2036, By Region
- Introduction
- Historical Market Size Value (USD Million) Analysis By Region, 2021 to 2025
- Current Market Size Value (USD Million) Analysis and Forecast By Region, 2026 to 2036
- North America
- Latin America
- Western Europe
- Eastern Europe
- East Asia
- South Asia and Pacific
- Middle East & Africa
- Market Attractiveness Analysis By Region
- North America Market Analysis 2021 to 2025 and Forecast 2026 to 2036, By Country
- Historical Market Size Value (USD Million) Trend Analysis By Market Taxonomy, 2021 to 2025
- Market Size Value (USD Million) Forecast By Market Taxonomy, 2026 to 2036
- By Country
- USA
- Canada
- Mexico
- By Product
- By Application
- By End Use
- By Technology
- By Formulation
- By Distribution Channel
- By Country
- Market Attractiveness Analysis
- By Country
- By Product
- By Application
- By End Use
- By Technology
- By Formulation
- By Distribution Channel
- Key Takeaways
- Latin America Market Analysis 2021 to 2025 and Forecast 2026 to 2036, By Country
- Historical Market Size Value (USD Million) Trend Analysis By Market Taxonomy, 2021 to 2025
- Market Size Value (USD Million) Forecast By Market Taxonomy, 2026 to 2036
- By Country
- Brazil
- Chile
- Rest of Latin America
- By Product
- By Application
- By End Use
- By Technology
- By Formulation
- By Distribution Channel
- By Country
- Market Attractiveness Analysis
- By Country
- By Product
- By Application
- By End Use
- By Technology
- By Formulation
- By Distribution Channel
- Key Takeaways
- Western Europe Market Analysis 2021 to 2025 and Forecast 2026 to 2036, By Country
- Historical Market Size Value (USD Million) Trend Analysis By Market Taxonomy, 2021 to 2025
- Market Size Value (USD Million) Forecast By Market Taxonomy, 2026 to 2036
- By Country
- Germany
- UK
- Italy
- Spain
- France
- Nordic
- BENELUX
- Rest of Western Europe
- By Product
- By Application
- By End Use
- By Technology
- By Formulation
- By Distribution Channel
- By Country
- Market Attractiveness Analysis
- By Country
- By Product
- By Application
- By End Use
- By Technology
- By Formulation
- By Distribution Channel
- Key Takeaways
- Eastern Europe Market Analysis 2021 to 2025 and Forecast 2026 to 2036, By Country
- Historical Market Size Value (USD Million) Trend Analysis By Market Taxonomy, 2021 to 2025
- Market Size Value (USD Million) Forecast By Market Taxonomy, 2026 to 2036
- By Country
- Russia
- Poland
- Hungary
- Balkan & Baltic
- Rest of Eastern Europe
- By Product
- By Application
- By End Use
- By Technology
- By Formulation
- By Distribution Channel
- By Country
- Market Attractiveness Analysis
- By Country
- By Product
- By Application
- By End Use
- By Technology
- By Formulation
- By Distribution Channel
- Key Takeaways
- East Asia Market Analysis 2021 to 2025 and Forecast 2026 to 2036, By Country
- Historical Market Size Value (USD Million) Trend Analysis By Market Taxonomy, 2021 to 2025
- Market Size Value (USD Million) Forecast By Market Taxonomy, 2026 to 2036
- By Country
- China
- Japan
- South Korea
- By Product
- By Application
- By End Use
- By Technology
- By Formulation
- By Distribution Channel
- By Country
- Market Attractiveness Analysis
- By Country
- By Product
- By Application
- By End Use
- By Technology
- By Formulation
- By Distribution Channel
- Key Takeaways
- South Asia and Pacific Market Analysis 2021 to 2025 and Forecast 2026 to 2036, By Country
- Historical Market Size Value (USD Million) Trend Analysis By Market Taxonomy, 2021 to 2025
- Market Size Value (USD Million) Forecast By Market Taxonomy, 2026 to 2036
- By Country
- India
- ASEAN
- Australia & New Zealand
- Rest of South Asia and Pacific
- By Product
- By Application
- By End Use
- By Technology
- By Formulation
- By Distribution Channel
- By Country
- Market Attractiveness Analysis
- By Country
- By Product
- By Application
- By End Use
- By Technology
- By Formulation
- By Distribution Channel
- Key Takeaways
- Middle East & Africa Market Analysis 2021 to 2025 and Forecast 2026 to 2036, By Country
- Historical Market Size Value (USD Million) Trend Analysis By Market Taxonomy, 2021 to 2025
- Market Size Value (USD Million) Forecast By Market Taxonomy, 2026 to 2036
- By Country
- Kingdom of Saudi Arabia
- Other GCC Countries
- Turkiye
- South Africa
- Other African Union
- Rest of Middle East & Africa
- By Product
- By Application
- By End Use
- By Technology
- By Formulation
- By Distribution Channel
- By Country
- Market Attractiveness Analysis
- By Country
- By Product
- By Application
- By End Use
- By Technology
- By Formulation
- By Distribution Channel
- Key Takeaways
- Key Countries Market Analysis
- USA
- Pricing Analysis
- Market Share Analysis, 2025
- By Product
- By Application
- By End Use
- By Technology
- By Formulation
- By Distribution Channel
- Canada
- Pricing Analysis
- Market Share Analysis, 2025
- By Product
- By Application
- By End Use
- By Technology
- By Formulation
- By Distribution Channel
- Mexico
- Pricing Analysis
- Market Share Analysis, 2025
- By Product
- By Application
- By End Use
- By Technology
- By Formulation
- By Distribution Channel
- Brazil
- Pricing Analysis
- Market Share Analysis, 2025
- By Product
- By Application
- By End Use
- By Technology
- By Formulation
- By Distribution Channel
- Chile
- Pricing Analysis
- Market Share Analysis, 2025
- By Product
- By Application
- By End Use
- By Technology
- By Formulation
- By Distribution Channel
- Germany
- Pricing Analysis
- Market Share Analysis, 2025
- By Product
- By Application
- By End Use
- By Technology
- By Formulation
- By Distribution Channel
- UK
- Pricing Analysis
- Market Share Analysis, 2025
- By Product
- By Application
- By End Use
- By Technology
- By Formulation
- By Distribution Channel
- Italy
- Pricing Analysis
- Market Share Analysis, 2025
- By Product
- By Application
- By End Use
- By Technology
- By Formulation
- By Distribution Channel
- Spain
- Pricing Analysis
- Market Share Analysis, 2025
- By Product
- By Application
- By End Use
- By Technology
- By Formulation
- By Distribution Channel
- France
- Pricing Analysis
- Market Share Analysis, 2025
- By Product
- By Application
- By End Use
- By Technology
- By Formulation
- By Distribution Channel
- India
- Pricing Analysis
- Market Share Analysis, 2025
- By Product
- By Application
- By End Use
- By Technology
- By Formulation
- By Distribution Channel
- ASEAN
- Pricing Analysis
- Market Share Analysis, 2025
- By Product
- By Application
- By End Use
- By Technology
- By Formulation
- By Distribution Channel
- Australia & New Zealand
- Pricing Analysis
- Market Share Analysis, 2025
- By Product
- By Application
- By End Use
- By Technology
- By Formulation
- By Distribution Channel
- China
- Pricing Analysis
- Market Share Analysis, 2025
- By Product
- By Application
- By End Use
- By Technology
- By Formulation
- By Distribution Channel
- Japan
- Pricing Analysis
- Market Share Analysis, 2025
- By Product
- By Application
- By End Use
- By Technology
- By Formulation
- By Distribution Channel
- South Korea
- Pricing Analysis
- Market Share Analysis, 2025
- By Product
- By Application
- By End Use
- By Technology
- By Formulation
- By Distribution Channel
- Russia
- Pricing Analysis
- Market Share Analysis, 2025
- By Product
- By Application
- By End Use
- By Technology
- By Formulation
- By Distribution Channel
- Poland
- Pricing Analysis
- Market Share Analysis, 2025
- By Product
- By Application
- By End Use
- By Technology
- By Formulation
- By Distribution Channel
- Hungary
- Pricing Analysis
- Market Share Analysis, 2025
- By Product
- By Application
- By End Use
- By Technology
- By Formulation
- By Distribution Channel
- Kingdom of Saudi Arabia
- Pricing Analysis
- Market Share Analysis, 2025
- By Product
- By Application
- By End Use
- By Technology
- By Formulation
- By Distribution Channel
- Turkiye
- Pricing Analysis
- Market Share Analysis, 2025
- By Product
- By Application
- By End Use
- By Technology
- By Formulation
- By Distribution Channel
- South Africa
- Pricing Analysis
- Market Share Analysis, 2025
- By Product
- By Application
- By End Use
- By Technology
- By Formulation
- By Distribution Channel
- USA
- Market Structure Analysis
- Competition Dashboard
- Competition Benchmarking
- Market Share Analysis of Top Players
- By Regional
- By Product
- By Application
- By End Use
- By Technology
- By Formulation
- By Distribution Channel
- Competition Analysis
- Competition Deep Dive
- Komatsu
- Overview
- Product Portfolio
- Profitability by Market Segments (Product/Age /Sales Channel/Region)
- Sales Footprint
- Strategy Overview
- Marketing Strategy
- Product Strategy
- Channel Strategy
- Caterpillar
- Doosan Robotics
- Hyundai CE
- Built Robotics
- Trimble
- DJI
- Leica Geosystems
- Hilti
- Brokk
- Boston Dynamics
- ABB
- Volvo CE
- Husqvarna
- SANY
- Komatsu
- Competition Deep Dive
- Assumptions & Acronyms Used
List Of Table
- Table 1: Global Market Value (USD Million) Forecast by Region, 2021 to 2036
- Table 2: Global Market Value (USD Million) Forecast by Product, 2021 to 2036
- Table 3: Global Market Value (USD Million) Forecast by Application, 2021 to 2036
- Table 4: Global Market Value (USD Million) Forecast by End Use, 2021 to 2036
- Table 5: Global Market Value (USD Million) Forecast by Technology, 2021 to 2036
- Table 6: Global Market Value (USD Million) Forecast by Formulation, 2021 to 2036
- Table 7: Global Market Value (USD Million) Forecast by Distribution Channel, 2021 to 2036
- Table 8: North America Market Value (USD Million) Forecast by Country, 2021 to 2036
- Table 9: North America Market Value (USD Million) Forecast by Product, 2021 to 2036
- Table 10: North America Market Value (USD Million) Forecast by Application, 2021 to 2036
- Table 11: North America Market Value (USD Million) Forecast by End Use, 2021 to 2036
- Table 12: North America Market Value (USD Million) Forecast by Technology, 2021 to 2036
- Table 13: North America Market Value (USD Million) Forecast by Formulation, 2021 to 2036
- Table 14: North America Market Value (USD Million) Forecast by Distribution Channel, 2021 to 2036
- Table 15: Latin America Market Value (USD Million) Forecast by Country, 2021 to 2036
- Table 16: Latin America Market Value (USD Million) Forecast by Product, 2021 to 2036
- Table 17: Latin America Market Value (USD Million) Forecast by Application, 2021 to 2036
- Table 18: Latin America Market Value (USD Million) Forecast by End Use, 2021 to 2036
- Table 19: Latin America Market Value (USD Million) Forecast by Technology, 2021 to 2036
- Table 20: Latin America Market Value (USD Million) Forecast by Formulation, 2021 to 2036
- Table 21: Latin America Market Value (USD Million) Forecast by Distribution Channel, 2021 to 2036
- Table 22: Western Europe Market Value (USD Million) Forecast by Country, 2021 to 2036
- Table 23: Western Europe Market Value (USD Million) Forecast by Product, 2021 to 2036
- Table 24: Western Europe Market Value (USD Million) Forecast by Application, 2021 to 2036
- Table 25: Western Europe Market Value (USD Million) Forecast by End Use, 2021 to 2036
- Table 26: Western Europe Market Value (USD Million) Forecast by Technology, 2021 to 2036
- Table 27: Western Europe Market Value (USD Million) Forecast by Formulation, 2021 to 2036
- Table 28: Western Europe Market Value (USD Million) Forecast by Distribution Channel, 2021 to 2036
- Table 29: Eastern Europe Market Value (USD Million) Forecast by Country, 2021 to 2036
- Table 30: Eastern Europe Market Value (USD Million) Forecast by Product, 2021 to 2036
- Table 31: Eastern Europe Market Value (USD Million) Forecast by Application, 2021 to 2036
- Table 32: Eastern Europe Market Value (USD Million) Forecast by End Use, 2021 to 2036
- Table 33: Eastern Europe Market Value (USD Million) Forecast by Technology, 2021 to 2036
- Table 34: Eastern Europe Market Value (USD Million) Forecast by Formulation, 2021 to 2036
- Table 35: Eastern Europe Market Value (USD Million) Forecast by Distribution Channel, 2021 to 2036
- Table 36: East Asia Market Value (USD Million) Forecast by Country, 2021 to 2036
- Table 37: East Asia Market Value (USD Million) Forecast by Product, 2021 to 2036
- Table 38: East Asia Market Value (USD Million) Forecast by Application, 2021 to 2036
- Table 39: East Asia Market Value (USD Million) Forecast by End Use, 2021 to 2036
- Table 40: East Asia Market Value (USD Million) Forecast by Technology, 2021 to 2036
- Table 41: East Asia Market Value (USD Million) Forecast by Formulation, 2021 to 2036
- Table 42: East Asia Market Value (USD Million) Forecast by Distribution Channel, 2021 to 2036
- Table 43: South Asia and Pacific Market Value (USD Million) Forecast by Country, 2021 to 2036
- Table 44: South Asia and Pacific Market Value (USD Million) Forecast by Product, 2021 to 2036
- Table 45: South Asia and Pacific Market Value (USD Million) Forecast by Application, 2021 to 2036
- Table 46: South Asia and Pacific Market Value (USD Million) Forecast by End Use, 2021 to 2036
- Table 47: South Asia and Pacific Market Value (USD Million) Forecast by Technology, 2021 to 2036
- Table 48: South Asia and Pacific Market Value (USD Million) Forecast by Formulation, 2021 to 2036
- Table 49: South Asia and Pacific Market Value (USD Million) Forecast by Distribution Channel, 2021 to 2036
- Table 50: Middle East & Africa Market Value (USD Million) Forecast by Country, 2021 to 2036
- Table 51: Middle East & Africa Market Value (USD Million) Forecast by Product, 2021 to 2036
- Table 52: Middle East & Africa Market Value (USD Million) Forecast by Application, 2021 to 2036
- Table 53: Middle East & Africa Market Value (USD Million) Forecast by End Use, 2021 to 2036
- Table 54: Middle East & Africa Market Value (USD Million) Forecast by Technology, 2021 to 2036
- Table 55: Middle East & Africa Market Value (USD Million) Forecast by Formulation, 2021 to 2036
- Table 56: Middle East & Africa Market Value (USD Million) Forecast by Distribution Channel, 2021 to 2036
List Of Figures
- Figure 1: Global Market Pricing Analysis
- Figure 2: Global Market Value (USD Million) Forecast 2021 to 2036
- Figure 3: Global Market Value Share and BPS Analysis by Product, 2026 and 2036
- Figure 4: Global Market Y-o-Y Growth Comparison by Product, 2026 to 2036
- Figure 5: Global Market Attractiveness Analysis by Product
- Figure 6: Global Market Value Share and BPS Analysis by Application, 2026 and 2036
- Figure 7: Global Market Y-o-Y Growth Comparison by Application, 2026 to 2036
- Figure 8: Global Market Attractiveness Analysis by Application
- Figure 9: Global Market Value Share and BPS Analysis by End Use, 2026 and 2036
- Figure 10: Global Market Y-o-Y Growth Comparison by End Use, 2026 to 2036
- Figure 11: Global Market Attractiveness Analysis by End Use
- Figure 12: Global Market Value Share and BPS Analysis by Technology, 2026 and 2036
- Figure 13: Global Market Y-o-Y Growth Comparison by Technology, 2026 to 2036
- Figure 14: Global Market Attractiveness Analysis by Technology
- Figure 15: Global Market Value Share and BPS Analysis by Formulation, 2026 and 2036
- Figure 16: Global Market Y-o-Y Growth Comparison by Formulation, 2026 to 2036
- Figure 17: Global Market Attractiveness Analysis by Formulation
- Figure 18: Global Market Value Share and BPS Analysis by Distribution Channel, 2026 and 2036
- Figure 19: Global Market Y-o-Y Growth Comparison by Distribution Channel, 2026 to 2036
- Figure 20: Global Market Attractiveness Analysis by Distribution Channel
- Figure 21: Global Market Value (USD Million) Share and BPS Analysis by Region, 2026 and 2036
- Figure 22: Global Market Y-o-Y Growth Comparison by Region, 2026 to 2036
- Figure 23: Global Market Attractiveness Analysis by Region
- Figure 24: North America Market Incremental Dollar Opportunity, 2026 to 2036
- Figure 25: Latin America Market Incremental Dollar Opportunity, 2026 to 2036
- Figure 26: Western Europe Market Incremental Dollar Opportunity, 2026 to 2036
- Figure 27: Eastern Europe Market Incremental Dollar Opportunity, 2026 to 2036
- Figure 28: East Asia Market Incremental Dollar Opportunity, 2026 to 2036
- Figure 29: South Asia and Pacific Market Incremental Dollar Opportunity, 2026 to 2036
- Figure 30: Middle East & Africa Market Incremental Dollar Opportunity, 2026 to 2036
- Figure 31: North America Market Value Share and BPS Analysis by Country, 2026 and 2036
- Figure 32: North America Market Value Share and BPS Analysis by Product, 2026 and 2036
- Figure 33: North America Market Y-o-Y Growth Comparison by Product, 2026 to 2036
- Figure 34: North America Market Attractiveness Analysis by Product
- Figure 35: North America Market Value Share and BPS Analysis by Application, 2026 and 2036
- Figure 36: North America Market Y-o-Y Growth Comparison by Application, 2026 to 2036
- Figure 37: North America Market Attractiveness Analysis by Application
- Figure 38: North America Market Value Share and BPS Analysis by End Use, 2026 and 2036
- Figure 39: North America Market Y-o-Y Growth Comparison by End Use, 2026 to 2036
- Figure 40: North America Market Attractiveness Analysis by End Use
- Figure 41: North America Market Value Share and BPS Analysis by Technology, 2026 and 2036
- Figure 42: North America Market Y-o-Y Growth Comparison by Technology, 2026 to 2036
- Figure 43: North America Market Attractiveness Analysis by Technology
- Figure 44: North America Market Value Share and BPS Analysis by Formulation, 2026 and 2036
- Figure 45: North America Market Y-o-Y Growth Comparison by Formulation, 2026 to 2036
- Figure 46: North America Market Attractiveness Analysis by Formulation
- Figure 47: North America Market Value Share and BPS Analysis by Distribution Channel, 2026 and 2036
- Figure 48: North America Market Y-o-Y Growth Comparison by Distribution Channel, 2026 to 2036
- Figure 49: North America Market Attractiveness Analysis by Distribution Channel
- Figure 50: Latin America Market Value Share and BPS Analysis by Country, 2026 and 2036
- Figure 51: Latin America Market Value Share and BPS Analysis by Product, 2026 and 2036
- Figure 52: Latin America Market Y-o-Y Growth Comparison by Product, 2026 to 2036
- Figure 53: Latin America Market Attractiveness Analysis by Product
- Figure 54: Latin America Market Value Share and BPS Analysis by Application, 2026 and 2036
- Figure 55: Latin America Market Y-o-Y Growth Comparison by Application, 2026 to 2036
- Figure 56: Latin America Market Attractiveness Analysis by Application
- Figure 57: Latin America Market Value Share and BPS Analysis by End Use, 2026 and 2036
- Figure 58: Latin America Market Y-o-Y Growth Comparison by End Use, 2026 to 2036
- Figure 59: Latin America Market Attractiveness Analysis by End Use
- Figure 60: Latin America Market Value Share and BPS Analysis by Technology, 2026 and 2036
- Figure 61: Latin America Market Y-o-Y Growth Comparison by Technology, 2026 to 2036
- Figure 62: Latin America Market Attractiveness Analysis by Technology
- Figure 63: Latin America Market Value Share and BPS Analysis by Formulation, 2026 and 2036
- Figure 64: Latin America Market Y-o-Y Growth Comparison by Formulation, 2026 to 2036
- Figure 65: Latin America Market Attractiveness Analysis by Formulation
- Figure 66: Latin America Market Value Share and BPS Analysis by Distribution Channel, 2026 and 2036
- Figure 67: Latin America Market Y-o-Y Growth Comparison by Distribution Channel, 2026 to 2036
- Figure 68: Latin America Market Attractiveness Analysis by Distribution Channel
- Figure 69: Western Europe Market Value Share and BPS Analysis by Country, 2026 and 2036
- Figure 70: Western Europe Market Value Share and BPS Analysis by Product, 2026 and 2036
- Figure 71: Western Europe Market Y-o-Y Growth Comparison by Product, 2026 to 2036
- Figure 72: Western Europe Market Attractiveness Analysis by Product
- Figure 73: Western Europe Market Value Share and BPS Analysis by Application, 2026 and 2036
- Figure 74: Western Europe Market Y-o-Y Growth Comparison by Application, 2026 to 2036
- Figure 75: Western Europe Market Attractiveness Analysis by Application
- Figure 76: Western Europe Market Value Share and BPS Analysis by End Use, 2026 and 2036
- Figure 77: Western Europe Market Y-o-Y Growth Comparison by End Use, 2026 to 2036
- Figure 78: Western Europe Market Attractiveness Analysis by End Use
- Figure 79: Western Europe Market Value Share and BPS Analysis by Technology, 2026 and 2036
- Figure 80: Western Europe Market Y-o-Y Growth Comparison by Technology, 2026 to 2036
- Figure 81: Western Europe Market Attractiveness Analysis by Technology
- Figure 82: Western Europe Market Value Share and BPS Analysis by Formulation, 2026 and 2036
- Figure 83: Western Europe Market Y-o-Y Growth Comparison by Formulation, 2026 to 2036
- Figure 84: Western Europe Market Attractiveness Analysis by Formulation
- Figure 85: Western Europe Market Value Share and BPS Analysis by Distribution Channel, 2026 and 2036
- Figure 86: Western Europe Market Y-o-Y Growth Comparison by Distribution Channel, 2026 to 2036
- Figure 87: Western Europe Market Attractiveness Analysis by Distribution Channel
- Figure 88: Eastern Europe Market Value Share and BPS Analysis by Country, 2026 and 2036
- Figure 89: Eastern Europe Market Value Share and BPS Analysis by Product, 2026 and 2036
- Figure 90: Eastern Europe Market Y-o-Y Growth Comparison by Product, 2026 to 2036
- Figure 91: Eastern Europe Market Attractiveness Analysis by Product
- Figure 92: Eastern Europe Market Value Share and BPS Analysis by Application, 2026 and 2036
- Figure 93: Eastern Europe Market Y-o-Y Growth Comparison by Application, 2026 to 2036
- Figure 94: Eastern Europe Market Attractiveness Analysis by Application
- Figure 95: Eastern Europe Market Value Share and BPS Analysis by End Use, 2026 and 2036
- Figure 96: Eastern Europe Market Y-o-Y Growth Comparison by End Use, 2026 to 2036
- Figure 97: Eastern Europe Market Attractiveness Analysis by End Use
- Figure 98: Eastern Europe Market Value Share and BPS Analysis by Technology, 2026 and 2036
- Figure 99: Eastern Europe Market Y-o-Y Growth Comparison by Technology, 2026 to 2036
- Figure 100: Eastern Europe Market Attractiveness Analysis by Technology
- Figure 101: Eastern Europe Market Value Share and BPS Analysis by Formulation, 2026 and 2036
- Figure 102: Eastern Europe Market Y-o-Y Growth Comparison by Formulation, 2026 to 2036
- Figure 103: Eastern Europe Market Attractiveness Analysis by Formulation
- Figure 104: Eastern Europe Market Value Share and BPS Analysis by Distribution Channel, 2026 and 2036
- Figure 105: Eastern Europe Market Y-o-Y Growth Comparison by Distribution Channel, 2026 to 2036
- Figure 106: Eastern Europe Market Attractiveness Analysis by Distribution Channel
- Figure 107: East Asia Market Value Share and BPS Analysis by Country, 2026 and 2036
- Figure 108: East Asia Market Value Share and BPS Analysis by Product, 2026 and 2036
- Figure 109: East Asia Market Y-o-Y Growth Comparison by Product, 2026 to 2036
- Figure 110: East Asia Market Attractiveness Analysis by Product
- Figure 111: East Asia Market Value Share and BPS Analysis by Application, 2026 and 2036
- Figure 112: East Asia Market Y-o-Y Growth Comparison by Application, 2026 to 2036
- Figure 113: East Asia Market Attractiveness Analysis by Application
- Figure 114: East Asia Market Value Share and BPS Analysis by End Use, 2026 and 2036
- Figure 115: East Asia Market Y-o-Y Growth Comparison by End Use, 2026 to 2036
- Figure 116: East Asia Market Attractiveness Analysis by End Use
- Figure 117: East Asia Market Value Share and BPS Analysis by Technology, 2026 and 2036
- Figure 118: East Asia Market Y-o-Y Growth Comparison by Technology, 2026 to 2036
- Figure 119: East Asia Market Attractiveness Analysis by Technology
- Figure 120: East Asia Market Value Share and BPS Analysis by Formulation, 2026 and 2036
- Figure 121: East Asia Market Y-o-Y Growth Comparison by Formulation, 2026 to 2036
- Figure 122: East Asia Market Attractiveness Analysis by Formulation
- Figure 123: East Asia Market Value Share and BPS Analysis by Distribution Channel, 2026 and 2036
- Figure 124: East Asia Market Y-o-Y Growth Comparison by Distribution Channel, 2026 to 2036
- Figure 125: East Asia Market Attractiveness Analysis by Distribution Channel
- Figure 126: South Asia and Pacific Market Value Share and BPS Analysis by Country, 2026 and 2036
- Figure 127: South Asia and Pacific Market Value Share and BPS Analysis by Product, 2026 and 2036
- Figure 128: South Asia and Pacific Market Y-o-Y Growth Comparison by Product, 2026 to 2036
- Figure 129: South Asia and Pacific Market Attractiveness Analysis by Product
- Figure 130: South Asia and Pacific Market Value Share and BPS Analysis by Application, 2026 and 2036
- Figure 131: South Asia and Pacific Market Y-o-Y Growth Comparison by Application, 2026 to 2036
- Figure 132: South Asia and Pacific Market Attractiveness Analysis by Application
- Figure 133: South Asia and Pacific Market Value Share and BPS Analysis by End Use, 2026 and 2036
- Figure 134: South Asia and Pacific Market Y-o-Y Growth Comparison by End Use, 2026 to 2036
- Figure 135: South Asia and Pacific Market Attractiveness Analysis by End Use
- Figure 136: South Asia and Pacific Market Value Share and BPS Analysis by Technology, 2026 and 2036
- Figure 137: South Asia and Pacific Market Y-o-Y Growth Comparison by Technology, 2026 to 2036
- Figure 138: South Asia and Pacific Market Attractiveness Analysis by Technology
- Figure 139: South Asia and Pacific Market Value Share and BPS Analysis by Formulation, 2026 and 2036
- Figure 140: South Asia and Pacific Market Y-o-Y Growth Comparison by Formulation, 2026 to 2036
- Figure 141: South Asia and Pacific Market Attractiveness Analysis by Formulation
- Figure 142: South Asia and Pacific Market Value Share and BPS Analysis by Distribution Channel, 2026 and 2036
- Figure 143: South Asia and Pacific Market Y-o-Y Growth Comparison by Distribution Channel, 2026 to 2036
- Figure 144: South Asia and Pacific Market Attractiveness Analysis by Distribution Channel
- Figure 145: Middle East & Africa Market Value Share and BPS Analysis by Country, 2026 and 2036
- Figure 146: Middle East & Africa Market Value Share and BPS Analysis by Product, 2026 and 2036
- Figure 147: Middle East & Africa Market Y-o-Y Growth Comparison by Product, 2026 to 2036
- Figure 148: Middle East & Africa Market Attractiveness Analysis by Product
- Figure 149: Middle East & Africa Market Value Share and BPS Analysis by Application, 2026 and 2036
- Figure 150: Middle East & Africa Market Y-o-Y Growth Comparison by Application, 2026 to 2036
- Figure 151: Middle East & Africa Market Attractiveness Analysis by Application
- Figure 152: Middle East & Africa Market Value Share and BPS Analysis by End Use, 2026 and 2036
- Figure 153: Middle East & Africa Market Y-o-Y Growth Comparison by End Use, 2026 to 2036
- Figure 154: Middle East & Africa Market Attractiveness Analysis by End Use
- Figure 155: Middle East & Africa Market Value Share and BPS Analysis by Technology, 2026 and 2036
- Figure 156: Middle East & Africa Market Y-o-Y Growth Comparison by Technology, 2026 to 2036
- Figure 157: Middle East & Africa Market Attractiveness Analysis by Technology
- Figure 158: Middle East & Africa Market Value Share and BPS Analysis by Formulation, 2026 and 2036
- Figure 159: Middle East & Africa Market Y-o-Y Growth Comparison by Formulation, 2026 to 2036
- Figure 160: Middle East & Africa Market Attractiveness Analysis by Formulation
- Figure 161: Middle East & Africa Market Value Share and BPS Analysis by Distribution Channel, 2026 and 2036
- Figure 162: Middle East & Africa Market Y-o-Y Growth Comparison by Distribution Channel, 2026 to 2036
- Figure 163: Middle East & Africa Market Attractiveness Analysis by Distribution Channel
- Figure 164: Global Market - Tier Structure Analysis
- Figure 165: Global Market - Company Share Analysis
