Construction Lasers Market Size, Share, Growth and Forecast (2026 - 2036)
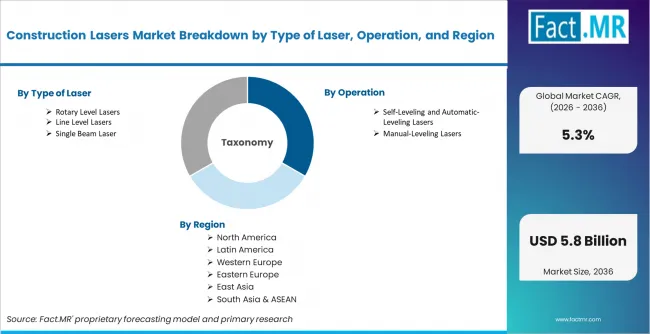
The Construction Lasers Market is segmented by Type of Laser (Spot/Plumb/Dot Lasers, Line Level Lasers, Single Beam Laser, Multi-Beam Lasers, Rotary Level Lasers, Combination Lasers, and Others), Operation (Manual-Leveling Lasers and Self-Leveling and Automatic-Leveling Lasers), Range (Up to 25 Meters, 25 Meters to 50 Meters, 50 Meters to 100 Meters, 100 Meters to 150 Meters, 150 Meters to 200 Meters, and Above 200 Meters), Application (Indoor and Outdoor), End User (Residential Construction, Commercial Construction, Industrial Construction, and Infrastructure and Civil Engineering) and Region. Forecast for 2026 to 2036.
FACT.MR states that the construction lasers market shifting toward precision-focused systems. Self-leveling rotary and green-beam lasers are replacing manual alignment tools across infrastructure and commercial construction projects. Rising accuracy requirements and higher labor costs support adoption.
Construction Lasers Market Forecast and Outlook By Fact.MR
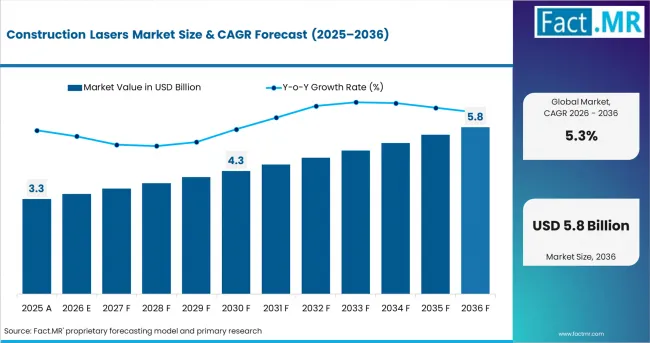
- In 2025, the construction lasers market was valued at USD 3.3 billion.
- Based on Fact.MR analysis, demand for construction lasers is estimated to grow to USD 3.4 billion in 2026 and USD 5.8 billion by 2036.
- FACT.MR projects a CAGR of 5.3% during the forecast period.
- The market is projected to add USD 2.4 billion in incremental revenue through 2036.
- Growth is supported by infrastructure investment under government development programs.
- Adoption of automated leveling systems increases across commercial and civil engineering projects.
- Replacement demand from BIM integration and digital site workflows support consistent equipment spending among professional contractors.
Summary construction lasers market
- Market Definition
- The market covers precision laser instruments used for leveling, grading, alignment, and layout applications across building, infrastructure, industrial, and civil engineering construction projects worldwide.
- Demand Drivers
- Infrastructure project managers and civil engineering contractors are adopting self-leveling rotary lasers as government-funded construction programs in the United States, China, and Japan require higher site accuracy and reduced rework on public works contracts.
- Site engineers at commercial building and industrial facility projects are transitioning from manual optical instruments to automatic-leveling laser systems as labor shortages and tight project timelines increase pressure on measurement efficiency.
- Equipment rental operators and capital project managers are investing in green-beam laser systems as improved outdoor visibility and longer working range reduce setup time and extend daily productivity on large civil infrastructure sites.
- Key Segments Analyzed
- By Type of Laser: Self-leveling rotary level lasers are expected to hold nearly 31.4% share in 2026 as grading, excavation, and large-scale alignment activities increase across civil engineering projects.
- By Operation: Self-leveling and automatic-leveling lasers are projected to account for 75% share in 2026 as contractors shift from manual systems to reduce setup time and improve operational accuracy.
- By Range: The 50 meters to 100 meters’ segment is expected to hold 30% share in 2026 as mid-range working distances remain suitable for standard building and civil engineering applications.
- By Application: Outdoor applications are forecast to account for 58% share in 2026 due to rising deployment across road construction and elevation measurement projects.
- By End User: Infrastructure and civil engineering projects represent 40% share in 2026 as road and earthmoving activities generate demand for precision laser systems.
- By Geography: China is projected to expand at 6.3% CAGR through 2036 supported by urban infrastructure investment and smart city development programs.
- Analyst Opinion at FACT.MR
- Shambhu Nath Jha, Principal Consultant at Fact.MR, opines, ‘CXOs will observe widening separation between suppliers offering digital connectivity and BIM-compatible workflows and manufacturers focused on standalone laser hardware. Contractors engaged in government-funded infrastructure projects are prioritizing instruments with remote monitoring and machine control integration.’
- Strategic Implications
- Construction laser manufacturers should accelerate development of Bluetooth-enabled and app-connected rotary systems to support BIM workflow integration across infrastructure and commercial construction projects.
- Expansion through construction equipment rental networks in China, Japan, and the United States can improve access to high-volume project demand without dependence on direct equipment sales to smaller contractors.
- Investment in green-beam laser systems and working ranges above 200 meters can support demand from highway and large-scale civil engineering applications operating in high ambient light conditions.
- Methodology
- Market sizing is based on construction laser unit sales benchmarks and equipment spending analysis validated against 2024 and 2025 revenue disclosures from Leica Geosystems, Trimble Inc. and Topcon Corporation
- The study incorporates construction spending data from the U.S. Census Bureau along with infrastructure investment disclosures from Japan MLIT and the Federal Ministry for Digital and Transport Germany covering 2024 and 2025.
- Forecast analysis is supported by infrastructure spending activity, commercial construction starts, and primary interviews with site engineers and equipment managers across major regional markets.
| Metric | Value |
|---|---|
| Estimated Value in 2026 | USD 3.4 billion |
| Forecast Value in 2036 | USD 5.8 billion |
| Forecast CAGR (2026 to 2036) | 5.3% |
Japan is projected to expand at 5.8% CAGR through 2036 as the Ministry of Land, Infrastructure, Transport and Tourism advances its I-Construction program across public infrastructure projects. Germany is forecast to grow at 5.1% CAGR due to BIM adoption mandates under the Federal Ministry for Digital and Transport. China is expected to register 6.3% CAGR supported by urban infrastructure investment and smart city construction activity. The United States is projected to expand at 4.4% CAGR driven by Infrastructure Investment and Jobs Act-funded construction activity and higher adoption of machine control laser systems. The United Kingdom is forecast to record 4.0% CAGR as commercial construction activity and building safety compliance requirements support equipment demand.
Segmental Analysis
Construction Lasers Market Analysis by Type of Laser
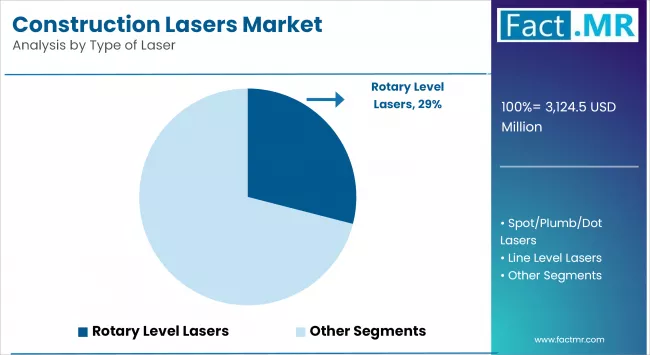
Based on FACT.MR's construction lasers market report, self-leveling rotary level lasers are estimated to hold nearly 31.4% share in 2026. These instruments cover grading and large-scale alignment tasks that form a core part of civil infrastructure and commercial building projects.
- Leica Geosystems Product Expansion: Leica Geosystems, part of Hexagon, launched the iCON trades construction layout solution in September 2024, adding AI-enabled target tracking and precision layout workflows for site engineers. The system extends digital construction layout capabilities into interior finishing and complex alignment applications. [1]
- Topcon FARO Alliance: Topcon Corporation and FARO Technologies announced a strategic agreement in February 2025 to integrate laser scanning technologies for construction and surveying workflows. The collaboration expands combined access to rotary laser and 3D scanning system distribution across infrastructure project markets. [2]
- Green-Beam Adoption: Green-beam rotary lasers are gaining share in outdoor construction due to significantly higher beam visibility than red-beam systems under high-ambient-light conditions.
Construction Lasers Market Analysis by Operation
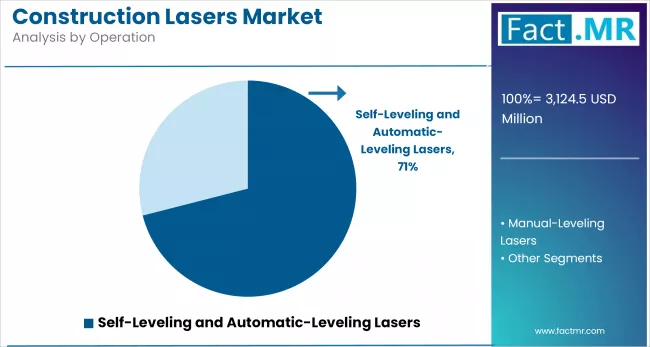
Self-leveling and automatic-leveling lasers are projected to account for 75% share in 2026. Automatic-leveling systems eliminate manual adjustment steps and reduce setup time on active construction sites.
- Labor Efficiency Pressure: Construction firms are replacing manual-leveling instruments with automatic-leveling systems. Labor shortages across the United States and Europe increase demand for simplified site operations.
- Rental Fleet Modernization: Equipment rental companies are replacing manual laser inventories with self-leveling systems. Contractors increasingly prefer ready-to-use instruments for faster deployment.
- Hilti Product Development: Hilti's PR 40-22 rotary laser series features Nuron battery platform integration, enabling single-battery compatibility across construction site power tools. The system supports automatic leveling across exterior construction and large-scale alignment applications. [5]
Construction Lasers Market Analysis by Range
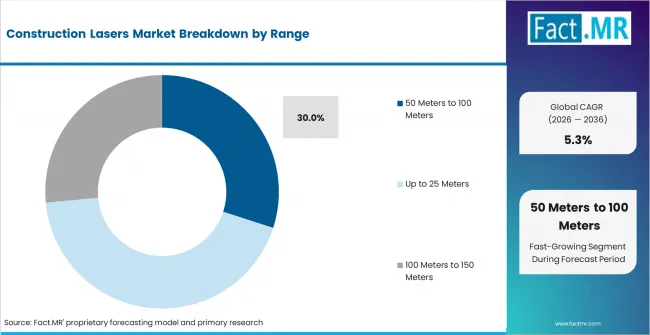
The 50 Meters to 100 Meters range segment is expected to hold 30% share in 2026. This range matches standard civil engineering and commercial construction site dimensions. Rotary level lasers within this range are widely used for grading and structural alignment.
- Mid-Range Instrument Demand: Commercial and residential contractors prefer 50 to 100-meter laser systems for framing and foundation work across standard construction sites.
- Infrastructure Range Requirements: Civil engineering contractors increasingly use 100 to 200-meter laser systems for road grading and utility installation projects under government infrastructure programs.
- Above 200 Meter Segment Growth: Long-range rotary lasers above 200 meters are gaining adoption across highway and earthmoving projects. Large-scale infrastructure activity in the United States supports demand for extended-range precision instruments.
Construction Lasers Market Analysis by Application
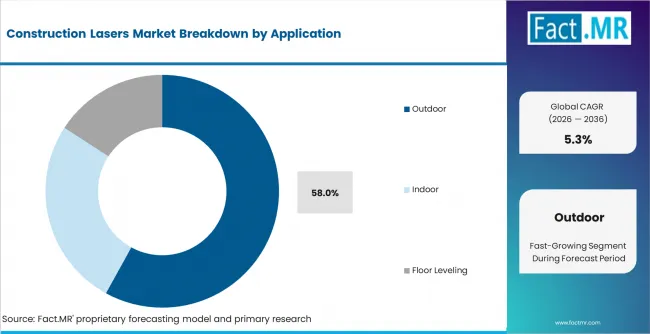
Outdoor applications are forecast to account for 58% share in 2026. Road construction and site grading generate significant construction laser demand. Elevation measurement and utility installation add further outdoor use.
- Outdoor Site Layout Demand: Infrastructure and surveying projects continue to increase demand for rotary laser systems across road and utility construction activities.
- Indoor Application Stability: Interior construction activities maintain steady demand for line lasers and multi-beam systems used for leveling and framing applications.
- Distance Measuring Expansion: Adoption of laser distance meters is increasing among contractors and building design professionals focused on digital measurement accuracy.
Construction Lasers Market Analysis by End User
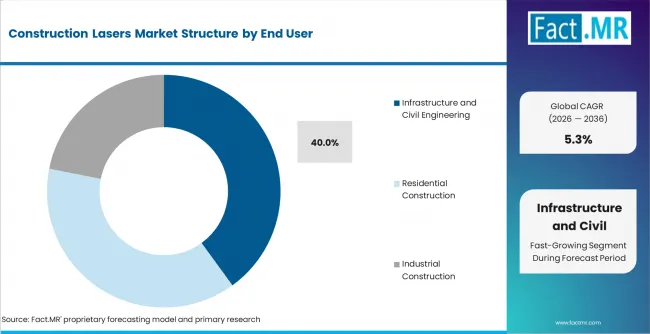
Infrastructure and civil engineering projects represent 40% share in 2026. Road construction, bridge development and earthmoving operations supports strong demand for precision laser systems.
- Civil Engineering Contract Demand: Infrastructure contractors increasingly deploy rotary and pipe laser systems for grading and alignment applications across public construction projects.
- Commercial Construction Activity: Commercial contractors use self-leveling and multi-beam lasers for framing and partition alignment across office and retail developments.
- Industrial Facility Requirements: Industrial construction projects generate demand for rotary and combination laser systems across warehouse and energy facility construction.
Drivers, Restraints, and Opportunities
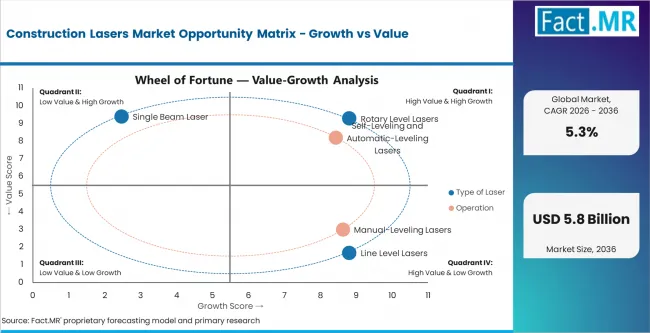
FACT.MR analysts observe steady growth in the construction lasers market due to infrastructure investment and increasing automation across construction activities. Government spending on roads, bridges, and public infrastructure expand the base of active projects requiring precision measurement tools.
Green-beam and Bluetooth-enabled systems are replacing standard red-beam laser products across commercial and infrastructure projects. Higher equipment costs limit adoption among smaller contractors.
- Infrastructure Investment Programs: Government infrastructure spending remains a major demand driver for construction laser systems across transportation and public development projects.
- BIM and Digital Workflow Adoption: BIM integration requirements are increasing demand for laser systems compatible with digital construction documentation and workflow platforms.
- I-Construction Program in Japan: Digital construction initiatives in Japan support procurement of advanced land survey equipment systems, including laser surveying and measurement equipment, across public infrastructure projects..
Regional Analysis
.webp)
The construction lasers market is assessed across North America, Europe, Asia Pacific, Latin America, and Middle East and Africa covering 40+ countries segmented by infrastructure investment activity, construction digitalization standards, equipment replacement cycles, and regulatory requirements. The full report offers market attractiveness analysis by region and country.
| Country | CAGR (2026 to 2036) |
|---|---|
| China | 6.3% |
| Japan | 5.8% |
| India | 5.6% |
| Germany | 5.1% |
| United States | 4.4% |
| United Kingdom | 4.0% |
Source: Fact.MR (FACT.MR) analysis, based on proprietary forecasting model and primary research
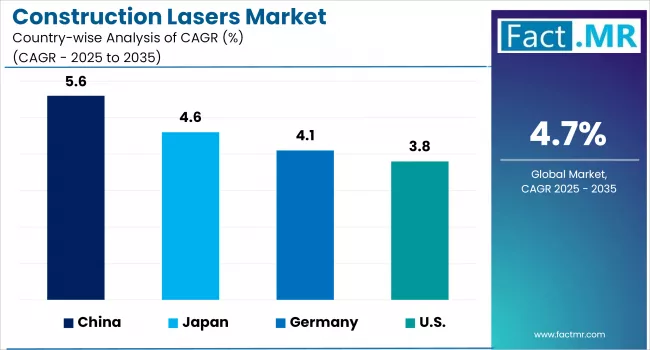
Asia Pacific Construction Lasers Market Analysis
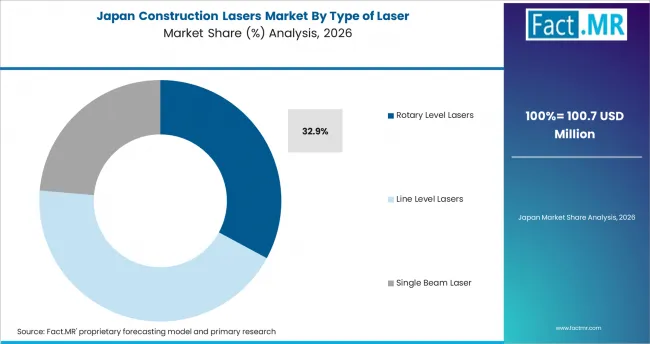
Asia Pacific is the fastest-growing regional market for construction lasers due to large-scale government infrastructure investment and rising construction digitalization programs. Civil engineering project volumes in China, Japan, and emerging Southeast Asian markets are generating sustained instrument across rotary laser and machine control categories.
- China: Demand for construction lasers in China is projected to expand at 6.3% CAGR through 2036. Urban infrastructure investment and smart city programs generate large-scale civil engineering activity. Contractors are increasing deployment of precision leveling and alignment systems across transportation and commercial construction projects. Expansion of automated surveying and digital construction workflows is further supporting equipment demand.
- Japan: The construction lasers market in Japan is projected to grow at 5.8% CAGR from 2026 to 2036. The I-Construction program led by the Ministry of Land, Infrastructure, Transport and Tourism support adoption of digital measurement tools across public works projects. Contractors are increasing use of laser surveying equipment to improve productivity and site accuracy. Infrastructure modernization and labor efficiency targets remain key demand drivers.
- India: The construction lasers market in India is expected to witness steady expansion through 2036 with 5.6% CAGR supported by large-scale infrastructure and transportation projects. Government investment in highways and rail corridors increases demand for precision surveying and leveling systems. Airport and smart city developments add further demand. Drone use and LiDAR adoption are rising across road and infrastructure construction. Digital mapping technologies support site planning. India's NHAI is deploying 3D laser-based Network Survey Vehicles across 23 states for AI-driven highway monitoring and asset management. [4]
FACT.MR's Asia Pacific analysis covers China, Japan, South Korea, India, ASEAN, and Australia and New Zealand. The study includes government infrastructure program data and construction equipment benchmarks by country.
Europe Construction Lasers Market Analysis
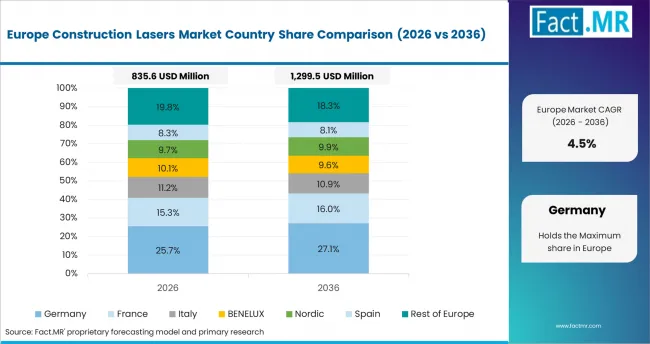
Europe is a regulation-driven construction lasers market supported by BIM adoption mandates and infrastructure modernization programs. Construction firms across Germany and the United Kingdom are upgrading instrument fleets as digital site documentation standards strengthen.
- Germany: Germany is expected to record 5.1% CAGR by 2036. BIM mandates across public infrastructure projects support replacement demand for precision laser systems. Road, rail, and public construction contractors are increasing adoption of digital measurement instruments for compliance and workflow integration.
- United Kingdom: The construction lasers market in the United Kingdom is forecast to expand at 4.0% CAGR through 2036. Commercial development activity and building safety compliance requirements support demand for precision leveling and alignment systems. Contractors are also increasing adoption of self-leveling and digital measurement equipment across residential and commercial projects.
FACT.MR’s Europe analysis covers Germany, the United Kingdom, France, Italy, Spain, Nordic countries, BENELUX, and the Rest of Western Europe. The study includes BIM adoption trends, infrastructure spending analysis, and contractor equipment replacement patterns.
North America Construction Lasers Market Analysis
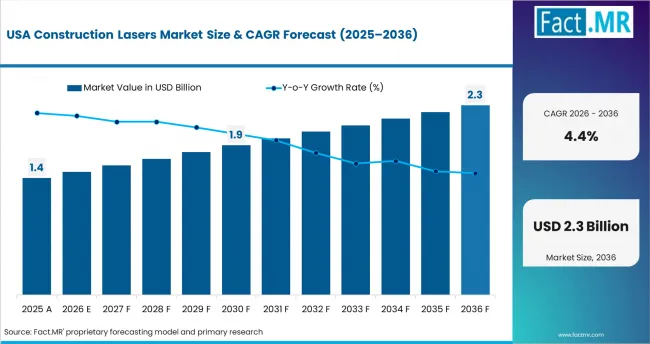
North America represents a high-value construction lasers market supported by infrastructure investment and strong commercial construction activity. Equipment rental networks continue to improve contractor access to rotary and line laser systems across large and mid-sized construction projects.
- United States: Construction laser demand in the United States is projected to grow at 4.4% CAGR through 2036. Infrastructure modernization and utility construction projects support demand for machine control laser systems and grading instruments. Commercial building activity and highway development programs are also increasing deployment of precision measurement equipment across active project sites. In March 2025, Topcon Positioning Systems announced expanded road construction workflow solutions and machine control technologies for paving, scanning, and compaction applications targeting U.S. infrastructure contractors. [3]
FACT.MR’s North America analysis covers the United States, Canada, and Mexico. The study includes infrastructure spending trends, construction equipment rental activity, and machine control technology adoption across contractor segments.
Key Players
- Leica Geosystems AG
- Trimble Inc.
- Topcon Corporation
- Hilti Corporation
- Robert Bosch GmbH
- Stanley Black & Decker, Inc.
- Spectra Precision Lasers LLC
- Johnson Level & Tool Mfg. Co. Inc.
- Kapro Industries Ltd.
This Report Addresses
- Strategic intelligence on construction laser demand across laser type, operation mode, working range, application, and end-user segments covering civil engineering, commercial building, industrial, and residential construction globally.
- Market forecast from USD 3.4 billion in 2026 to USD 5.8 billion by 2036 at a CAGR of 5.3% with USD 2.4 billion in absolute dollar opportunity across the forecast period.
- Growth opportunity mapping across U.S. Infrastructure Investment and Jobs Act-funded civil contracts, Japan i-Construction program requirements, China smart city infrastructure tenders, and Germany BIM mandate-driven instrument replacement cycles.
- Segment analysis by laser type, operation, range, application, and end user with global and regional CAGR forecasts and leading sub-segment share benchmarks including rotary level laser, self-leveling operation, and outdoor application leading positions.
- Regional outlook covering Asia Pacific infrastructure-driven growth, North America machine control and rental model expansion, Europe BIM regulation-driven upgrade cycles, and emerging market civil construction volume growth.
- Competitive analysis of Leica Geosystems, Trimble Inc., Topcon Corporation, Hilti Corporation, Robert Bosch GmbH, and Spectra Precision Lasers covering product portfolio depth, distribution channel access, digital connectivity capability, and regional market positioning.
- Regulatory impact analysis covering Japan MLIT i-Construction program digital measurement mandates, Germany BMDV BIM adoption requirements for public infrastructure, and U.S. Infrastructure Investment and Jobs Act precision instrument implications.
- Report delivered in PDF, Excel, and presentation formats supported by construction laser unit sales data, infrastructure program spending benchmarks, and primary interviews with site engineers and equipment managers.
Construction Lasers Market Definition
The construction lasers market covers professional precision measurement instruments used on construction and civil engineering sites for leveling, alignment, grading, and layout tasks.
Construction Lasers Market Inclusions
The study covers global and regional forecasts from 2026 to 2036 across laser type, operation mode, range, application, and end-user segments. It includes rotary level lasers, line level lasers, self-leveling systems, combination lasers, and pipe lasers used across residential, commercial, industrial, and infrastructure construction projects globally.
Construction Lasers Market Exclusions
The study excludes 3D laser scanners used for point cloud surveying and LiDAR systems unless used in combination with construction layout laser applications. It omits precision optical theodolites, total stations, and GNSS positioning equipment. Laboratory laser measurement devices and non-construction-grade consumer laser levels also fall outside the study scope.
Construction Lasers Market Research Methodology
- Primary Research
- Primary research includes interviews with construction site managers at infrastructure and commercial building contractors. Project engineers at civil engineering firms, capital project managers at general contractors, and equipment specialists at construction equipment rental companies across the United States, Germany, Japan, and China are covered.
- Desk Research
- Desk research uses public disclosures from Leica Geosystems, Trimble Inc., Topcon Corporation, Hilti Corporation, and Robert Bosch GmbH. It includes U.S. Census Bureau construction spending data, Japan Ministry of Land Infrastructure Transport and Tourism i-Construction program reports, and government infrastructure program disclosures covered.
- Market-Sizing and Forecasting
- Market sizing applies a hybrid top-down and bottom-up model. Equipment unit sales benchmarks by product type and construction segment form the base inputs. Segment forecasts are built separately for rotary, line, and combination laser product types across indoor and outdoor application categories by region.
- Data Validation and Update Cycle
- Data validation uses construction laser manufacturer revenue disclosures and equipment spending benchmarks validated against 2024 and 2025 company filings. Findings are cross-checked through interviews with construction project engineers and equipment rental operations managers.
Scope of the Report

| Attribute | Details |
|---|---|
| Quantitative Units | USD 3.4 billion (2026) to USD 5.8 billion (2036), at a CAGR of 5.3% |
| Market Definition | Professional precision laser instruments used on construction and civil engineering sites for leveling, alignment, grading, and layout tasks including rotary, line, dot, pipe, and combination laser systems. |
| Type of Laser Segmentation | Spot/Plumb/Dot Lasers, Line Level Lasers, Single Beam Laser, Multi-Beam Lasers, Rotary Level Lasers, Combination Lasers, Others (Pipe Lasers, Grade Lasers) |
| Operation Segmentation | Manual-Leveling Lasers, Self-Leveling and Automatic-Leveling Lasers |
| Range Segmentation | Up to 25 Meters, 25 Meters to 50 Meters, 50 Meters to 100 Meters, 100 Meters to 150 Meters, 150 Meters to 200 Meters, Above 200 Meters |
| Application Segmentation | Indoor (Distance Measuring, Floor Leveling, Height Measuring, Aligning), Outdoor (Plumbing, Surveying, Elevation Measurements, Site Layout) |
| End User Segmentation | Residential Construction, Commercial Construction, Industrial Construction, Infrastructure and Civil Engineering |
| Regions Covered | North America, Europe, Asia Pacific, Latin America, Middle East and Africa |
| Countries Covered | USA, Canada, Mexico, Germany, UK, France, Italy, Spain, Nordic, BENELUX, China, Japan, South Korea, India, ASEAN, Australia and New Zealand, Brazil, Argentina, GCC Countries, South Africa |
| Key Companies Profiled | Leica Geosystems AG, Trimble Inc., Topcon Corporation, Hilti Corporation, Robert Bosch GmbH, Stanley Black & Decker Inc., Spectra Precision Lasers LLC, Johnson Level & Tool Mfg. Co. Inc., Kapro Industries Ltd. |
| Forecast Period | 2026 to 2036 |
| Approach | Hybrid top-down and bottom-up model using construction laser unit sales benchmarks, equipment rental market data, infrastructure program spending by region, and primary interviews with site engineers and capital equipment managers. |
Construction Lasers Market by Segments
By Type of Laser
- Spot/Plumb/Dot Lasers
- Line Level Lasers
- Single Beam Laser
- Multi-Beam Lasers
- Rotary Level Lasers
- Fixed Rotation Speed
- Variable Rotation Speed
- Combination Lasers (Emit Both Lines and Spots)
- Others (Pipe Lasers, Grade Lasers, Etc.)
By Operation
- Manual-Leveling Lasers
- Self-Leveling and Automatic-Leveling Lasers
By Range
- Up to 25 Meters
- 25 Meters to 50 Meters
- 50 Meters to 100 Meters
- 100 Meters to 150 Meters
- 150 Meters to 200 Meters
- Above 200 Meters
By Application
- Indoor
- Distance Measuring
- Floor Leveling
- Height Measuring
- Aligning
- Outdoor
- Plumbing
- Surveying
- Elevation Measurements
- Site Layout
By End User
- Residential Construction
- Commercial Construction
- Industrial Construction
- Infrastructure and Civil Engineering
By Region
- North America
- United States
- Canada
- Mexico
- Latin America
- Brazil
- Argentina
- Colombia
- Rest of Latin America
- Western Europe
- Germany
- United Kingdom
- France
- Italy
- Spain
- Nordic Countries
- BENELUX
- Rest of Western Europe
- Eastern Europe
- Russia
- Poland
- Hungary
- Balkan and Baltic
- Rest of Eastern Europe
- East Asia
- China
- Japan
- South Korea
- South Asia and Pacific
- India
- ASEAN
- Australia and New Zealand
- Rest of South Asia and Pacific
- Middle East and Africa
- Kingdom of Saudi Arabia
- UAE
- South Africa
- Rest of Middle East and Africa
Bibliography
- Hexagon AB. (2024). Leica Geosystems unveils bold new product line-up reimagining digital construction layout.
- FARO Technologies. (2025). Topcon and FARO announce strategic agreement in laser scanning technology.
- Topcon Positioning Systems. (2025). Topcon expands road construction technology portfolio with new workflow solutions for scanning, paving, and compaction. Topcon Positioning Systems.
- Tractor Junction Infra. (2025). Smart road technology adoption accelerates infrastructure modernization in India. Tractor Junction Infra.
- Hilti India. (2025). Laser layout tools and construction measurement systems. Hilti India.
- Frequently Asked Questions -
How large is the global construction lasers market in 2025?
The global construction lasers market was valued at USD 3.3 billion in 2025.
What will the construction lasers market size be in 2026?
Based on Fact.MR analysis, demand for construction lasers is estimated to grow to USD 3.4 billion in 2026.
What is the projected construction lasers market size by 2036?
The construction lasers market is projected to reach USD 5.8 billion by 2036, generating USD 2.4 billion in absolute dollar opportunity over the forecast period.
What is the expected CAGR for the construction lasers market from 2026 to 2036?
FACT.MR projects a CAGR of 5.3% for the global construction lasers market during the 2026 to 2036 forecast period.
Which laser type is poised to lead the construction lasers market?
Self-leveling rotary level lasers lead with nearly 31.4% share in 2026 driven by their use in grading, excavation, and large-scale alignment work across civil infrastructure and commercial construction project sites.
Which end-user segment holds the largest share in the construction lasers market?
Infrastructure and civil engineering projects represent 40% share in 2026 as road construction, bridge works, utility installation, and earthmoving contracts generate consistent demand for high-precision rotary and grade laser systems.
Which country shows the fastest growth in the construction lasers market?
China leads at 6.3% CAGR through 2036 driven by urban infrastructure investment and smart city program spending generating large-scale civil engineering of construction laser instruments.
Table of Content
- Executive Summary
- Global Market Outlook
- Demand to side Trends
- Supply to side Trends
- Technology Roadmap Analysis
- Analysis and Recommendations
- Market Overview
- Market Coverage / Taxonomy
- Market Definition / Scope / Limitations
- Research Methodology
- Chapter Orientation
- Analytical Lens and Working Hypotheses
- Market Structure, Signals, and Trend Drivers
- Benchmarking and Cross-market Comparability
- Market Sizing, Forecasting, and Opportunity Mapping
- Research Design and Evidence Framework
- Desk Research Programme (Secondary Evidence)
- Company Annual and Sustainability Reports
- Peer-reviewed Journals and Academic Literature
- Corporate Websites, Product Literature, and Technical Notes
- Earnings Decks and Investor Briefings
- Statutory Filings and Regulatory Disclosures
- Technical White Papers and Standards Notes
- Trade Journals, Industry Magazines, and Analyst Briefs
- Conference Proceedings, Webinars, and Seminar Materials
- Government Statistics Portals and Public Data Releases
- Press Releases and Reputable Media Coverage
- Specialist Newsletters and Curated Briefings
- Sector Databases and Reference Repositories
- Fact.MR Internal Proprietary Databases and Historical Market Datasets
- Subscription Datasets and Paid Sources
- Social Channels, Communities, and Digital Listening Inputs
- Additional Desk Sources
- Expert Input and Fieldwork (Primary Evidence)
- Primary Modes
- Qualitative Interviews and Expert Elicitation
- Quantitative Surveys and Structured Data Capture
- Blended Approach
- Why Primary Evidence is Used
- Field Techniques
- Interviews
- Surveys
- Focus Groups
- Observational and In-context Research
- Social and Community Interactions
- Stakeholder Universe Engaged
- C-suite Leaders
- Board Members
- Presidents and Vice Presidents
- R&D and Innovation Heads
- Technical Specialists
- Domain Subject-matter Experts
- Scientists
- Physicians and Other Healthcare Professionals
- Governance, Ethics, and Data Stewardship
- Research Ethics
- Data Integrity and Handling
- Primary Modes
- Tooling, Models, and Reference Databases
- Desk Research Programme (Secondary Evidence)
- Data Engineering and Model Build
- Data Acquisition and Ingestion
- Cleaning, Normalisation, and Verification
- Synthesis, Triangulation, and Analysis
- Quality Assurance and Audit Trail
- Market Background
- Market Dynamics
- Drivers
- Restraints
- Opportunity
- Trends
- Scenario Forecast
- Demand in Optimistic Scenario
- Demand in Likely Scenario
- Demand in Conservative Scenario
- Opportunity Map Analysis
- Product Life Cycle Analysis
- Supply Chain Analysis
- Investment Feasibility Matrix
- Value Chain Analysis
- PESTLE and Porter’s Analysis
- Regulatory Landscape
- Regional Parent Market Outlook
- Production and Consumption Statistics
- Import and Export Statistics
- Market Dynamics
- Global Market Analysis 2021 to 2025 and Forecast, 2026 to 2036
- Historical Market Size Value (USD Million) Analysis, 2021 to 2025
- Current and Future Market Size Value (USD Million) Projections, 2026 to 2036
- Y to o to Y Growth Trend Analysis
- Absolute $ Opportunity Analysis
- Global Market Pricing Analysis 2021 to 2025 and Forecast 2026 to 2036
- Global Market Analysis 2021 to 2025 and Forecast 2026 to 2036, By Product Type
- Introduction / Key Findings
- Historical Market Size Value (USD Million) Analysis By Product Type , 2021 to 2025
- Current and Future Market Size Value (USD Million) Analysis and Forecast By Product Type , 2026 to 2036
- Rotary Lasers
- Line Lasers
- Plumb Lasers
- Dot Lasers
- Pipe Lasers
- Rotary Lasers
- Y to o to Y Growth Trend Analysis By Product Type , 2021 to 2025
- Absolute $ Opportunity Analysis By Product Type , 2026 to 2036
- Global Market Analysis 2021 to 2025 and Forecast 2026 to 2036, By Range
- Introduction / Key Findings
- Historical Market Size Value (USD Million) Analysis By Range, 2021 to 2025
- Current and Future Market Size Value (USD Million) Analysis and Forecast By Range, 2026 to 2036
- 100 m to 300 m
- More than 300 m
- Less than 100 m
- 100 m to 300 m
- Y to o to Y Growth Trend Analysis By Range, 2021 to 2025
- Absolute $ Opportunity Analysis By Range, 2026 to 2036
- Global Market Analysis 2021 to 2025 and Forecast 2026 to 2036, By Application
- Introduction / Key Findings
- Historical Market Size Value (USD Million) Analysis By Application, 2021 to 2025
- Current and Future Market Size Value (USD Million) Analysis and Forecast By Application, 2026 to 2036
- Leveling
- Alignment
- Grading
- Plumbing
- Layout
- Leveling
- Y to o to Y Growth Trend Analysis By Application, 2021 to 2025
- Absolute $ Opportunity Analysis By Application, 2026 to 2036
- Global Market Analysis 2021 to 2025 and Forecast 2026 to 2036, By End User
- Introduction / Key Findings
- Historical Market Size Value (USD Million) Analysis By End User, 2021 to 2025
- Current and Future Market Size Value (USD Million) Analysis and Forecast By End User, 2026 to 2036
- Commercial Construction
- Infrastructure
- Industrial Facilities
- Residential Construction
- Commercial Construction
- Y to o to Y Growth Trend Analysis By End User, 2021 to 2025
- Absolute $ Opportunity Analysis By End User, 2026 to 2036
- Global Market Analysis 2021 to 2025 and Forecast 2026 to 2036, By Sales Channel
- Introduction / Key Findings
- Historical Market Size Value (USD Million) Analysis By Sales Channel, 2021 to 2025
- Current and Future Market Size Value (USD Million) Analysis and Forecast By Sales Channel, 2026 to 2036
- Direct Sales
- Distributors
- Online Sales
- Rental Channels
- Direct Sales
- Y to o to Y Growth Trend Analysis By Sales Channel, 2021 to 2025
- Absolute $ Opportunity Analysis By Sales Channel, 2026 to 2036
- Global Market Analysis 2021 to 2025 and Forecast 2026 to 2036, By Region
- Introduction
- Historical Market Size Value (USD Million) Analysis By Region, 2021 to 2025
- Current Market Size Value (USD Million) Analysis and Forecast By Region, 2026 to 2036
- North America
- Latin America
- Western Europe
- Eastern Europe
- East Asia
- South Asia and Pacific
- Middle East & Africa
- Market Attractiveness Analysis By Region
- North America Market Analysis 2021 to 2025 and Forecast 2026 to 2036, By Country
- Historical Market Size Value (USD Million) Trend Analysis By Market Taxonomy, 2021 to 2025
- Market Size Value (USD Million) Forecast By Market Taxonomy, 2026 to 2036
- By Country
- USA
- Canada
- Mexico
- By Product Type
- By Range
- By Application
- By End User
- By Sales Channel
- By Country
- Market Attractiveness Analysis
- By Country
- By Product Type
- By Range
- By Application
- By End User
- By Sales Channel
- Key Takeaways
- Latin America Market Analysis 2021 to 2025 and Forecast 2026 to 2036, By Country
- Historical Market Size Value (USD Million) Trend Analysis By Market Taxonomy, 2021 to 2025
- Market Size Value (USD Million) Forecast By Market Taxonomy, 2026 to 2036
- By Country
- Brazil
- Chile
- Rest of Latin America
- By Product Type
- By Range
- By Application
- By End User
- By Sales Channel
- By Country
- Market Attractiveness Analysis
- By Country
- By Product Type
- By Range
- By Application
- By End User
- By Sales Channel
- Key Takeaways
- Western Europe Market Analysis 2021 to 2025 and Forecast 2026 to 2036, By Country
- Historical Market Size Value (USD Million) Trend Analysis By Market Taxonomy, 2021 to 2025
- Market Size Value (USD Million) Forecast By Market Taxonomy, 2026 to 2036
- By Country
- Germany
- UK
- Italy
- Spain
- France
- Nordic
- BENELUX
- Rest of Western Europe
- By Product Type
- By Range
- By Application
- By End User
- By Sales Channel
- By Country
- Market Attractiveness Analysis
- By Country
- By Product Type
- By Range
- By Application
- By End User
- By Sales Channel
- Key Takeaways
- Eastern Europe Market Analysis 2021 to 2025 and Forecast 2026 to 2036, By Country
- Historical Market Size Value (USD Million) Trend Analysis By Market Taxonomy, 2021 to 2025
- Market Size Value (USD Million) Forecast By Market Taxonomy, 2026 to 2036
- By Country
- Russia
- Poland
- Hungary
- Balkan & Baltic
- Rest of Eastern Europe
- By Product Type
- By Range
- By Application
- By End User
- By Sales Channel
- By Country
- Market Attractiveness Analysis
- By Country
- By Product Type
- By Range
- By Application
- By End User
- By Sales Channel
- Key Takeaways
- East Asia Market Analysis 2021 to 2025 and Forecast 2026 to 2036, By Country
- Historical Market Size Value (USD Million) Trend Analysis By Market Taxonomy, 2021 to 2025
- Market Size Value (USD Million) Forecast By Market Taxonomy, 2026 to 2036
- By Country
- China
- Japan
- South Korea
- By Product Type
- By Range
- By Application
- By End User
- By Sales Channel
- By Country
- Market Attractiveness Analysis
- By Country
- By Product Type
- By Range
- By Application
- By End User
- By Sales Channel
- Key Takeaways
- South Asia and Pacific Market Analysis 2021 to 2025 and Forecast 2026 to 2036, By Country
- Historical Market Size Value (USD Million) Trend Analysis By Market Taxonomy, 2021 to 2025
- Market Size Value (USD Million) Forecast By Market Taxonomy, 2026 to 2036
- By Country
- India
- ASEAN
- Australia & New Zealand
- Rest of South Asia and Pacific
- By Product Type
- By Range
- By Application
- By End User
- By Sales Channel
- By Country
- Market Attractiveness Analysis
- By Country
- By Product Type
- By Range
- By Application
- By End User
- By Sales Channel
- Key Takeaways
- Middle East & Africa Market Analysis 2021 to 2025 and Forecast 2026 to 2036, By Country
- Historical Market Size Value (USD Million) Trend Analysis By Market Taxonomy, 2021 to 2025
- Market Size Value (USD Million) Forecast By Market Taxonomy, 2026 to 2036
- By Country
- Kingdom of Saudi Arabia
- Other GCC Countries
- Turkiye
- South Africa
- Other African Union
- Rest of Middle East & Africa
- By Product Type
- By Range
- By Application
- By End User
- By Sales Channel
- By Country
- Market Attractiveness Analysis
- By Country
- By Product Type
- By Range
- By Application
- By End User
- By Sales Channel
- Key Takeaways
- Key Countries Market Analysis
- USA
- Pricing Analysis
- Market Share Analysis, 2025
- By Product Type
- By Range
- By Application
- By End User
- By Sales Channel
- Canada
- Pricing Analysis
- Market Share Analysis, 2025
- By Product Type
- By Range
- By Application
- By End User
- By Sales Channel
- Mexico
- Pricing Analysis
- Market Share Analysis, 2025
- By Product Type
- By Range
- By Application
- By End User
- By Sales Channel
- Brazil
- Pricing Analysis
- Market Share Analysis, 2025
- By Product Type
- By Range
- By Application
- By End User
- By Sales Channel
- Chile
- Pricing Analysis
- Market Share Analysis, 2025
- By Product Type
- By Range
- By Application
- By End User
- By Sales Channel
- Germany
- Pricing Analysis
- Market Share Analysis, 2025
- By Product Type
- By Range
- By Application
- By End User
- By Sales Channel
- UK
- Pricing Analysis
- Market Share Analysis, 2025
- By Product Type
- By Range
- By Application
- By End User
- By Sales Channel
- Italy
- Pricing Analysis
- Market Share Analysis, 2025
- By Product Type
- By Range
- By Application
- By End User
- By Sales Channel
- Spain
- Pricing Analysis
- Market Share Analysis, 2025
- By Product Type
- By Range
- By Application
- By End User
- By Sales Channel
- France
- Pricing Analysis
- Market Share Analysis, 2025
- By Product Type
- By Range
- By Application
- By End User
- By Sales Channel
- India
- Pricing Analysis
- Market Share Analysis, 2025
- By Product Type
- By Range
- By Application
- By End User
- By Sales Channel
- ASEAN
- Pricing Analysis
- Market Share Analysis, 2025
- By Product Type
- By Range
- By Application
- By End User
- By Sales Channel
- Australia & New Zealand
- Pricing Analysis
- Market Share Analysis, 2025
- By Product Type
- By Range
- By Application
- By End User
- By Sales Channel
- China
- Pricing Analysis
- Market Share Analysis, 2025
- By Product Type
- By Range
- By Application
- By End User
- By Sales Channel
- Japan
- Pricing Analysis
- Market Share Analysis, 2025
- By Product Type
- By Range
- By Application
- By End User
- By Sales Channel
- South Korea
- Pricing Analysis
- Market Share Analysis, 2025
- By Product Type
- By Range
- By Application
- By End User
- By Sales Channel
- Russia
- Pricing Analysis
- Market Share Analysis, 2025
- By Product Type
- By Range
- By Application
- By End User
- By Sales Channel
- Poland
- Pricing Analysis
- Market Share Analysis, 2025
- By Product Type
- By Range
- By Application
- By End User
- By Sales Channel
- Hungary
- Pricing Analysis
- Market Share Analysis, 2025
- By Product Type
- By Range
- By Application
- By End User
- By Sales Channel
- Kingdom of Saudi Arabia
- Pricing Analysis
- Market Share Analysis, 2025
- By Product Type
- By Range
- By Application
- By End User
- By Sales Channel
- Turkiye
- Pricing Analysis
- Market Share Analysis, 2025
- By Product Type
- By Range
- By Application
- By End User
- By Sales Channel
- South Africa
- Pricing Analysis
- Market Share Analysis, 2025
- By Product Type
- By Range
- By Application
- By End User
- By Sales Channel
- USA
- Market Structure Analysis
- Competition Dashboard
- Competition Benchmarking
- Market Share Analysis of Top Players
- By Regional
- By Product Type
- By Range
- By Application
- By End User
- By Sales Channel
- Competition Analysis
- Competition Deep Dive
- Bosch
- Overview
- Product Portfolio
- Profitability by Market Segments (Product/Age /Sales Channel/Region)
- Sales Footprint
- Strategy Overview
- Marketing Strategy
- Product Strategy
- Channel Strategy
- Hilti
- Leica Geosystems
- Topcon Corporation
- Trimble Inc.
- Spectra Precision
- Johnson Level & Tool
- Stabila
- Makita Corporation
- DeWalt
- Bosch
- Competition Deep Dive
- Assumptions & Acronyms Used
List Of Table
- Table 1: Global Market Value (USD Million) Forecast by Region, 2021 to 2036
- Table 2: Global Market Value (USD Million) Forecast by Product Type , 2021 to 2036
- Table 3: Global Market Value (USD Million) Forecast by Range, 2021 to 2036
- Table 4: Global Market Value (USD Million) Forecast by Application, 2021 to 2036
- Table 5: Global Market Value (USD Million) Forecast by End User, 2021 to 2036
- Table 6: Global Market Value (USD Million) Forecast by Sales Channel, 2021 to 2036
- Table 7: North America Market Value (USD Million) Forecast by Country, 2021 to 2036
- Table 8: North America Market Value (USD Million) Forecast by Product Type , 2021 to 2036
- Table 9: North America Market Value (USD Million) Forecast by Range, 2021 to 2036
- Table 10: North America Market Value (USD Million) Forecast by Application, 2021 to 2036
- Table 11: North America Market Value (USD Million) Forecast by End User, 2021 to 2036
- Table 12: North America Market Value (USD Million) Forecast by Sales Channel, 2021 to 2036
- Table 13: Latin America Market Value (USD Million) Forecast by Country, 2021 to 2036
- Table 14: Latin America Market Value (USD Million) Forecast by Product Type , 2021 to 2036
- Table 15: Latin America Market Value (USD Million) Forecast by Range, 2021 to 2036
- Table 16: Latin America Market Value (USD Million) Forecast by Application, 2021 to 2036
- Table 17: Latin America Market Value (USD Million) Forecast by End User, 2021 to 2036
- Table 18: Latin America Market Value (USD Million) Forecast by Sales Channel, 2021 to 2036
- Table 19: Western Europe Market Value (USD Million) Forecast by Country, 2021 to 2036
- Table 20: Western Europe Market Value (USD Million) Forecast by Product Type , 2021 to 2036
- Table 21: Western Europe Market Value (USD Million) Forecast by Range, 2021 to 2036
- Table 22: Western Europe Market Value (USD Million) Forecast by Application, 2021 to 2036
- Table 23: Western Europe Market Value (USD Million) Forecast by End User, 2021 to 2036
- Table 24: Western Europe Market Value (USD Million) Forecast by Sales Channel, 2021 to 2036
- Table 25: Eastern Europe Market Value (USD Million) Forecast by Country, 2021 to 2036
- Table 26: Eastern Europe Market Value (USD Million) Forecast by Product Type , 2021 to 2036
- Table 27: Eastern Europe Market Value (USD Million) Forecast by Range, 2021 to 2036
- Table 28: Eastern Europe Market Value (USD Million) Forecast by Application, 2021 to 2036
- Table 29: Eastern Europe Market Value (USD Million) Forecast by End User, 2021 to 2036
- Table 30: Eastern Europe Market Value (USD Million) Forecast by Sales Channel, 2021 to 2036
- Table 31: East Asia Market Value (USD Million) Forecast by Country, 2021 to 2036
- Table 32: East Asia Market Value (USD Million) Forecast by Product Type , 2021 to 2036
- Table 33: East Asia Market Value (USD Million) Forecast by Range, 2021 to 2036
- Table 34: East Asia Market Value (USD Million) Forecast by Application, 2021 to 2036
- Table 35: East Asia Market Value (USD Million) Forecast by End User, 2021 to 2036
- Table 36: East Asia Market Value (USD Million) Forecast by Sales Channel, 2021 to 2036
- Table 37: South Asia and Pacific Market Value (USD Million) Forecast by Country, 2021 to 2036
- Table 38: South Asia and Pacific Market Value (USD Million) Forecast by Product Type , 2021 to 2036
- Table 39: South Asia and Pacific Market Value (USD Million) Forecast by Range, 2021 to 2036
- Table 40: South Asia and Pacific Market Value (USD Million) Forecast by Application, 2021 to 2036
- Table 41: South Asia and Pacific Market Value (USD Million) Forecast by End User, 2021 to 2036
- Table 42: South Asia and Pacific Market Value (USD Million) Forecast by Sales Channel, 2021 to 2036
- Table 43: Middle East & Africa Market Value (USD Million) Forecast by Country, 2021 to 2036
- Table 44: Middle East & Africa Market Value (USD Million) Forecast by Product Type , 2021 to 2036
- Table 45: Middle East & Africa Market Value (USD Million) Forecast by Range, 2021 to 2036
- Table 46: Middle East & Africa Market Value (USD Million) Forecast by Application, 2021 to 2036
- Table 47: Middle East & Africa Market Value (USD Million) Forecast by End User, 2021 to 2036
- Table 48: Middle East & Africa Market Value (USD Million) Forecast by Sales Channel, 2021 to 2036
List Of Figures
- Figure 1: Global Market Pricing Analysis
- Figure 2: Global Market Value (USD Million) Forecast 2021-2036
- Figure 3: Global Market Value Share and BPS Analysis by Product Type , 2026 and 2036
- Figure 4: Global Market Y-o-Y Growth Comparison by Product Type , 2026-2036
- Figure 5: Global Market Attractiveness Analysis by Product Type
- Figure 6: Global Market Value Share and BPS Analysis by Range, 2026 and 2036
- Figure 7: Global Market Y-o-Y Growth Comparison by Range, 2026-2036
- Figure 8: Global Market Attractiveness Analysis by Range
- Figure 9: Global Market Value Share and BPS Analysis by Application, 2026 and 2036
- Figure 10: Global Market Y-o-Y Growth Comparison by Application, 2026-2036
- Figure 11: Global Market Attractiveness Analysis by Application
- Figure 12: Global Market Value Share and BPS Analysis by End User, 2026 and 2036
- Figure 13: Global Market Y-o-Y Growth Comparison by End User, 2026-2036
- Figure 14: Global Market Attractiveness Analysis by End User
- Figure 15: Global Market Value Share and BPS Analysis by Sales Channel, 2026 and 2036
- Figure 16: Global Market Y-o-Y Growth Comparison by Sales Channel, 2026-2036
- Figure 17: Global Market Attractiveness Analysis by Sales Channel
- Figure 18: Global Market Value (USD Million) Share and BPS Analysis by Region, 2026 and 2036
- Figure 19: Global Market Y-o-Y Growth Comparison by Region, 2026-2036
- Figure 20: Global Market Attractiveness Analysis by Region
- Figure 21: North America Market Incremental Dollar Opportunity, 2026-2036
- Figure 22: Latin America Market Incremental Dollar Opportunity, 2026-2036
- Figure 23: Western Europe Market Incremental Dollar Opportunity, 2026-2036
- Figure 24: Eastern Europe Market Incremental Dollar Opportunity, 2026-2036
- Figure 25: East Asia Market Incremental Dollar Opportunity, 2026-2036
- Figure 26: South Asia and Pacific Market Incremental Dollar Opportunity, 2026-2036
- Figure 27: Middle East & Africa Market Incremental Dollar Opportunity, 2026-2036
- Figure 28: North America Market Value Share and BPS Analysis by Country, 2026 and 2036
- Figure 29: North America Market Value Share and BPS Analysis by Product Type , 2026 and 2036
- Figure 30: North America Market Y-o-Y Growth Comparison by Product Type , 2026-2036
- Figure 31: North America Market Attractiveness Analysis by Product Type
- Figure 32: North America Market Value Share and BPS Analysis by Range, 2026 and 2036
- Figure 33: North America Market Y-o-Y Growth Comparison by Range, 2026-2036
- Figure 34: North America Market Attractiveness Analysis by Range
- Figure 35: North America Market Value Share and BPS Analysis by Application, 2026 and 2036
- Figure 36: North America Market Y-o-Y Growth Comparison by Application, 2026-2036
- Figure 37: North America Market Attractiveness Analysis by Application
- Figure 38: North America Market Value Share and BPS Analysis by End User, 2026 and 2036
- Figure 39: North America Market Y-o-Y Growth Comparison by End User, 2026-2036
- Figure 40: North America Market Attractiveness Analysis by End User
- Figure 41: North America Market Value Share and BPS Analysis by Sales Channel, 2026 and 2036
- Figure 42: North America Market Y-o-Y Growth Comparison by Sales Channel, 2026-2036
- Figure 43: North America Market Attractiveness Analysis by Sales Channel
- Figure 44: Latin America Market Value Share and BPS Analysis by Country, 2026 and 2036
- Figure 45: Latin America Market Value Share and BPS Analysis by Product Type , 2026 and 2036
- Figure 46: Latin America Market Y-o-Y Growth Comparison by Product Type , 2026-2036
- Figure 47: Latin America Market Attractiveness Analysis by Product Type
- Figure 48: Latin America Market Value Share and BPS Analysis by Range, 2026 and 2036
- Figure 49: Latin America Market Y-o-Y Growth Comparison by Range, 2026-2036
- Figure 50: Latin America Market Attractiveness Analysis by Range
- Figure 51: Latin America Market Value Share and BPS Analysis by Application, 2026 and 2036
- Figure 52: Latin America Market Y-o-Y Growth Comparison by Application, 2026-2036
- Figure 53: Latin America Market Attractiveness Analysis by Application
- Figure 54: Latin America Market Value Share and BPS Analysis by End User, 2026 and 2036
- Figure 55: Latin America Market Y-o-Y Growth Comparison by End User, 2026-2036
- Figure 56: Latin America Market Attractiveness Analysis by End User
- Figure 57: Latin America Market Value Share and BPS Analysis by Sales Channel, 2026 and 2036
- Figure 58: Latin America Market Y-o-Y Growth Comparison by Sales Channel, 2026-2036
- Figure 59: Latin America Market Attractiveness Analysis by Sales Channel
- Figure 60: Western Europe Market Value Share and BPS Analysis by Country, 2026 and 2036
- Figure 61: Western Europe Market Value Share and BPS Analysis by Product Type , 2026 and 2036
- Figure 62: Western Europe Market Y-o-Y Growth Comparison by Product Type , 2026-2036
- Figure 63: Western Europe Market Attractiveness Analysis by Product Type
- Figure 64: Western Europe Market Value Share and BPS Analysis by Range, 2026 and 2036
- Figure 65: Western Europe Market Y-o-Y Growth Comparison by Range, 2026-2036
- Figure 66: Western Europe Market Attractiveness Analysis by Range
- Figure 67: Western Europe Market Value Share and BPS Analysis by Application, 2026 and 2036
- Figure 68: Western Europe Market Y-o-Y Growth Comparison by Application, 2026-2036
- Figure 69: Western Europe Market Attractiveness Analysis by Application
- Figure 70: Western Europe Market Value Share and BPS Analysis by End User, 2026 and 2036
- Figure 71: Western Europe Market Y-o-Y Growth Comparison by End User, 2026-2036
- Figure 72: Western Europe Market Attractiveness Analysis by End User
- Figure 73: Western Europe Market Value Share and BPS Analysis by Sales Channel, 2026 and 2036
- Figure 74: Western Europe Market Y-o-Y Growth Comparison by Sales Channel, 2026-2036
- Figure 75: Western Europe Market Attractiveness Analysis by Sales Channel
- Figure 76: Eastern Europe Market Value Share and BPS Analysis by Country, 2026 and 2036
- Figure 77: Eastern Europe Market Value Share and BPS Analysis by Product Type , 2026 and 2036
- Figure 78: Eastern Europe Market Y-o-Y Growth Comparison by Product Type , 2026-2036
- Figure 79: Eastern Europe Market Attractiveness Analysis by Product Type
- Figure 80: Eastern Europe Market Value Share and BPS Analysis by Range, 2026 and 2036
- Figure 81: Eastern Europe Market Y-o-Y Growth Comparison by Range, 2026-2036
- Figure 82: Eastern Europe Market Attractiveness Analysis by Range
- Figure 83: Eastern Europe Market Value Share and BPS Analysis by Application, 2026 and 2036
- Figure 84: Eastern Europe Market Y-o-Y Growth Comparison by Application, 2026-2036
- Figure 85: Eastern Europe Market Attractiveness Analysis by Application
- Figure 86: Eastern Europe Market Value Share and BPS Analysis by End User, 2026 and 2036
- Figure 87: Eastern Europe Market Y-o-Y Growth Comparison by End User, 2026-2036
- Figure 88: Eastern Europe Market Attractiveness Analysis by End User
- Figure 89: Eastern Europe Market Value Share and BPS Analysis by Sales Channel, 2026 and 2036
- Figure 90: Eastern Europe Market Y-o-Y Growth Comparison by Sales Channel, 2026-2036
- Figure 91: Eastern Europe Market Attractiveness Analysis by Sales Channel
- Figure 92: East Asia Market Value Share and BPS Analysis by Country, 2026 and 2036
- Figure 93: East Asia Market Value Share and BPS Analysis by Product Type , 2026 and 2036
- Figure 94: East Asia Market Y-o-Y Growth Comparison by Product Type , 2026-2036
- Figure 95: East Asia Market Attractiveness Analysis by Product Type
- Figure 96: East Asia Market Value Share and BPS Analysis by Range, 2026 and 2036
- Figure 97: East Asia Market Y-o-Y Growth Comparison by Range, 2026-2036
- Figure 98: East Asia Market Attractiveness Analysis by Range
- Figure 99: East Asia Market Value Share and BPS Analysis by Application, 2026 and 2036
- Figure 100: East Asia Market Y-o-Y Growth Comparison by Application, 2026-2036
- Figure 101: East Asia Market Attractiveness Analysis by Application
- Figure 102: East Asia Market Value Share and BPS Analysis by End User, 2026 and 2036
- Figure 103: East Asia Market Y-o-Y Growth Comparison by End User, 2026-2036
- Figure 104: East Asia Market Attractiveness Analysis by End User
- Figure 105: East Asia Market Value Share and BPS Analysis by Sales Channel, 2026 and 2036
- Figure 106: East Asia Market Y-o-Y Growth Comparison by Sales Channel, 2026-2036
- Figure 107: East Asia Market Attractiveness Analysis by Sales Channel
- Figure 108: South Asia and Pacific Market Value Share and BPS Analysis by Country, 2026 and 2036
- Figure 109: South Asia and Pacific Market Value Share and BPS Analysis by Product Type , 2026 and 2036
- Figure 110: South Asia and Pacific Market Y-o-Y Growth Comparison by Product Type , 2026-2036
- Figure 111: South Asia and Pacific Market Attractiveness Analysis by Product Type
- Figure 112: South Asia and Pacific Market Value Share and BPS Analysis by Range, 2026 and 2036
- Figure 113: South Asia and Pacific Market Y-o-Y Growth Comparison by Range, 2026-2036
- Figure 114: South Asia and Pacific Market Attractiveness Analysis by Range
- Figure 115: South Asia and Pacific Market Value Share and BPS Analysis by Application, 2026 and 2036
- Figure 116: South Asia and Pacific Market Y-o-Y Growth Comparison by Application, 2026-2036
- Figure 117: South Asia and Pacific Market Attractiveness Analysis by Application
- Figure 118: South Asia and Pacific Market Value Share and BPS Analysis by End User, 2026 and 2036
- Figure 119: South Asia and Pacific Market Y-o-Y Growth Comparison by End User, 2026-2036
- Figure 120: South Asia and Pacific Market Attractiveness Analysis by End User
- Figure 121: South Asia and Pacific Market Value Share and BPS Analysis by Sales Channel, 2026 and 2036
- Figure 122: South Asia and Pacific Market Y-o-Y Growth Comparison by Sales Channel, 2026-2036
- Figure 123: South Asia and Pacific Market Attractiveness Analysis by Sales Channel
- Figure 124: Middle East & Africa Market Value Share and BPS Analysis by Country, 2026 and 2036
- Figure 125: Middle East & Africa Market Value Share and BPS Analysis by Product Type , 2026 and 2036
- Figure 126: Middle East & Africa Market Y-o-Y Growth Comparison by Product Type , 2026-2036
- Figure 127: Middle East & Africa Market Attractiveness Analysis by Product Type
- Figure 128: Middle East & Africa Market Value Share and BPS Analysis by Range, 2026 and 2036
- Figure 129: Middle East & Africa Market Y-o-Y Growth Comparison by Range, 2026-2036
- Figure 130: Middle East & Africa Market Attractiveness Analysis by Range
- Figure 131: Middle East & Africa Market Value Share and BPS Analysis by Application, 2026 and 2036
- Figure 132: Middle East & Africa Market Y-o-Y Growth Comparison by Application, 2026-2036
- Figure 133: Middle East & Africa Market Attractiveness Analysis by Application
- Figure 134: Middle East & Africa Market Value Share and BPS Analysis by End User, 2026 and 2036
- Figure 135: Middle East & Africa Market Y-o-Y Growth Comparison by End User, 2026-2036
- Figure 136: Middle East & Africa Market Attractiveness Analysis by End User
- Figure 137: Middle East & Africa Market Value Share and BPS Analysis by Sales Channel, 2026 and 2036
- Figure 138: Middle East & Africa Market Y-o-Y Growth Comparison by Sales Channel, 2026-2036
- Figure 139: Middle East & Africa Market Attractiveness Analysis by Sales Channel
- Figure 140: Global Market - Tier Structure Analysis
- Figure 141: Global Market - Company Share Analysis