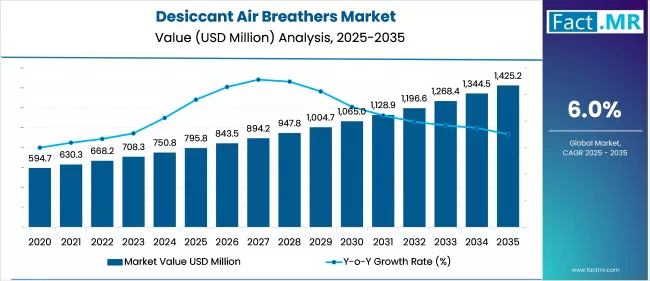
Desiccant Air Breathers Market

Desiccant Air Breathers Market Analysis, By Silica Content, By Max. Water Capacity, By Working Environment, By Application, By End-Use, and Region - Market Insights 2025 to 2035

Analysis of Desiccant Air Breathers Market Covering 30+ Countries Including Analysis of US, Canada, UK, Germany, France, Nordics, GCC countries, Japan, Korea and many more.

Desiccant Air Breathers Market Outlook (2025 to 2035)

The global desiccant air breathers market is projected to increase from USD 795.8 million in 2025 to USD 1,425.2 million by 2035, with a CAGR of 6.0% during the forecast period.

The increasing need for preventive maintenance, combined with the rapid expansion of the industrial and renewable energy sectors, drives growth. Their use in removing moisture and particulate contaminants makes them ideal for extending equipment life and ensuring operational efficiency.

Desiccant Air Breathers Market

What are the Drivers of Desiccant Air Breathers Market?

The increasing focus on preventive and predictive maintenance practices across industrial sectors primarily drives the growth of the desiccant air breathers market. As companies seek to reduce equipment downtime and extend the life of critical machinery, desiccant air breathers have become essential components.

These devices prevent moisture and particulate contamination in lubricants and hydraulic fluids, two of the leading causes of equipment failure. By maintaining fluid cleanliness, they help optimize performance and reduce the need for costly repairs and replacements. Industries such as manufacturing, chemicals, and energy are widely incorporating breathers into their maintenance protocols to ensure operational reliability.

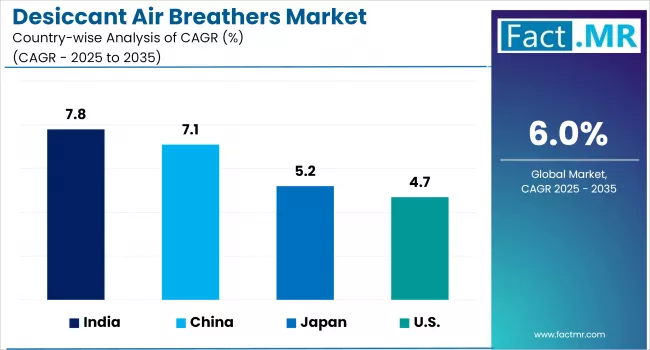
Another significant driver is the expansion of industrialization, particularly in emerging economies such as India, China, and Southeast Asian nations. These regions are witnessing rapid growth in sectors like power generation, construction, mining, and automotive manufacturing, all of which rely heavily on equipment protected by desiccant breathers.

Moreover, the push toward automation and the use of advanced machinery in industrial operations requires robust moisture control systems to prevent system degradation. As more facilities invest in high-value equipment, the demand for reliable contamination control solutions, such as desiccant air breathers, continues to rise.

The growing adoption of renewable energy infrastructure, especially wind and solar power systems, is also contributing to market growth. Components such as wind turbine gearboxes and transformers are exposed to harsh environmental conditions, making moisture control crucial for maintaining efficiency and preventing corrosion. Governments and private firms worldwide are investing heavily in clean energy projects, resulting in the increased implementation of batteries in renewable energy assets. Moreover, the expansion of power distribution and utility sectors further supports this trend, as aging infrastructure is being upgraded with modern moisture prevention technologies.

Advancements in breather technology and rising environmental awareness are reinforcing the market’s upward trajectory. Manufacturers are introducing innovative features such as self-regenerating desiccants, check-valve-controlled airflow, and IoT-enabled smart breathers for real-time monitoring and maintenance alerts.

Furthermore, there is a growing preference for environmentally sustainable solutions, such as recyclable and reusable breather units. These technological improvements, combined with stricter regulatory standards for fluid cleanliness and equipment reliability, are encouraging broader adoption across industries, ultimately supporting sustained market growth.

What are the Regional Trends of Desiccant Air Breathers Market?

U.S. holds a dominant share in the market due to the region’s advanced industrial infrastructure and high adoption of preventive maintenance practices. The presence of major OEMs and a strong focus on equipment reliability and environmental regulations have led to the widespread use of desiccant air breathers in sectors such as oil & gas, power generation, and manufacturing. Moreover, the U.S. leads in the adoption of IoT-based smart breathers as a part of Industry 4.0 initiatives. Demand is further bolstered by efforts to modernize aging power transmission infrastructure and increase renewable energy capacity.

Asia Pacific region is the fastest-growing market, driven by rapid industrialization, infrastructure development, and expanding manufacturing activities in countries like China, India, Japan, and South Korea. The growth of the automotive, mining, and construction sectors in India and China, along with their rising investments in wind and solar energy projects, is significantly boosting demand for desiccant breathers. Additionally, governments in the region are increasingly prioritizing equipment protection in the public utility and power sectors, promoting long-term adoption of breather systems.

Europe exhibits steady growth in the desiccant air breathers market, supported by strict environmental regulations, energy efficiency mandates, and a high level of technological sophistication. Countries such as Germany, France, and the UK are incorporating desiccant breathers into renewable energy installations, especially wind energy. The region's emphasis on sustainability has also led to rising demand for eco-friendly breather designs, such as refillable or recyclable models. Moreover, the growing popularity of predictive maintenance in industries such as pharmaceuticals, chemicals, and food processing is creating new growth opportunities.

The Middle East & Africa (MEA) region, particularly the Gulf Cooperation Council (GCC) countries and South Africa, is increasingly deploying desiccant breathers in oilfield equipment and power plants to manage desert dust and humidity. While these regions are still in a developing phase for this market, strategic investments in industrial automation and energy infrastructure are expected to fuel future growth.

What are the Challenges and Restraining Factors of Desiccant Air Breathers Market?

A key limitation is the high initial cost associated with advanced desiccant breathers, particularly those equipped with features such as smart sensors, check valves, or self-regenerating desiccant materials. These products, while efficient, require a higher upfront investment and ongoing maintenance, which can be prohibitive for small and mid-sized businesses. In cost-sensitive industries and developing economies, many companies often opt for cheaper, conventional alternatives such as standard vented caps or basic filters, even at the expense of long-term equipment reliability.

Another challenge is the lack of awareness about the importance of moisture and particulate control in industrial systems, particularly in developing regions. Many industries still rely heavily on reactive maintenance practices, addressing failures after they occur rather than investing in preventive measures. As a result, desiccant air breathers are underutilized in key sectors like construction, agriculture, and public utilities, where environmental exposure can be severe. This knowledge gap, combined with limited technical training among operators and maintenance teams, restricts broader adoption.

The market also faces environmental concerns related to the disposal of used desiccant materials and plastic components. While many manufacturers are shifting toward reusable or recyclable breather designs, a large portion of the market still relies on single-use models, contributing to industrial waste. Regulatory frameworks around waste management, especially in Europe and North America, may impose additional compliance burdens on manufacturers and end-users. Without standardized recycling infrastructure, sustainable adoption becomes a challenge, particularly in regions with stringent environmental laws.

Supply chain constraints and raw material dependencies pose ongoing risks. Desiccants, such as silica gel and molecular sieves, along with specialty polymers used in housing designs, are subject to global supply fluctuations. Geopolitical tensions, logistics disruptions, or raw material shortages can lead to product delays, cost escalations, or quality compromises.

Country-Wise Outlook

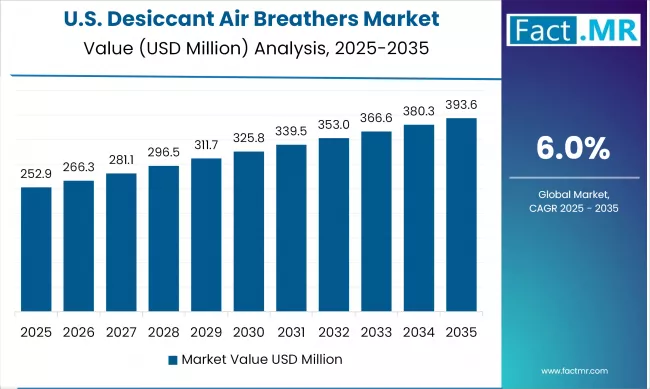
U.S. Desiccant Air Breathers Market sees Growth Driven by Expansion of Renewable Energy and Power Infrastructure

Desiccant Air Breathers Market Cagr Analysis By Country

The desiccant air breathers market in the U.S. is witnessing robust growth, driven by a surge in industrial equipment usage, infrastructure modernization, and increasing adoption of advanced maintenance practices.

One of the key growth drivers in the U.S. is the expansion of renewable energy and power infrastructure. As aging electrical grids and power generation systems undergo modernization, the demand for moisture control systems, such as desiccant air breathers, is increasing. These devices play a crucial role in protecting transformers, gearboxes, and other sensitive components from humidity and particle ingress, especially in wind farms, solar installations, and substations. Government incentives and private investments in clean energy projects further support the market’s momentum in this sector.

United States Desiccant Air Breathers Market Value Analysis 2025-2035

The country’s well-established oil & gas, manufacturing, and mining industries continue to adopt desiccant breathers to improve machinery longevity and operational efficiency. As companies across the U.S. increasingly implement predictive maintenance and Industry 4.0 practices, they are turning to technologically advanced breathers with IoT integration, real-time monitoring, and self-regenerating features. These innovations enable smarter maintenance scheduling, reduced equipment failure, and improved lifecycle management of critical assets.

The U.S. regulatory landscape, emphasizing environmental protection and fluid cleanliness, has pushed industries to invest in reliable contamination control solutions. Companies are also focusing on sustainable product use, adopting reusable and recyclable desiccant breathers to align with corporate ESG goals. With its mature industrial base, focus on innovation, and high awareness of maintenance efficiency, the U.S. remains a core growth hub for the global desiccant air breather market.

China witnesses Rapid Market Growth Backed by Infrastructure Modernization

The desiccant air breathers market in China is experiencing solid growth driven by industrial expansion, infrastructure development, and evolving manufacturing practices.

China’s industrial surge, driven by infrastructure projects, infrastructure modernization, and growth in segments such as automotive, electronics, and lithium-ion battery manufacturing, has catalyzed the adoption of battery technology. As the world’s largest manufacturing hub, Chinese players benefit from localized production and cost advantages, further reinforcing their market share both domestically and globally.

The China breather market is expected to continue growing at a mid-to-high single-digit annual rate. Factors such as urbanization, clean energy deployment, and increased regulatory focus on equipment reliability are expected to maintain momentum.

Japan Focuses on Sustainability in Industrial Verticals Fuels Demand for Desiccant Air Breathers

The growth of desiccant air breathers is underpinned by Japan’s focus on sustainability and fluid-system reliability across various industrial verticals. High-value sectors, such as automotive assembly, electronics manufacturing, pharmaceuticals, and energy utilities, widely use machinery that is dependent on clean, dry systems. Desiccant breathers, especially in lubricated and hydraulic equipment, help maintain fluid purity and prevent costly failures in precision applications.

Regulatory standards for equipment reliability, energy efficiency, and waste reduction also support market growth. Japan’s advanced automation landscape favors smart and reusable breather technologies, pushing for innovations in desiccant materials and monitoring. As factories modernize and utilities upgrade infrastructure, the demand for desiccant breathers is expected to remain strong, with consistent mid-single-digit growth aligned with the country’s industrial and environmental goals.

Category-wise Analysis

1.5 to 2.5 lbs to Exhibit Leading by Silica Content

Desiccant Air Breathers Market Analysis By Silica Content

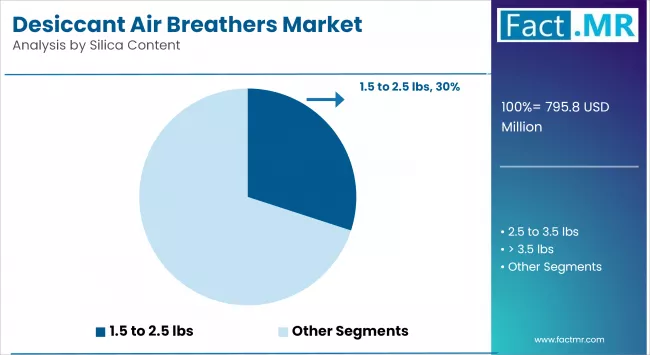
The segment with silica content ranging from 1.5 to 2.5 lbs holds the dominant market share. This range strikes a balance between cost-effectiveness and high moisture absorption efficiency, making it a preferred choice across a wide range of industrial applications. Its popularity is also driven by its availability and suitability for standard fluid reservoirs and gear systems where moderate moisture protection is required.

The segment with a silica content of more than 3.5 lbs is expected to grow at the fastest rate. This growth is driven by increasing demand for large-capacity equipment and storage tanks that operate in high-humidity or critical environments. Industries are increasingly opting for higher silica content to extend equipment life and reduce maintenance intervals.

5 to 10 fl oz to Exhibit Leading by Max. Water Capacity

Desiccant Air Breathers Market Analysis By Max Water Capacity

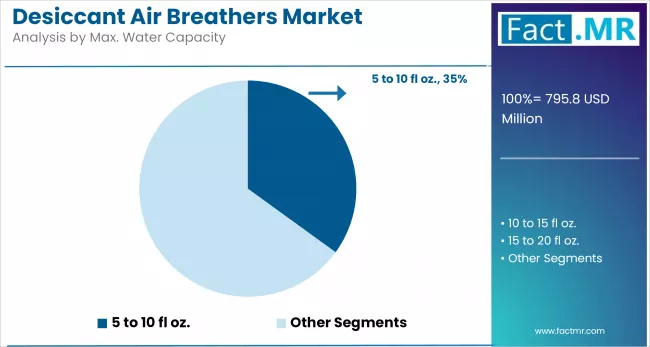
The 5- to 10-fl oz segment currently dominates the desiccant air breathers market. It provides optimal performance for medium-scale fluid systems, such as hydraulic fluid reservoirs and oil drums. Its widespread adoption is attributed to its ability to handle standard moisture levels without requiring frequent replacement, making it a cost-efficient solution for many industrial setups.

Meanwhile, the segment with a capacity of over 20 fl oz is emerging as the fastest-growing. The increasing use of large-scale fluid storage systems and bulk tanks in the energy, chemical, and heavy manufacturing industries is driving demand for desiccants with high moisture-holding capacities. These systems require long-lasting moisture protection, making high-capacity variants more attractive.

High Humidity/High Dust to Exhibit Leading by Working Environment

The High Humidity/High Dust segment dominates the desiccant air breathers market. This dominance is driven by the widespread use of breathers in industries such as mining, construction, power generation, and agriculture, where equipment is routinely exposed to extreme airborne contaminants and high moisture levels.

Desiccant breathers are increasingly deployed in hydraulic systems, gearboxes, and storage tanks to protect equipment from the ingress of dust and moisture, especially in tropical and semi-arid regions where humidity levels are persistently high. Their effectiveness in extending machinery life and minimizing downtime makes them the go-to choice for these environments.

The extreme environment applications segment is expected to witness the fastest growth in the coming years. This surge is driven by the increasing deployment of equipment in harsh conditions such as mining sites, offshore platforms, and remote renewable energy installations. These environments demand robust moisture and contaminant control solutions, prompting industries to adopt high-performance desiccant breathers that can withstand temperature fluctuations, high dust loads, and prolonged exposure to environmental stressors.

Gear Boxes to Exhibit Leading by Application

Gearboxes represent the leading application segment due to their extensive use across manufacturing, automotive, and power transmission sectors. These systems are highly sensitive to moisture, which can degrade lubricants and cause mechanical wear. The constant need for optimal lubrication and reduced downtime ensures consistent demand for moisture control solutions in gearboxes.

Oil-filled transformers are the fastest-growing segment of the application. As the energy sector continues to expand and modernize globally, especially in developing regions, the demand for efficient and durable transformer systems is rising. Moisture control is crucial in transformers to prevent dielectric breakdown, driving the adoption of advanced desiccant systems in this segment.

Industrial & Manufacturing to Exhibit Leading by End-Use

The industrial & manufacturing segment holds the dominant share among end-use industries. This dominance is driven by the widespread deployment of hydraulic systems, gearboxes, compressors, and lubricant reservoirs across various industrial machinery and automated manufacturing lines. These systems are particularly susceptible to contamination from airborne moisture and particles, which can compromise fluid quality and lead to equipment failure.

Windmills and wind power generation are the fastest-growing segment, driven by the global push toward renewable energy infrastructure. Wind turbines operate in challenging environments, offshore, coastal, or mountainous regions, where they are constantly exposed to high humidity, temperature fluctuations, and airborne salt or dust.

To ensure optimal operation and extend the life of gearboxes, nacelles, and transformer systems, desiccant breathers are increasingly being integrated as a preventive solution. The surge in wind power installations, especially in countries such as China, the U.S., Germany, and India, is accelerating demand.

Competitive Analysis

The desiccant air breathers market is becoming moderately competitive, with a mix of global filtration giants and niche manufacturers competing based on product performance, innovation, and pricing. Companies have established robust distribution networks, particularly in North America and Europe, and are recognized for offering a diverse portfolio of desiccant breathers tailored for industrial, energy, and mobile equipment applications. Market leaders consistently maintain a competitive edge through brand reliability, technical expertise, and a global reach.

Innovation remains the cornerstone of competition in this market. Companies like Des-Case and Donaldson have introduced high-capacity and smart desiccant breathers that offer longer service life, real-time monitoring, and advanced contamination control.

For instance, the introduction of IoT-enabled breathers, such as Regal Rexnord’s AirMax Pro Smart Breather, reflects the growing trend of integrating digital diagnostics for predictive maintenance. Such smart breathers help industries improve uptime, track moisture saturation remotely, and reduce unnecessary replacement cycles. This innovation-centric environment compels companies to invest in R&D to stay ahead of cost-driven regional competitors.

Strategic mergers, acquisitions, and partnerships also play a crucial role in shaping the competitive landscape. For example, Timken’s acquisition of Des-Case and Eaton’s acquisition of Tripp Lite have strengthened their respective positions in the filtration and power transmission segments. These moves allow companies to diversify offerings and enter new verticals. Meanwhile, in fast-growing regions like Asia-Pacific, many regional manufacturers focus on cost-effective solutions and volume production, offering competitive pricing to penetrate price-sensitive markets such as India and Southeast Asia.

Furthermore, companies are increasingly differentiating themselves through aftermarket services, customization, and sustainability. Several manufacturers now provide refillable, recyclable, or reusable breathers to align with environmental goals and customer cost-saving initiatives.

Service offerings such as breather replacement programs, fluid cleanliness monitoring, and system audits help companies establish long-term customer relationships. As industrial end-users become increasingly aware of the risks associated with fluid contamination and demand higher equipment uptime, companies that combine product innovation with service excellence are better positioned to lead in this evolving market.

Key players in the desiccant Air breathers market include Bosch Rexroth, Lubrication Engineers, Des-Case, Donaldson Company, Inc., Drytech Inc., Eaton, U.S. Lubricants, Heritage-Crystal Clean, Pall Corporation, AGM Container Controls Inc., Trico Corporation, Whitmore Manufacturing LLC, and other notable companies.

Recent Development

  • In September 2024, Fleetguard introduced a new high-efficiency desiccant air breather aimed at bulk fluid storage systems. It incorporates silica gel, polyurethane foam, micro-glass filtration media, and optional check valves. The design enhances protection against moisture and particulate ingress, which helps lower downtime and extend fluid life in large tanks and reservoirs.

Segmentation of Desiccant Air Breathers Market

  • By Silica Content :

    • < 0.5 lbs
    • 0.5 to 1.5 lbs
    • 1.5 to 2.5 lbs
    • 2.5 to 3.5 lbs
    • > 3.5 lbs
  • By Max. Water Capacity :

    • < 1 fl oz.
    • 1 to 5 fl oz.
    • 5 to 10 fl oz.
    • 10 to 15 fl oz.
    • 15 to 20 fl oz.
    • > 20 fl oz.
  • By Working Environment :

    • Disposable Stationary Applications
    • Limited Space Applications
    • High Humidity/High Dust Applications
    • Extreme Environment Applications
    • High Vibration Applications
    • Heavy Duty Applications
    • Caustic Fumes/Gaseous Applications
  • By Application :

    • Gear Boxes
    • Hydraulic Fluid Reservoirs
    • Bulk Storage Tanks
    • Oil Drums
    • Oil-filled Transformers
    • Other Fluid Reservoirs
  • By End-Use :

    • Wash-down Areas
    • Pulp & Paper Processing
    • Timber Processing
    • Windmills and Wind Power Generation
    • Construction & Mining Equipment
    • Mineral & Metal Processing
    • Material Handling & Hoisting Equipment
    • Agriculture & Forestry Equipment
    • Industrial & Manufacturing
    • Others
  • By Region :

    • North America
    • Latin America
    • Western Europe
    • Eastern Europe
    • East Asia
    • South Asia & Pacific
    • Middle East & Africa

Table of Content

  1. Executive Summary
    • Global Market Outlook
    • Demand-side Trends
    • Supply-side Trends
    • Technology Roadmap Analysis
    • Analysis and Recommendations
  2. Market Overview
    • Market Coverage / Taxonomy
    • Market Definition / Scope / Limitations
  3. Market Background
    • Market Dynamics
      • Drivers
      • Restraints
      • Opportunity
      • Trends
    • Scenario Forecast
      • Demand in Optimistic Scenario
      • Demand in Likely Scenario
      • Demand in Conservative Scenario
    • Opportunity Map Analysis
    • Product Life Cycle Analysis
    • Supply Chain Analysis
      • Supply Side Participants and their Roles
        • Producers
        • Mid-Level Participants (Traders/ Agents/ Brokers)
        • Wholesalers and Distributors
      • Value Added and Value Created at Node in the Supply Chain
      • List of Component Suppliers
      • List of Existing and Potential Buyers
    • Investment Feasibility Matrix
    • Value Chain Analysis
      • Profit Margin Analysis
      • Wholesalers and Distributors
    • PESTLE and Porter’s Analysis
    • Regulatory Landscape
      • By Key Regions
      • By Key Countries
    • Production and Consumption Statistics
    • Import and Export Statistics
  4. Global Market Analysis 2020 to 2024 and Forecast, 2025 to 2035
    • Historical Market Size Value (USD mn) & Volume (Units) Analysis, 2020 to 2024
    • Current and Future Market Size Value (USD mn) & Volume (Units) Projections, 2025 to 2035
      • Y-o-Y Growth Trend Analysis
      • Absolute $ Opportunity Analysis
  5. Global Market Pricing Analysis 2020 to 2024 and Forecast 2025 to 2035
  6. Global Market Analysis 2020 to 2024 and Forecast 2025 to 2035, By Silica Content
    • Introduction / Key Findings
    • Historical Market Size Value (USD mn) & Volume (Units) Analysis By Silica Content, 2020 to 2024
    • Current and Future Market Size Value (USD mn) & Volume (Units) Analysis and Forecast By Silica Content, 2025 to 2035
      • < 0.5 lbs
      • 0.5 to 1.5 lbs
      • 1.5 to 2.5 lbs
      • 2.5 to 3.5 lbs
      • > 3.5 lbs
    • Y-o-Y Growth Trend Analysis By Silica Content, 2020 to 2024
    • Absolute $ Opportunity Analysis By Silica Content, 2025 to 2035
  7. Global Market Analysis 2020 to 2024 and Forecast 2025 to 2035, By Max. Water Capacity
    • Introduction / Key Findings
    • Historical Market Size Value (USD mn) & Volume (Units) Analysis By Max. Water Capacity, 2020 to 2024
    • Current and Future Market Size Value (USD mn) & Volume (Units) Analysis and Forecast By Max. Water Capacity, 2025 to 2035
      • < 1 fl oz.
      • 1 to 5 fl oz.
      • 5 to 10 fl oz.
      • 10 to 15 fl oz.
      • 15 to 20 fl oz.
      • > 20 fl oz.
    • Y-o-Y Growth Trend Analysis By Max. Water Capacity, 2020 to 2024
    • Absolute $ Opportunity Analysis By Max. Water Capacity, 2025 to 2035
  8. Global Market Analysis 2020 to 2024 and Forecast 2025 to 2035, By Working Environment
    • Introduction / Key Findings
    • Historical Market Size Value (USD mn) & Volume (Units) Analysis By Working Environment, 2020 to 2024
    • Current and Future Market Size Value (USD mn) & Volume (Units) Analysis and Forecast By Working Environment, 2025 to 2035
      • Disposable Stationary Applications
      • Limited Space Applications
      • High Humidity/High Dust Applications
      • Extreme Environment Applications
      • High Vibration Applications
      • Heavy Duty Applications
      • Caustic Fumes/Gaseous Applications
    • Y-o-Y Growth Trend Analysis By Working Environment, 2020 to 2024
    • Absolute $ Opportunity Analysis By Working Environment, 2025 to 2035
  9. Global Market Analysis 2020 to 2024 and Forecast 2025 to 2035, By Application
    • Introduction / Key Findings
    • Historical Market Size Value (USD mn) & Volume (Units) Analysis By Application, 2020 to 2024
    • Current and Future Market Size Value (USD mn) & Volume (Units) Analysis and Forecast By Application, 2025 to 2035
      • Gear Boxes
      • Hydraulic Fluid Reservoirs
      • Bulk Storage Tanks
      • Oil Drums
      • Oil-filled Transformers
      • Other Fluid Reservoirs
    • Y-o-Y Growth Trend Analysis By Application, 2020 to 2024
    • Absolute $ Opportunity Analysis By Application, 2025 to 2035
  10. Global Market Analysis 2020 to 2024 and Forecast 2025 to 2035, By End-Use
    • Introduction / Key Findings
    • Historical Market Size Value (USD mn) & Volume (Units) Analysis By End-Use, 2020 to 2024
    • Current and Future Market Size Value (USD mn) & Volume (Units) Analysis and Forecast By End-Use, 2025 to 2035
      • Wash-down Areas
      • Pulp & Paper Processing
      • Timber Processing
      • Windmills and Wind Power Generation
      • Construction & Mining Equipment
      • Mineral & Metal Processing
      • Material Handling & Hoisting Equipment
      • Agriculture & Forestry Equipment
      • Industrial & Manufacturing
      • Others
    • Y-o-Y Growth Trend Analysis By End-Use, 2020 to 2024
    • Absolute $ Opportunity Analysis By End-Use, 2025 to 2035
  11. Global Market Analysis 2020 to 2024 and Forecast 2025 to 2035, By Region
    • Introduction
    • Historical Market Size Value (USD mn) & Volume (Units) Analysis By Region, 2020 to 2024
    • Current Market Size Value (USD mn) & Volume (Units) Analysis and Forecast By Region, 2025 to 2035
      • North America
      • Latin America
      • Western Europe
      • East Asia
      • South Asia Pacific
      • Eastern Europe
      • Middle East & Africa
    • Market Attractiveness Analysis By Region
  12. North America Market Analysis 2020 to 2024 and Forecast 2025 to 2035, By Country
    • Historical Market Size Value (USD mn) & Volume (Units) Trend Analysis By Market Taxonomy, 2020 to 2024
    • Market Size Value (USD mn) & Volume (Units) Forecast By Market Taxonomy, 2025 to 2035
      • By Country
        • U.S.
        • Canada
        • Mexico
      • By Silica Content
      • By Max. Water Capacity
      • By Working Environment
      • By Application
      • By End-Use
    • Market Attractiveness Analysis
      • By Country
      • By Silica Content
      • By Max. Water Capacity
      • By Working Environment
      • By Application
      • By End-Use
    • Key Takeaways
  13. Latin America Market Analysis 2020 to 2024 and Forecast 2025 to 2035, By Country
    • Historical Market Size Value (USD mn) & Volume (Units) Trend Analysis By Market Taxonomy, 2020 to 2024
    • Market Size Value (USD mn) & Volume (Units) Forecast By Market Taxonomy, 2025 to 2035
      • By Country
        • Brazil
        • Chile
        • Rest of Latin America
      • By Silica Content
      • By Max. Water Capacity
      • By Working Environment
      • By Application
      • By End-Use
    • Market Attractiveness Analysis
      • By Country
      • By Silica Content
      • By Max. Water Capacity
      • By Working Environment
      • By Application
      • By End-Use
    • Key Takeaways
  14. Western Europe Market Analysis 2020 to 2024 and Forecast 2025 to 2035, By Country
    • Historical Market Size Value (USD mn) & Volume (Units) Trend Analysis By Market Taxonomy, 2020 to 2024
    • Market Size Value (USD mn) & Volume (Units) Forecast By Market Taxonomy, 2025 to 2035
      • By Country
        • Germany
        • Italy
        • France
        • U.K.
        • Spain
        • Russia
        • BENELUX
        • Rest of Europe
      • By Silica Content
      • By Max. Water Capacity
      • By Working Environment
      • By Application
      • By End-Use
    • Market Attractiveness Analysis
      • By Country
      • By Silica Content
      • By Max. Water Capacity
      • By Working Environment
      • By Application
      • By End-Use
    • Key Takeaways
  15. East Asia Market Analysis 2020 to 2024 and Forecast 2025 to 2035, By Country
    • Historical Market Size Value (USD mn) & Volume (Units) Trend Analysis By Market Taxonomy, 2020 to 2024
    • Market Size Value (USD mn) & Volume (Units) Forecast By Market Taxonomy, 2025 to 2035
      • By Country
        • China
        • Japan
        • South Korea
      • By Silica Content
      • By Max. Water Capacity
      • By Working Environment
      • By Application
      • By End-Use
    • Market Attractiveness Analysis
      • By Country
      • By Silica Content
      • By Max. Water Capacity
      • By Working Environment
      • By Application
      • By End-Use
    • Key Takeaways
  16. South Asia Pacific Market Analysis 2020 to 2024 and Forecast 2025 to 2035, By Country
    • Historical Market Size Value (USD mn) & Volume (Units) Trend Analysis By Market Taxonomy, 2020 to 2024
    • Market Size Value (USD mn) & Volume (Units) Forecast By Market Taxonomy, 2025 to 2035
      • By Country
        • India
        • ASEAN Countries
        • Australia & New Zealand
        • Rest of South Asia Pacific
      • By Silica Content
      • By Max. Water Capacity
      • By Working Environment
      • By Application
      • By End-Use
    • Market Attractiveness Analysis
      • By Country
      • By Silica Content
      • By Max. Water Capacity
      • By Working Environment
      • By Application
      • By End-Use
    • Key Takeaways
  17. Eastern Europe Market Analysis 2020 to 2024 and Forecast 2025 to 2035, By Country
    • Historical Market Size Value (USD mn) & Volume (Units) Trend Analysis By Market Taxonomy, 2020 to 2024
    • Market Size Value (USD mn) & Volume (Units) Forecast By Market Taxonomy, 2025 to 2035
      • By Country
        • Russia
        • Poland
        • Hungary
        • Balkan & Baltics
        • Rest of Eastern Europe
      • By Silica Content
      • By Max. Water Capacity
      • By Working Environment
      • By Application
      • By End-Use
    • Market Attractiveness Analysis
      • By Country
      • By Silica Content
      • By Max. Water Capacity
      • By Working Environment
      • By Application
      • By End-Use
    • Key Takeaways
  18. Middle East & Africa Market Analysis 2020 to 2024 and Forecast 2025 to 2035, By Country
    • Historical Market Size Value (USD mn) & Volume (Units) Trend Analysis By Market Taxonomy, 2020 to 2024
    • Market Size Value (USD mn) & Volume (Units) Forecast By Market Taxonomy, 2025 to 2035
      • By Country
        • KSA
        • Other GCC Countries
        • Turkiye
        • South Africa
        • Rest of MEA
      • By Silica Content
      • By Max. Water Capacity
      • By Working Environment
      • By Application
      • By End-Use
    • Market Attractiveness Analysis
      • By Country
      • By Silica Content
      • By Max. Water Capacity
      • By Working Environment
      • By Application
      • By End-Use
    • Key Takeaways
  19. Key Countries Market Analysis
    • United States
      • Pricing Analysis
      • Market Share Analysis, 2024
        • By Silica Content
        • By Max. Water Capacity
        • By Working Environment
        • By Application
        • By End-Use
    • Germany
      • Pricing Analysis
      • Market Share Analysis, 2024
        • By Silica Content
        • By Max. Water Capacity
        • By Working Environment
        • By Application
        • By End-Use
    • China
      • Pricing Analysis
      • Market Share Analysis, 2024
        • By Silica Content
        • By Max. Water Capacity
        • By Working Environment
        • By Application
        • By End-Use
    • India
      • Pricing Analysis
      • Market Share Analysis, 2024
        • By Silica Content
        • By Max. Water Capacity
        • By Working Environment
        • By Application
        • By End-Use
    • Canada
      • Pricing Analysis
      • Market Share Analysis, 2024
        • By Silica Content
        • By Max. Water Capacity
        • By Working Environment
        • By Application
        • By End-Use
  20. Market Structure Analysis
    • Competition Dashboard
    • Competition Benchmarking
    • Market Share Analysis of Top Players
      • By Regional
      • By Silica Content
      • By Max. Water Capacity
      • By Working Environment
      • By Application
      • By End-Use
  21. Competition Analysis
    • Competition Deep Dive
      • Bosch Rexroth
        • Overview
        • Product Portfolio
        • Profitability by Market Segments (Product/Age /Sales Channel/Region)
        • Sales Footprint
        • Strategy Overview
          • Marketing Strategy
          • Product Strategy
          • Channel Strategy
      • Lubrication Engineers
        • Overview
        • Product Portfolio
        • Profitability by Market Segments (Product/Age /Sales Channel/Region)
        • Sales Footprint
        • Strategy Overview
          • Marketing Strategy
          • Product Strategy
          • Channel Strategy
      • Des-Case
        • Overview
        • Product Portfolio
        • Profitability by Market Segments (Product/Age /Sales Channel/Region)
        • Sales Footprint
        • Strategy Overview
          • Marketing Strategy
          • Product Strategy
          • Channel Strategy
      • Donaldson Company, Inc.
        • Overview
        • Product Portfolio
        • Profitability by Market Segments (Product/Age /Sales Channel/Region)
        • Sales Footprint
        • Strategy Overview
          • Marketing Strategy
          • Product Strategy
          • Channel Strategy
      • Drytech Inc.
        • Overview
        • Product Portfolio
        • Profitability by Market Segments (Product/Age /Sales Channel/Region)
        • Sales Footprint
        • Strategy Overview
          • Marketing Strategy
          • Product Strategy
          • Channel Strategy
  22. Assumptions & Acronyms Used
  23. Research Methodology

List Of Table

  • Table 1: Global Market Value (USD mn) Forecast by Region, 2020 to 2035
  • Table 2: Global Market Volume (Units) Forecast by Region, 2020 to 2035
  • Table 3: Global Market Value (USD mn) Forecast by Silica Content, 2020 to 2035
  • Table 4: Global Market Volume (Units) Forecast by Silica Content, 2020 to 2035
  • Table 5: Global Market Value (USD mn) Forecast by Max. Water Capacity, 2020 to 2035
  • Table 6: Global Market Volume (Units) Forecast by Max. Water Capacity, 2020 to 2035
  • Table 7: Global Market Value (USD mn) Forecast by Working Environment, 2020 to 2035
  • Table 8: Global Market Volume (Units) Forecast by Working Environment, 2020 to 2035
  • Table 9: Global Market Value (USD mn) Forecast by Application, 2020 to 2035
  • Table 10: Global Market Volume (Units) Forecast by Application, 2020 to 2035
  • Table 11: Global Market Value (USD mn) Forecast by End-Use, 2020 to 2035
  • Table 12: Global Market Volume (Units) Forecast by End-Use, 2020 to 2035
  • Table 13: North America Market Value (USD mn) Forecast by Country, 2020 to 2035
  • Table 14: North America Market Volume (Units) Forecast by Country, 2020 to 2035
  • Table 15: North America Market Value (USD mn) Forecast by Silica Content, 2020 to 2035
  • Table 16: North America Market Volume (Units) Forecast by Silica Content, 2020 to 2035
  • Table 17: North America Market Value (USD mn) Forecast by Max. Water Capacity, 2020 to 2035
  • Table 18: North America Market Volume (Units) Forecast by Max. Water Capacity, 2020 to 2035
  • Table 19: North America Market Value (USD mn) Forecast by Working Environment, 2020 to 2035
  • Table 20: North America Market Volume (Units) Forecast by Working Environment, 2020 to 2035
  • Table 21: North America Market Value (USD mn) Forecast by Application, 2020 to 2035
  • Table 22: North America Market Volume (Units) Forecast by Application, 2020 to 2035
  • Table 23: North America Market Value (USD mn) Forecast by End-Use, 2020 to 2035
  • Table 24: North America Market Volume (Units) Forecast by End-Use, 2020 to 2035
  • Table 25: Latin America Market Value (USD mn) Forecast by Country, 2020 to 2035
  • Table 26: Latin America Market Volume (Units) Forecast by Country, 2020 to 2035
  • Table 27: Latin America Market Value (USD mn) Forecast by Silica Content, 2020 to 2035
  • Table 28: Latin America Market Volume (Units) Forecast by Silica Content, 2020 to 2035
  • Table 29: Latin America Market Value (USD mn) Forecast by Max. Water Capacity, 2020 to 2035
  • Table 30: Latin America Market Volume (Units) Forecast by Max. Water Capacity, 2020 to 2035
  • Table 31: Latin America Market Value (USD mn) Forecast by Working Environment, 2020 to 2035
  • Table 32: Latin America Market Volume (Units) Forecast by Working Environment, 2020 to 2035
  • Table 33: Latin America Market Value (USD mn) Forecast by Application, 2020 to 2035
  • Table 34: Latin America Market Volume (Units) Forecast by Application, 2020 to 2035
  • Table 35: Latin America Market Value (USD mn) Forecast by End-Use, 2020 to 2035
  • Table 36: Latin America Market Volume (Units) Forecast by End-Use, 2020 to 2035
  • Table 37: Western Europe Market Value (USD mn) Forecast by Country, 2020 to 2035
  • Table 38: Western Europe Market Volume (Units) Forecast by Country, 2020 to 2035
  • Table 39: Western Europe Market Value (USD mn) Forecast by Silica Content, 2020 to 2035
  • Table 40: Western Europe Market Volume (Units) Forecast by Silica Content, 2020 to 2035
  • Table 41: Western Europe Market Value (USD mn) Forecast by Max. Water Capacity, 2020 to 2035
  • Table 42: Western Europe Market Volume (Units) Forecast by Max. Water Capacity, 2020 to 2035
  • Table 43: Western Europe Market Value (USD mn) Forecast by Working Environment, 2020 to 2035
  • Table 44: Western Europe Market Volume (Units) Forecast by Working Environment, 2020 to 2035
  • Table 45: Western Europe Market Value (USD mn) Forecast by Application, 2020 to 2035
  • Table 46: Western Europe Market Volume (Units) Forecast by Application, 2020 to 2035
  • Table 47: Western Europe Market Value (USD mn) Forecast by End-Use, 2020 to 2035
  • Table 48: Western Europe Market Volume (Units) Forecast by End-Use, 2020 to 2035
  • Table 49: East Asia Market Value (USD mn) Forecast by Country, 2020 to 2035
  • Table 50: East Asia Market Volume (Units) Forecast by Country, 2020 to 2035
  • Table 51: East Asia Market Value (USD mn) Forecast by Silica Content, 2020 to 2035
  • Table 52: East Asia Market Volume (Units) Forecast by Silica Content, 2020 to 2035
  • Table 53: East Asia Market Value (USD mn) Forecast by Max. Water Capacity, 2020 to 2035
  • Table 54: East Asia Market Volume (Units) Forecast by Max. Water Capacity, 2020 to 2035
  • Table 55: East Asia Market Value (USD mn) Forecast by Working Environment, 2020 to 2035
  • Table 56: East Asia Market Volume (Units) Forecast by Working Environment, 2020 to 2035
  • Table 57: East Asia Market Value (USD mn) Forecast by Application, 2020 to 2035
  • Table 58: East Asia Market Volume (Units) Forecast by Application, 2020 to 2035
  • Table 59: East Asia Market Value (USD mn) Forecast by End-Use, 2020 to 2035
  • Table 60: East Asia Market Volume (Units) Forecast by End-Use, 2020 to 2035
  • Table 61: South Asia Pacific Market Value (USD mn) Forecast by Country, 2020 to 2035
  • Table 62: South Asia Pacific Market Volume (Units) Forecast by Country, 2020 to 2035
  • Table 63: South Asia Pacific Market Value (USD mn) Forecast by Silica Content, 2020 to 2035
  • Table 64: South Asia Pacific Market Volume (Units) Forecast by Silica Content, 2020 to 2035
  • Table 65: South Asia Pacific Market Value (USD mn) Forecast by Max. Water Capacity, 2020 to 2035
  • Table 66: South Asia Pacific Market Volume (Units) Forecast by Max. Water Capacity, 2020 to 2035
  • Table 67: South Asia Pacific Market Value (USD mn) Forecast by Working Environment, 2020 to 2035
  • Table 68: South Asia Pacific Market Volume (Units) Forecast by Working Environment, 2020 to 2035
  • Table 69: South Asia Pacific Market Value (USD mn) Forecast by Application, 2020 to 2035
  • Table 70: South Asia Pacific Market Volume (Units) Forecast by Application, 2020 to 2035
  • Table 71: South Asia Pacific Market Value (USD mn) Forecast by End-Use, 2020 to 2035
  • Table 72: South Asia Pacific Market Volume (Units) Forecast by End-Use, 2020 to 2035
  • Table 73: Eastern Europe Market Value (USD mn) Forecast by Country, 2020 to 2035
  • Table 74: Eastern Europe Market Volume (Units) Forecast by Country, 2020 to 2035
  • Table 75: Eastern Europe Market Value (USD mn) Forecast by Silica Content, 2020 to 2035
  • Table 76: Eastern Europe Market Volume (Units) Forecast by Silica Content, 2020 to 2035
  • Table 77: Eastern Europe Market Value (USD mn) Forecast by Max. Water Capacity, 2020 to 2035
  • Table 78: Eastern Europe Market Volume (Units) Forecast by Max. Water Capacity, 2020 to 2035
  • Table 79: Eastern Europe Market Value (USD mn) Forecast by Working Environment, 2020 to 2035
  • Table 80: Eastern Europe Market Volume (Units) Forecast by Working Environment, 2020 to 2035
  • Table 81: Eastern Europe Market Value (USD mn) Forecast by Application, 2020 to 2035
  • Table 82: Eastern Europe Market Volume (Units) Forecast by Application, 2020 to 2035
  • Table 83: Eastern Europe Market Value (USD mn) Forecast by End-Use, 2020 to 2035
  • Table 84: Eastern Europe Market Volume (Units) Forecast by End-Use, 2020 to 2035
  • Table 85: Middle East & Africa Market Value (USD mn) Forecast by Country, 2020 to 2035
  • Table 86: Middle East & Africa Market Volume (Units) Forecast by Country, 2020 to 2035
  • Table 87: Middle East & Africa Market Value (USD mn) Forecast by Silica Content, 2020 to 2035
  • Table 88: Middle East & Africa Market Volume (Units) Forecast by Silica Content, 2020 to 2035
  • Table 89: Middle East & Africa Market Value (USD mn) Forecast by Max. Water Capacity, 2020 to 2035
  • Table 90: Middle East & Africa Market Volume (Units) Forecast by Max. Water Capacity, 2020 to 2035
  • Table 91: Middle East & Africa Market Value (USD mn) Forecast by Working Environment, 2020 to 2035
  • Table 92: Middle East & Africa Market Volume (Units) Forecast by Working Environment, 2020 to 2035
  • Table 93: Middle East & Africa Market Value (USD mn) Forecast by Application, 2020 to 2035
  • Table 94: Middle East & Africa Market Volume (Units) Forecast by Application, 2020 to 2035
  • Table 95: Middle East & Africa Market Value (USD mn) Forecast by End-Use, 2020 to 2035
  • Table 96: Middle East & Africa Market Volume (Units) Forecast by End-Use, 2020 to 2035

List Of Figures

  • Figure 1: Global Market Volume (Units) Forecast 2020 to 2035
  • Figure 2: Global Market Pricing Analysis
  • Figure 3: Global Market Value (USD mn) Forecast 2020 to 2035
  • Figure 4: Global Market Value Share and BPS Analysis by Silica Content, 2025 and 2035
  • Figure 5: Global Market Y-o-Y Growth Comparison by Silica Content, 2025 to 2035
  • Figure 6: Global Market Attractiveness Analysis by Silica Content
  • Figure 7: Global Market Value Share and BPS Analysis by Max. Water Capacity, 2025 and 2035
  • Figure 8: Global Market Y-o-Y Growth Comparison by Max. Water Capacity, 2025 to 2035
  • Figure 9: Global Market Attractiveness Analysis by Max. Water Capacity
  • Figure 10: Global Market Value Share and BPS Analysis by Working Environment, 2025 and 2035
  • Figure 11: Global Market Y-o-Y Growth Comparison by Working Environment, 2025 to 2035
  • Figure 12: Global Market Attractiveness Analysis by Working Environment
  • Figure 13: Global Market Value Share and BPS Analysis by Application, 2025 and 2035
  • Figure 14: Global Market Y-o-Y Growth Comparison by Application, 2025 to 2035
  • Figure 15: Global Market Attractiveness Analysis by Application
  • Figure 16: Global Market Value Share and BPS Analysis by End-Use, 2025 and 2035
  • Figure 17: Global Market Y-o-Y Growth Comparison by End-Use, 2025 to 2035
  • Figure 18: Global Market Attractiveness Analysis by End-Use
  • Figure 19: Global Market Value (USD mn) Share and BPS Analysis by Region, 2025 and 2035
  • Figure 20: Global Market Y-o-Y Growth Comparison by Region, 2025 to 2035
  • Figure 21: Global Market Attractiveness Analysis by Region
  • Figure 22: North America Market Incremental $ Opportunity, 2025 to 2035
  • Figure 23: Latin America Market Incremental $ Opportunity, 2025 to 2035
  • Figure 24: Western Europe Market Incremental $ Opportunity, 2025 to 2035
  • Figure 25: East Asia Market Incremental $ Opportunity, 2025 to 2035
  • Figure 26: South Asia Pacific Market Incremental $ Opportunity, 2025 to 2035
  • Figure 27: Eastern Europe Market Incremental $ Opportunity, 2025 to 2035
  • Figure 28: Middle East & Africa Market Incremental $ Opportunity, 2025 to 2035
  • Figure 29: North America Market Value Share and BPS Analysis by Country, 2025 and 2035
  • Figure 30: North America Market Value Share and BPS Analysis by Silica Content, 2025 and 2035
  • Figure 31: North America Market Y-o-Y Growth Comparison by Silica Content, 2025 to 2035
  • Figure 32: North America Market Attractiveness Analysis by Silica Content
  • Figure 33: North America Market Value Share and BPS Analysis by Max. Water Capacity, 2025 and 2035
  • Figure 34: North America Market Y-o-Y Growth Comparison by Max. Water Capacity, 2025 to 2035
  • Figure 35: North America Market Attractiveness Analysis by Max. Water Capacity
  • Figure 36: North America Market Value Share and BPS Analysis by Working Environment, 2025 and 2035
  • Figure 37: North America Market Y-o-Y Growth Comparison by Working Environment, 2025 to 2035
  • Figure 38: North America Market Attractiveness Analysis by Working Environment
  • Figure 39: North America Market Value Share and BPS Analysis by Application, 2025 and 2035
  • Figure 40: North America Market Y-o-Y Growth Comparison by Application, 2025 to 2035
  • Figure 41: North America Market Attractiveness Analysis by Application
  • Figure 42: North America Market Value Share and BPS Analysis by End-Use, 2025 and 2035
  • Figure 43: North America Market Y-o-Y Growth Comparison by End-Use, 2025 to 2035
  • Figure 44: North America Market Attractiveness Analysis by End-Use
  • Figure 45: Latin America Market Value Share and BPS Analysis by Country, 2025 and 2035
  • Figure 46: Latin America Market Value Share and BPS Analysis by Silica Content, 2025 and 2035
  • Figure 47: Latin America Market Y-o-Y Growth Comparison by Silica Content, 2025 to 2035
  • Figure 48: Latin America Market Attractiveness Analysis by Silica Content
  • Figure 49: Latin America Market Value Share and BPS Analysis by Max. Water Capacity, 2025 and 2035
  • Figure 50: Latin America Market Y-o-Y Growth Comparison by Max. Water Capacity, 2025 to 2035
  • Figure 51: Latin America Market Attractiveness Analysis by Max. Water Capacity
  • Figure 52: Latin America Market Value Share and BPS Analysis by Working Environment, 2025 and 2035
  • Figure 53: Latin America Market Y-o-Y Growth Comparison by Working Environment, 2025 to 2035
  • Figure 54: Latin America Market Attractiveness Analysis by Working Environment
  • Figure 55: Latin America Market Value Share and BPS Analysis by Application, 2025 and 2035
  • Figure 56: Latin America Market Y-o-Y Growth Comparison by Application, 2025 to 2035
  • Figure 57: Latin America Market Attractiveness Analysis by Application
  • Figure 58: Latin America Market Value Share and BPS Analysis by End-Use, 2025 and 2035
  • Figure 59: Latin America Market Y-o-Y Growth Comparison by End-Use, 2025 to 2035
  • Figure 60: Latin America Market Attractiveness Analysis by End-Use
  • Figure 61: Western Europe Market Value Share and BPS Analysis by Country, 2025 and 2035
  • Figure 62: Western Europe Market Value Share and BPS Analysis by Silica Content, 2025 and 2035
  • Figure 63: Western Europe Market Y-o-Y Growth Comparison by Silica Content, 2025 to 2035
  • Figure 64: Western Europe Market Attractiveness Analysis by Silica Content
  • Figure 65: Western Europe Market Value Share and BPS Analysis by Max. Water Capacity, 2025 and 2035
  • Figure 66: Western Europe Market Y-o-Y Growth Comparison by Max. Water Capacity, 2025 to 2035
  • Figure 67: Western Europe Market Attractiveness Analysis by Max. Water Capacity
  • Figure 68: Western Europe Market Value Share and BPS Analysis by Working Environment, 2025 and 2035
  • Figure 69: Western Europe Market Y-o-Y Growth Comparison by Working Environment, 2025 to 2035
  • Figure 70: Western Europe Market Attractiveness Analysis by Working Environment
  • Figure 71: Western Europe Market Value Share and BPS Analysis by Application, 2025 and 2035
  • Figure 72: Western Europe Market Y-o-Y Growth Comparison by Application, 2025 to 2035
  • Figure 73: Western Europe Market Attractiveness Analysis by Application
  • Figure 74: Western Europe Market Value Share and BPS Analysis by End-Use, 2025 and 2035
  • Figure 75: Western Europe Market Y-o-Y Growth Comparison by End-Use, 2025 to 2035
  • Figure 76: Western Europe Market Attractiveness Analysis by End-Use
  • Figure 77: East Asia Market Value Share and BPS Analysis by Country, 2025 and 2035
  • Figure 78: East Asia Market Value Share and BPS Analysis by Silica Content, 2025 and 2035
  • Figure 79: East Asia Market Y-o-Y Growth Comparison by Silica Content, 2025 to 2035
  • Figure 80: East Asia Market Attractiveness Analysis by Silica Content
  • Figure 81: East Asia Market Value Share and BPS Analysis by Max. Water Capacity, 2025 and 2035
  • Figure 82: East Asia Market Y-o-Y Growth Comparison by Max. Water Capacity, 2025 to 2035
  • Figure 83: East Asia Market Attractiveness Analysis by Max. Water Capacity
  • Figure 84: East Asia Market Value Share and BPS Analysis by Working Environment, 2025 and 2035
  • Figure 85: East Asia Market Y-o-Y Growth Comparison by Working Environment, 2025 to 2035
  • Figure 86: East Asia Market Attractiveness Analysis by Working Environment
  • Figure 87: East Asia Market Value Share and BPS Analysis by Application, 2025 and 2035
  • Figure 88: East Asia Market Y-o-Y Growth Comparison by Application, 2025 to 2035
  • Figure 89: East Asia Market Attractiveness Analysis by Application
  • Figure 90: East Asia Market Value Share and BPS Analysis by End-Use, 2025 and 2035
  • Figure 91: East Asia Market Y-o-Y Growth Comparison by End-Use, 2025 to 2035
  • Figure 92: East Asia Market Attractiveness Analysis by End-Use
  • Figure 93: South Asia Pacific Market Value Share and BPS Analysis by Country, 2025 and 2035
  • Figure 94: South Asia Pacific Market Value Share and BPS Analysis by Silica Content, 2025 and 2035
  • Figure 95: South Asia Pacific Market Y-o-Y Growth Comparison by Silica Content, 2025 to 2035
  • Figure 96: South Asia Pacific Market Attractiveness Analysis by Silica Content
  • Figure 97: South Asia Pacific Market Value Share and BPS Analysis by Max. Water Capacity, 2025 and 2035
  • Figure 98: South Asia Pacific Market Y-o-Y Growth Comparison by Max. Water Capacity, 2025 to 2035
  • Figure 99: South Asia Pacific Market Attractiveness Analysis by Max. Water Capacity
  • Figure 100: South Asia Pacific Market Value Share and BPS Analysis by Working Environment, 2025 and 2035
  • Figure 101: South Asia Pacific Market Y-o-Y Growth Comparison by Working Environment, 2025 to 2035
  • Figure 102: South Asia Pacific Market Attractiveness Analysis by Working Environment
  • Figure 103: South Asia Pacific Market Value Share and BPS Analysis by Application, 2025 and 2035
  • Figure 104: South Asia Pacific Market Y-o-Y Growth Comparison by Application, 2025 to 2035
  • Figure 105: South Asia Pacific Market Attractiveness Analysis by Application
  • Figure 106: South Asia Pacific Market Value Share and BPS Analysis by End-Use, 2025 and 2035
  • Figure 107: South Asia Pacific Market Y-o-Y Growth Comparison by End-Use, 2025 to 2035
  • Figure 108: South Asia Pacific Market Attractiveness Analysis by End-Use
  • Figure 109: Eastern Europe Market Value Share and BPS Analysis by Country, 2025 and 2035
  • Figure 110: Eastern Europe Market Value Share and BPS Analysis by Silica Content, 2025 and 2035
  • Figure 111: Eastern Europe Market Y-o-Y Growth Comparison by Silica Content, 2025 to 2035
  • Figure 112: Eastern Europe Market Attractiveness Analysis by Silica Content
  • Figure 113: Eastern Europe Market Value Share and BPS Analysis by Max. Water Capacity, 2025 and 2035
  • Figure 114: Eastern Europe Market Y-o-Y Growth Comparison by Max. Water Capacity, 2025 to 2035
  • Figure 115: Eastern Europe Market Attractiveness Analysis by Max. Water Capacity
  • Figure 116: Eastern Europe Market Value Share and BPS Analysis by Working Environment, 2025 and 2035
  • Figure 117: Eastern Europe Market Y-o-Y Growth Comparison by Working Environment, 2025 to 2035
  • Figure 118: Eastern Europe Market Attractiveness Analysis by Working Environment
  • Figure 119: Eastern Europe Market Value Share and BPS Analysis by Application, 2025 and 2035
  • Figure 120: Eastern Europe Market Y-o-Y Growth Comparison by Application, 2025 to 2035
  • Figure 121: Eastern Europe Market Attractiveness Analysis by Application
  • Figure 122: Eastern Europe Market Value Share and BPS Analysis by End-Use, 2025 and 2035
  • Figure 123: Eastern Europe Market Y-o-Y Growth Comparison by End-Use, 2025 to 2035
  • Figure 124: Eastern Europe Market Attractiveness Analysis by End-Use
  • Figure 125: Middle East & Africa Market Value Share and BPS Analysis by Country, 2025 and 2035
  • Figure 126: Middle East & Africa Market Value Share and BPS Analysis by Silica Content, 2025 and 2035
  • Figure 127: Middle East & Africa Market Y-o-Y Growth Comparison by Silica Content, 2025 to 2035
  • Figure 128: Middle East & Africa Market Attractiveness Analysis by Silica Content
  • Figure 129: Middle East & Africa Market Value Share and BPS Analysis by Max. Water Capacity, 2025 and 2035
  • Figure 130: Middle East & Africa Market Y-o-Y Growth Comparison by Max. Water Capacity, 2025 to 2035
  • Figure 131: Middle East & Africa Market Attractiveness Analysis by Max. Water Capacity
  • Figure 132: Middle East & Africa Market Value Share and BPS Analysis by Working Environment, 2025 and 2035
  • Figure 133: Middle East & Africa Market Y-o-Y Growth Comparison by Working Environment, 2025 to 2035
  • Figure 134: Middle East & Africa Market Attractiveness Analysis by Working Environment
  • Figure 135: Middle East & Africa Market Value Share and BPS Analysis by Application, 2025 and 2035
  • Figure 136: Middle East & Africa Market Y-o-Y Growth Comparison by Application, 2025 to 2035
  • Figure 137: Middle East & Africa Market Attractiveness Analysis by Application
  • Figure 138: Middle East & Africa Market Value Share and BPS Analysis by End-Use, 2025 and 2035
  • Figure 139: Middle East & Africa Market Y-o-Y Growth Comparison by End-Use, 2025 to 2035
  • Figure 140: Middle East & Africa Market Attractiveness Analysis by End-Use
  • Figure 141: Global Market - Tier Structure Analysis
  • Figure 142: Global Market - Company Share Analysis

- FAQs -

What is the Global Desiccant Air Breathers Market size in 2025?

The desiccant air breathers market is valued at USD 795.8 million in 2025.

Who are the Major Players Operating in the Desiccant Air Breathers Market?

Prominent players in the market include Bosch Rexroth, Lubrication Engineers, Des-Case, Donaldson Company, Inc., and Drytech Inc.

What is the Estimated Valuation of the Desiccant Air Breathers Market by 2035?

The market is expected to reach a valuation of USD 1,425.2 million by 2035.

What value CAGR is the Desiccant Air Breathers Market Exhibit Over the Last Five Years?

The growth rate of the desiccant air breathers market is 6.0% from 2020 to 2024.

Desiccant Air Breathers Market

Schedule a Call