Air Flow Sensor Market
Air Flow Sensor Market Analysis, By Type, By Flow Range, By Mounting, By Application, By End-Use Industry, and Region - Market Insights 2025 to 2035
Analysis of Air Flow Sensor Market Covering 30+ Countries Including Analysis of US, Canada, UK, Germany, France, Nordics, GCC countries, Japan, Korea and many more.
Air Flow Sensor Market Outlook (2025 to 2035)
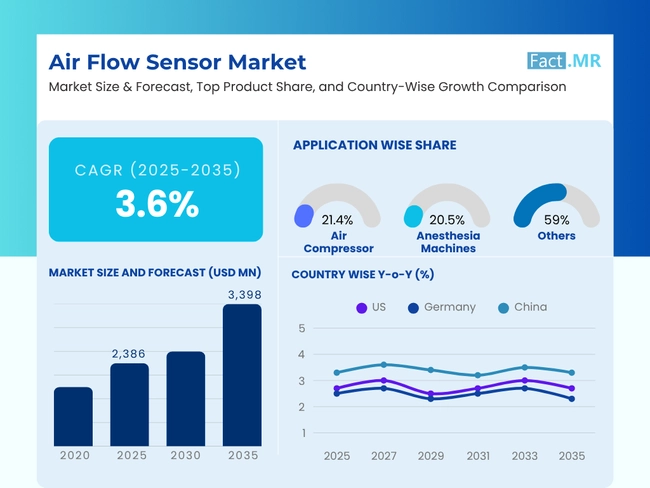
The global airflow sensor market is forecasted to reach USD 3,398 million in 2035, up from an estimated USD 2,386 million in 2025. During the forecast period of 2025 to 2035, the market is expected to grow with a CAGR of 3.6%. Measurable developments are influencing demand in airflow monitoring requirements for HVAC systems, engine air intake systems, and smart ventilation installations. The health policy and industrial performance standards are playing a central role in adoption in the industries.
Don't Need a Global Report?
save 40%! on Country & Region specific reports
What factors are shaping the demand for air flow sensors?
The demand for accuracy in process control based on flow is increasing. For example, as per the USA Environmental Protection Agency (EPA) and European Environment Agency (EEA), industries like chemical processing and automotive manufacturing are required to certify mass flow or volumetric air flow for fuel-air mixture control, leak detection, and workplace air quality control to meet the mandated regulations.
The growing demand in the automotive industry is a key factor driving the market for air flow sensors. In the automotive industry, a total of 52 million mass air flow (MAF) sensors were fitted in internal combustion engine vehicles worldwide in 2024. They are necessary to optimize real-time combustion and CO2 control, as required by Euro 6/7 and BS-VI standards. Thermal mass sensors continue to dominate this category because of their rapid signal response and dependability under pulsating flow.
Additionally, the adoption of HVAC systems is also increasing, resulting in a rise in demand for these sensors. For instance, the U.S. Department of Energy (DOE) reports that more than 35% of large commercial HVAC systems have retrofitted airflow sensors to enable demand-controlled ventilation and compliance with ASHRAE 62.1. The sensors reduce fan energy use by as much as 20-25%, a reduction validated by DOE Building America case studies.
What are the regional patterns in the air flow sensor market?
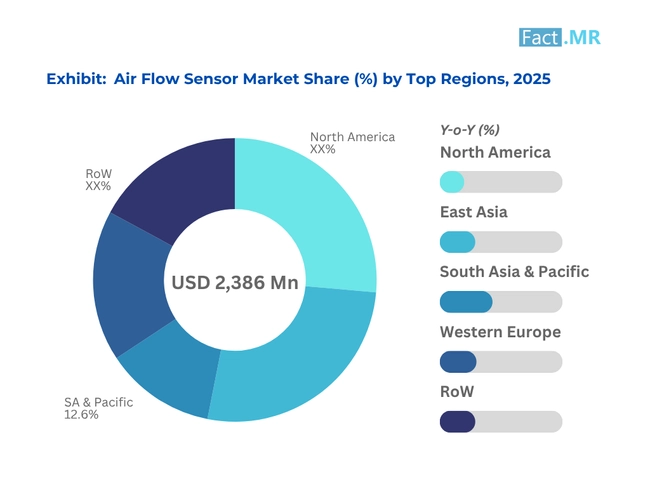
In North America, the emphasis on energy-efficient commercial spaces has increased demand for digital airflow sensors. To achieve 20 percent portfolio-wide energy savings, the Better Buildings Initiative recommends that airflow measurement be conducted as a necessary step before this goal can be reached. USA hospitals and labs, adhering to CDC infection control protocols, are installing mass air flow sensors in surgical zones, isolation rooms, and cleanroom facilities.
In Europe, there is renewed enforcement of the Ecodesign directive (EU 2017/1369) that requires ventilation units with rated power exceeding 30W to be able to operate with airflow modulation advanced through precise sensing technologies. Manufacturers in Germany and France have shifted towards hot-film and vortex-type sensors, which meet flow accuracy thresholds of ±1.5% FS even under humid conditions.
In the Asia-Pacific region, China’s State Administration for Market Regulation (SAMR) has revised industrial ventilation standards, accelerating the deployment of airflow sensors in electronics manufacturing and hospital HVAC retrofits. Japan’s METI reported a 12% YoY rise in locally produced flow sensors for medical ventilators in 2024, responding to both pandemic preparedness and export demand.
More Insights, Lesser Cost (-50% off)
Insights on import/export production,
pricing analysis, and more – Only @ Fact.MR
What challenges hinder broader deployment?
Some longstanding issues have continued to affect the scalability and reassurance of the air flow sensor technologies, especially when it comes to the industrial and high demand situations. One critical limitation lies in the performance of vane and hot-wire sensor types at lower cost points. Field data from VDI (Germany) indicates that cumulative calibration drift in such sensors can exceed ±4% over a 12-month cycle, introducing significant measurement uncertainty in process-critical environments.
Integrating the systems further presents some challenges since the signal is not standardized. The coexistence of analog and digital sensor outputs often necessitates the use of intermediary interface circuits or signal converters. This further complicates deployment (in particular in plants that have legacy PLC-based automation systems) where the cost of retrofit and integration risk are of particular concern.
A major limitation still exists in environmental robustness. In particulate-intensive settings such as mining ventilation systems and food processing plants, sensor elements are prone to clogging and thermal lag. This type of interference could either alter responses in real time or the accuracy of measurements. Although a hot-wire sensor has high precision, it cannot be used during times of high dust because it is sensitive to dust deposits, which require frequent recalibration, thereby adding an overhead cost and limiting uptime.
Country-Wise Outlook
The United States mandates precision flow sensing in HVAC retrofits and medical systems
In the USA, air flow sensors are critical components in both retrofit and new installations, mandated under ASHRAE Standard 170 and NFPA 99, which govern air changes and ventilation safety in healthcare settings. Such regulations require real-time measurement of airflow in controlled areas, such as isolation rooms, surgical theaters, and intensive care units. According to the EIA, over 22,000 commercial buildings implemented sensor retrofits in 2023 as part of energy performance upgrades and IAQ compliance strategies.
The medical device industry is a key growth segment, with over 1.1 million ventilators incorporating digital SLPM-calibrated sensors annually for accurate airflow control in respiratory care. These sensors typically operate within a 0-100 SLPM range and support feedback-driven dose and pressure regulation.
Furthermore, increased use cases in VAV systems, demand-controlled ventilation, and real-time IAQ dashboards are growing alongside the development of smart building platforms and decarbonization mandates, and this is why precision airflow sensing becomes an important aspect of any building automation strategies.
Germany adopts smart air flow sensing in Industry 4.0 and chemical sectors
Germany’s leadership in industrial automation is reflected in its early and widespread adoption of advanced air flow sensing systems. Under TA Luft emission regulations and VDI 6022 indoor air quality standards, industries are required to install and calibrate air and gas flow sensors for environmental compliance and workplace safety.
In 2024, more than 6,500 industrial facilities nationwide reported using real-time air or gas flow sensors, particularly in the chemical manufacturing, biotech, and pharmaceutical sectors. These sensors are integrated into smart control architectures to enable real-time monitoring of cleanrooms, exhaust systems, and chemical processing lines. The Effizienzbonus Industrie scheme is actively supporting this shift by subsidizing sensor retrofits with high energy-efficiency potential.
As industrial facilities digitize under Industry 4.0, many are embedding flow sensors into OPC-UA and MQTT-based networks for seamless connectivity with cloud analytics, digital twins, and predictive maintenance platforms, ensuring process continuity and regulatory compliance.
China accelerates localized sensor production for transportation and OEM ventilation
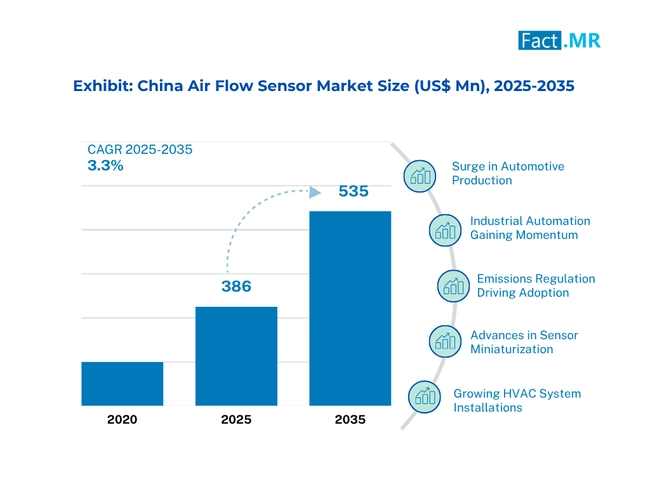
China leads global production of air flow sensors, exceeding 45 million units in 2024, primarily for automotive engine air intake systems, HVAC modules, and OEM industrial platforms. This surge is backed by the government’s long-term Sensor Innovation Roadmap (MIIT), which targets an 18% CAGR in high-precision digital sensor manufacturing through 2030. The central interest would be the development of MEMS-based technologies and two-mode sensing platforms (mass + volumetric) optimized to support compact, low-power applications.
Chinese OEMs are embedding these sensors into electric vehicles, smart appliances, and industrial automation systems to meet both export standards and domestic performance expectations. In transportation, air flow sensors support real-time combustion optimization and emissions reduction in line with CN VI regulations.
Meanwhile, domestic production helps minimize the need for imported sensor cores and achieves much wider geopolitical interests concerning technological self-reliance. Sensor R&D and semiconductor packaging pilot zones, which the government funds, are also missions to enable the expedited time-to-market of next-gen airflow modules.
Know thy Competitors
Competitive landscape highlights only certain players
Complete list available upon request
Category-Wise Analysis
Hot wire and hot film sensors remain dominant in precision applications
Hot wire and hot film air flow sensors jointly accounted for more than 41% of global market revenue in 2024, owing to their strong accuracy profiles (±1-2%) and ultra-fast response times of under 50 milliseconds. Their principal operation is founded on the principle of thermal transfer, which allows accurate readings to be taken on quick-varying/or pulsatile airflows.
These characteristics combining with their low cost make them the sensor of choice in high performance applications such as automobiles (air intake control), CPAP and ventilators (regulation of the airflow), and process industries (gas flow metering).
Combining with digital signal conditioning circuits, these sensors can become small, and offer intelligent data output, which then increases compatibility with both embedded devices and wireless telemetry nodes now appearing within OEM platforms.
HVAC application will register a rapid growth during the forecast period
Regarding the built environment, HVAC systems are being rapidly adopted with a CAGR of 4.6% driven by growing mandates for indoor air quality, energy efficiency regulations, and smart ventilation systems in commercial buildings, healthcare facilities, and industrial plants.
Driven by stricter IAQ standards and decarbonization goals, airflow sensors have become the main feature of intelligent building automation, allowing control of the variable air volume (VAV), adjust ventilation based on occupancy, as well as monitor the efficiency of filters. Primarily the system finds its application in schools, hospitals and commercial complexes.
Fixture-mounted configurations dominate high-volume installations
Around 70% of air flow sensors sold in 2024 were configured as permanent mount units. They can be installed in ducting, manifolds, or flow cells to provide continuous feedback in terms of data in commercial buildings and industrial plants. These sensors are essential in pharma cleanrooms, semiconductor fabs, data centers, and chemical plants, where precise and reliable flow monitoring is tied directly to process quality, safety, and regulatory approval.
Competitive Analysis
The air flow sensor market is populated by a mix of global electronics giants and focused sensor specialists. Key players are scaling up both vertical integration and domain-specific sensor adaptation. As another example, Bosch and DENSO are still the leaders in automotive area of intake sensing, where they are capable of reaching volumes over 15 mill/year with mass production. Siemens and Honeywell dominate the building automation and industrial safety segments, deploying sensors with BACnet and Modbus support.
MEMS-based digital airflow sensors are being offered by companies such as Sensata Technologies, TE Connectivity, and Omron, are focusing on miniaturized, energy-efficient units suitable for battery-operated equipment. Delphin (PHINIA Inc) and Aalborg Instruments remain active in mid-range industrial systems, offering thermal dispersion sensors with analog outputs and explosion-proof housings.
In healthcare, Hitachi Astemo, Degree Controls Inc, and Posifa Technologies are supporting ventilator and anesthesia machine OEMs with ultralow-SLPM precision sensors, some calibrated for flows below 5 SLPM with error margins under ±0.8%.
Strategic initiatives include co-design of sensing modules with HVAC equipment manufacturers, ASIC integration for smart control units, and IP filing in dual-mode thermal sensors. There has also been a move towards low-drift, self-cleaning versions to use under conditions of high levels of corrosiveness or humidity.
Key players in the market include DENSO, HELLA GmbH & Co. KGaA, Continental AG, Sensata Technologies, Inc, Siemens AG, Robert Bosch GmbH, Hitachi Astemo, Ltd., ABB Ltd., TE Connectivity, Honeywell International, OMRON Corporation, Delphin (PHINIA Inc), Aalborg Instruments, and Posifa Technologies.
Recent Development
- January 2025 - TE Connectivity unveiled a ±1.5% accuracy MEMS air flow sensor with I²C digital output targeting industrial ventilation and F&B hygiene-critical zones.
- September 2024 - Honeywell released its AFS7000 series, incorporating a dual hot-wire sensor system for automotive intake and process air monitoring, rated to 150 SLPM continuous flow.
Fact.MR has provided detailed information including regional pricing benchmarks, production capacity snapshots, technology roadmaps, and manufacturer-level sales growth metrics, offering stakeholders a detailed landscape of Global Air Flow Sensor evolution.
Methodology and Industry Tracking Approach
In 2025, Fact.MR conducted a comprehensive global study of the air flow sensor market, gathering insights from over 5,200 qualified stakeholders across 18 countries to ensure robust regional and vertical industry representation.
Each national market included input from at least 110 technical professionals, selected based on their expertise in sensor calibration, thermal flow measurement, automotive airflow control, and embedded diagnostics.
No fewer than 110 professionals from each national consumed market were selected on the basis of their expertise in sustainable foodservice packaging, usability testing and material innovation in disposable tableware.
The research, spanning June 2024 to May 2025, captured data across seasonal demand cycles, form factor innovation (e.g., MEMS-based, dual-mode, and digital SLPM sensors), regulatory shifts affecting emissions and indoor air quality compliance, and pricing trends across OEM, retrofit, and institutional segments.
Results were cross-considered among well over 130 diverse sources, ranging through government emissions requirements, building energy codes, technical white papers on thermal drift compensation and benchmark papers comparing volumetric and mass flow sensing technologies.
Fact.MR’s research draws on its ongoing sensor market intelligence platform, "Applied Sensors & Diagnostics," active since 2018, which tracks developments in calibration techniques, flow-mode transition dynamics, and environmental robustness of air flow sensors.
Segmentation of Air Flow Sensor Market
-
By Type :
- Mass Air Flow Sensor
- Cold Wire Sensor
- Hot Film Sensor
- Hot Wire Sensor
- Kármán Vortex Sensor
- Vane Air Flow Meter Sensor
- Others
- Volumetric Air Flow Sensor
- Mass Air Flow Sensor
-
By Flow Range :
- Up to 10 SLPM
- 10 to 20 SLPM
- 20-50 SLPM
- 50-100 SLPM
- Above 100 SLPM
-
By Mounting :
- Fixture / Permanent
- Hand Held / Portable
-
By Output Type :
- Analog Air Flow Sensors
- Digital Air Flow Sensors
-
By Application :
- Air Compressors
- Air Intake Monitoring
- Air Quality & Ventilation Control
- Anesthesia Machines
- Chemical Reactor Control
- Engine Control System
- Gas Leak Detection
- HVAC Systems
- Pipeline Flow Monitoring
- Process Gas Monitoring
- Respiratory Devices
- Other Applications
-
By End-Use Industry :
- Aerospace & Defense
- Automotive
- Chemicals & Petrochemicals
- Food & Beverage
- Healthcare
- Industrial Manufacturing
- Oil & Gas
- Other Sectors
-
By Region :
- North America
- Latin America
- Western Europe
- Eastern Europe
- East Asia
- South Asia & Pacific
- Middle East & Africa
Table of Content
- Executive Summary
- Industry Introduction, including Taxonomy and Market Definition
- Trends and Success Factors, including Macro-economic Factors, Market Dynamics, and Recent Industry Developments
- Global Market Demand Analysis 2020 to 2024 and Forecast 2025 to 2035, including Historical Analysis and Future Projections
- Pricing Analysis
- Global Market Analysis 2020 to 2024 and Forecast 2025 to 2035
- Type
- Flow Range
- Output Type
- Mounting
- Application
- End-Use Industry
- Global Market Analysis 2020 to 2024 and Forecast 2025 to 2035, By Type
- Mass Air Flow Sensor
- Cold Wire Sensor
- Hot Film Sensor
- Hot Wire Sensor
- Kármán Vortex Sensor
- Vane Air Flow Meter Sensor
- Others
- Volumetric Air Flow Sensor
- Mass Air Flow Sensor
- Global Market Analysis 2020 to 2024 and Forecast 2025 to 2035, By Flow Range
- 10 to 20 SLPM
- 20 to 50 SLPM
- 50 to 100 SLPM
- Above 100 SLPM
- Global Market Analysis 2020 to 2024 and Forecast 2025 to 2035, By Output Type
- Analog Air Flow Sensors
- Digital Air Flow Sensors
- Global Market Analysis 2020 to 2024 and Forecast 2025 to 2035, By Mounting
- Fixture / Permanent
- Hand Held / Portable
- Global Market Analysis 2020 to 2024 and Forecast 2025 to 2035, By Application
- Air Compressors
- Air Intake Monitoring
- Air Quality & Ventilation Control
- Anesthesia Machines
- Chemical Reactor Control
- Engine Control System
- Gas Leak Detection
- HVAC Systems
- Pipeline Flow Monitoring
- Process Gas Monitoring
- Respiratory Devices
- Other Applications
- Global Market Analysis 2020 to 2024 and Forecast 2025 to 2035, By End-Use Industry
- Aerospace & Defense
- Automotive
- Chemicals & Petrochemicals
- Food & Beverage
- Healthcare
- Industrial Manufacturing
- Oil & Gas
- Other Sectors
- Global Market Analysis 2020 to 2024 and Forecast 2025 to 2035, By Region
- North America
- Latin America
- Western Europe
- South Asia & Pacific
- East Asia
- Eastern Europe
- Middle East & Africa
- North America Sales Analysis 2020 to 2024 and Forecast 2025 to 2035, by Key Segments and Countries
- Latin America Sales Analysis 2020 to 2024 and Forecast 2025 to 2035, by Key Segments and Countries
- Western Europe Sales Analysis 2020 to 2024 and Forecast 2025 to 2035, by Key Segments and Countries
- South Asia & Pacific Sales Analysis 2020 to 2024 and Forecast 2025 to 2035, by Key Segments and Countries
- East Asia Sales Analysis 2020 to 2024 and Forecast 2025 to 2035, by Key Segments and Countries
- Eastern Europe Sales Analysis 2020 to 2024 and Forecast 2025 to 2035, by Key Segments and Countries
- Middle East & Africa Sales Analysis 2020 to 2024 and Forecast 2025 to 2035, by Key Segments and Countries
- Sales Forecast to 2035 by Type, Flow Range, Output Type, Mounting, Application, and End-Use Industry for 30 Countries
- Competitive Assessment, Company Share Analysis by Key Players, and Competition Dashboard
- Company Profile
- DENSO
- HELLA GmbH & Co. KGaA
- Continental AG
- Sensata Technologies, Inc
- Siemens AG
- Robert Bosch GmbH
- Hitachi Astemo, Ltd.
- ABB Ltd.
- TE Connectivity
- Honeywell International
List Of Table
Table 1: Global Market Value (USD Mn) & Volume (Unit) Forecast by Region, 2020 to 2035
Table 2: Global Market Value (USD Mn) & Volume (Unit) Forecast by Type, 2020 to 2035
Table 3: Global Market Value (USD Mn) & Volume (Unit) Forecast by Flow Range, 2020 to 2035
Table 4: Global Market Value (USD Mn) & Volume (Unit) Forecast by Output Type, 2020 to 2035
Table 5: Global Market Value (USD Mn) & Volume (Unit) Forecast by Mounting, 2020 to 2035
Table 6: Global Market Value (USD Mn) & Volume (Unit) Forecast by Application, 2020 to 2035
Table 7: Global Market Value (USD Mn) & Volume (Unit) Forecast by End-Use Industry, 2020 to 2035
Table 8: North America Market Value (USD Mn) & Volume (Unit) Forecast by Country, 2020 to 2035
Table 9: North America Market Value (USD Mn) & Volume (Unit) Forecast by Type, 2020 to 2035
Table 10: North America Market Value (USD Mn) & Volume (Unit) Forecast by Flow Range, 2020 to 2035
Table 11: North America Market Value (USD Mn) & Volume (Unit) Forecast by Output Type, 2020 to 2035
Table 12: North America Market Value (USD Mn) & Volume (Unit) Forecast by Mounting, 2020 to 2035
Table 13: North America Market Value (USD Mn) & Volume (Unit) Forecast by Application, 2020 to 2035
Table 14: North America Market Value (USD Mn) & Volume (Unit) Forecast by End-Use Industry, 2020 to 2035
Table 15: Latin America Market Value (USD Mn) & Volume (Unit) Forecast by Country, 2020 to 2035
Table 16: Latin America Market Value (USD Mn) & Volume (Unit) Forecast by Type, 2020 to 2035
Table 17: Latin America Market Value (USD Mn) & Volume (Unit) Forecast by Flow Range, 2020 to 2035
Table 18: Latin America Market Value (USD Mn) & Volume (Unit) Forecast by Output Type, 2020 to 2035
Table 19: Latin America Market Value (USD Mn) & Volume (Unit) Forecast by Mounting, 2020 to 2035
Table 20: Latin America Market Value (USD Mn) & Volume (Unit) Forecast by Application, 2020 to 2035
Table 21: Latin America Market Value (USD Mn) & Volume (Unit) Forecast by End-Use Industry, 2020 to 2035
Table 22: Western Europe Market Value (USD Mn) & Volume (Unit) Forecast by Country, 2020 to 2035
Table 23: Western Europe Market Value (USD Mn) & Volume (Unit) Forecast by Type, 2020 to 2035
Table 24: Western Europe Market Value (USD Mn) & Volume (Unit) Forecast by Flow Range, 2020 to 2035
Table 25: Western Europe Market Value (USD Mn) & Volume (Unit) Forecast by Output Type, 2020 to 2035
Table 26: Western Europe Market Value (USD Mn) & Volume (Unit) Forecast by Mounting, 2020 to 2035
Table 27: Western Europe Market Value (USD Mn) & Volume (Unit) Forecast by Application, 2020 to 2035
Table 28: Western Europe Market Value (USD Mn) & Volume (Unit) Forecast by End-Use Industry, 2020 to 2035
Table 29: South Asia Market Value (USD Mn) & Volume (Unit) Forecast by Country, 2020 to 2035
Table 30: South Asia Market Value (USD Mn) & Volume (Unit) Forecast by Type, 2020 to 2035
Table 31: South Asia Market Value (USD Mn) & Volume (Unit) Forecast by Flow Range, 2020 to 2035
Table 32: South Asia Market Value (USD Mn) & Volume (Unit) Forecast by Output Type, 2020 to 2035
Table 33: South Asia Market Value (USD Mn) & Volume (Unit) Forecast by Mounting, 2020 to 2035
Table 34: South Asia Market Value (USD Mn) & Volume (Unit) Forecast by Application, 2020 to 2035
Table 35: South Asia Market Value (USD Mn) & Volume (Unit) Forecast by End-Use Industry, 2020 to 2035
Table 36: East Asia Market Value (USD Mn) & Volume (Unit) Forecast by Country, 2020 to 2035
Table 37: East Asia Market Value (USD Mn) & Volume (Unit) Forecast by Type, 2020 to 2035
Table 38: East Asia Market Value (USD Mn) & Volume (Unit) Forecast by Flow Range, 2020 to 2035
Table 39: East Asia Market Value (USD Mn) & Volume (Unit) Forecast by Output Type, 2020 to 2035
Table 40: East Asia Market Value (USD Mn) & Volume (Unit) Forecast by Mounting, 2020 to 2035
Table 41: East Asia Market Value (USD Mn) & Volume (Unit) Forecast by Application, 2020 to 2035
Table 42: East Asia Market Value (USD Mn) & Volume (Unit) Forecast by End-Use Industry, 2020 to 2035
Table 43: Eastern Europe Market Value (USD Mn) & Volume (Unit) Forecast by Country, 2020 to 2035
Table 44: Eastern Europe Market Value (USD Mn) & Volume (Unit) Forecast by Type, 2020 to 2035
Table 45: Eastern Europe Market Value (USD Mn) & Volume (Unit) Forecast by Flow Range, 2020 to 2035
Table 46: Eastern Europe Market Value (USD Mn) & Volume (Unit) Forecast by Output Type, 2020 to 2035
Table 47: Eastern Europe Market Value (USD Mn) & Volume (Unit) Forecast by Mounting, 2020 to 2035
Table 48: Eastern Europe Market Value (USD Mn) & Volume (Unit) Forecast by Application, 2020 to 2035
Table 49: Eastern Europe Market Value (USD Mn) & Volume (Unit) Forecast by End-Use Industry, 2020 to 2035
Table 50: Middle East & Africa Market Value (USD Mn) & Volume (Unit) Forecast by Country, 2020 to 2035
Table 51: Middle East & Africa Market Value (USD Mn) & Volume (Unit) Forecast by Type, 2020 to 2035
Table 52: Middle East & Africa Market Value (USD Mn) & Volume (Unit) Forecast by Flow Range, 2020 to 2035
Table 53: Middle East & Africa Market Value (USD Mn) & Volume (Unit) Forecast by Output Type, 2020 to 2035
Table 54: Middle East & Africa Market Value (USD Mn) & Volume (Unit) Forecast by Mounting, 2020 to 2035
Table 55: Middle East & Africa Market Value (USD Mn) & Volume (Unit) Forecast by Application, 2020 to 2035
Table 56: Middle East & Africa Market Value (USD Mn) & Volume (Unit) Forecast by End-Use Industry, 2020 to 2035
List Of Figures
Figure 1: Global Market Value Share (%), Growth Rate (Y-o-Y), and Value (USD Mn) & Volume (Unit) Projection by Type, 2020 to 2035
Figure 2: Global Market Value Share (%), Growth Rate (Y-o-Y), and Value (USD Mn) & Volume (Unit) Projection by Flow Range, 2020 to 2035
Figure 3: Global Market Value Share (%), Growth Rate (Y-o-Y), and Value (USD Mn) & Volume (Unit) Projection by Output Type, 2020 to 2035
Figure 4: Global Market Value Share (%), Growth Rate (Y-o-Y), and Value (USD Mn) & Volume (Unit) Projection by Mounting, 2020 to 2035
Figure 5: Global Market Value Share (%), Growth Rate (Y-o-Y), and Value (USD Mn) & Volume (Unit) Projection by Application, 2020 to 2035
Figure 6: Global Market Value Share (%), Growth Rate (Y-o-Y), and Value (USD Mn) & Volume (Unit) Projection by End-Use Industry, 2020 to 2035
Figure 7: Global Market Value Share (%), Growth Rate (Y-o-Y), and Value (USD Mn) & Volume (Unit) Projection by Region, 2020 to 2035
Figure 8: North America Market Value Share (%), Growth Rate (Y-o-Y), and Value (USD Mn) & Volume (Unit) Projection by Type, 2020 to 2035
Figure 9: North America Market Value Share (%), Growth Rate (Y-o-Y), and Value (USD Mn) & Volume (Unit) Projection by Flow Range, 2020 to 2035
Figure 10: North America Market Value Share (%), Growth Rate (Y-o-Y), and Value (USD Mn) & Volume (Unit) Projection by Output Type, 2020 to 2035
Figure 11: North America Market Value Share (%), Growth Rate (Y-o-Y), and Value (USD Mn) & Volume (Unit) Projection by Mounting, 2020 to 2035
Figure 12: North America Market Value Share (%), Growth Rate (Y-o-Y), and Value (USD Mn) & Volume (Unit) Projection by Application, 2020 to 2035
Figure 13: North America Market Value Share (%), Growth Rate (Y-o-Y), and Value (USD Mn) & Volume (Unit) Projection by End-Use Industry, 2020 to 2035
Figure 14: North America Market Value Share (%), Growth Rate (Y-o-Y), and Value (USD Mn) & Volume (Unit) Projection by Country, 2020 to 2035
Figure 15: Latin America Market Value Share (%), Growth Rate (Y-o-Y), and Value (USD Mn) & Volume (Unit) Projection by Type, 2020 to 2035
Figure 16: Latin America Market Value Share (%), Growth Rate (Y-o-Y), and Value (USD Mn) & Volume (Unit) Projection by Flow Range, 2020 to 2035
Figure 17: Latin America Market Value Share (%), Growth Rate (Y-o-Y), and Value (USD Mn) & Volume (Unit) Projection by Output Type, 2020 to 2035
Figure 18: Latin America Market Value Share (%), Growth Rate (Y-o-Y), and Value (USD Mn) & Volume (Unit) Projection by Mounting, 2020 to 2035
Figure 19: Latin America Market Value Share (%), Growth Rate (Y-o-Y), and Value (USD Mn) & Volume (Unit) Projection by Application, 2020 to 2035
Figure 20: Latin America Market Value Share (%), Growth Rate (Y-o-Y), and Value (USD Mn) & Volume (Unit) Projection by End-Use Industry, 2020 to 2035
Figure 21: Latin America Market Value Share (%), Growth Rate (Y-o-Y), and Value (USD Mn) & Volume (Unit) Projection by Country, 2020 to 2035
Figure 22: Western Europe Market Value Share (%), Growth Rate (Y-o-Y), and Value (USD Mn) & Volume (Unit) Projection by Type, 2020 to 2035
Figure 23: Western Europe Market Value Share (%), Growth Rate (Y-o-Y), and Value (USD Mn) & Volume (Unit) Projection by Flow Range, 2020 to 2035
Figure 24: Western Europe Market Value Share (%), Growth Rate (Y-o-Y), and Value (USD Mn) & Volume (Unit) Projection by Output Type, 2020 to 2035
Figure 25: Western Europe Market Value Share (%), Growth Rate (Y-o-Y), and Value (USD Mn) & Volume (Unit) Projection by Mounting, 2020 to 2035
Figure 26: Western Europe Market Value Share (%), Growth Rate (Y-o-Y), and Value (USD Mn) & Volume (Unit) Projection by Application, 2020 to 2035
Figure 27: Western Europe Market Value Share (%), Growth Rate (Y-o-Y), and Value (USD Mn) & Volume (Unit) Projection by End-Use Industry, 2020 to 2035
Figure 28: Western Europe Market Value Share (%), Growth Rate (Y-o-Y), and Value (USD Mn) & Volume (Unit) Projection by Country, 2020 to 2035
Figure 29: South Asia Market Value Share (%), Growth Rate (Y-o-Y), and Value (USD Mn) & Volume (Unit) Projection by Type, 2020 to 2035
Figure 30: South Asia Market Value Share (%), Growth Rate (Y-o-Y), and Value (USD Mn) & Volume (Unit) Projection by Flow Range, 2020 to 2035
Figure 31: South Asia Market Value Share (%), Growth Rate (Y-o-Y), and Value (USD Mn) & Volume (Unit) Projection by Output Type, 2020 to 2035
Figure 32: South Asia Market Value Share (%), Growth Rate (Y-o-Y), and Value (USD Mn) & Volume (Unit) Projection by Mounting, 2020 to 2035
Figure 33: South Asia Market Value Share (%), Growth Rate (Y-o-Y), and Value (USD Mn) & Volume (Unit) Projection by Application, 2020 to 2035
Figure 34: South Asia Market Value Share (%), Growth Rate (Y-o-Y), and Value (USD Mn) & Volume (Unit) Projection by End-Use Industry, 2020 to 2035
Figure 35: South Asia Market Value Share (%), Growth Rate (Y-o-Y), and Value (USD Mn) & Volume (Unit) Projection by Country, 2020 to 2035
Figure 36: East Asia Market Value Share (%), Growth Rate (Y-o-Y), and Value (USD Mn) & Volume (Unit) Projection by Type, 2020 to 2035
Figure 37: East Asia Market Value Share (%), Growth Rate (Y-o-Y), and Value (USD Mn) & Volume (Unit) Projection by Flow Range, 2020 to 2035
Figure 38: East Asia Market Value Share (%), Growth Rate (Y-o-Y), and Value (USD Mn) & Volume (Unit) Projection by Output Type, 2020 to 2035
Figure 39: East Asia Market Value Share (%), Growth Rate (Y-o-Y), and Value (USD Mn) & Volume (Unit) Projection by Mounting, 2020 to 2035
Figure 40: East Asia Market Value Share (%), Growth Rate (Y-o-Y), and Value (USD Mn) & Volume (Unit) Projection by Application, 2020 to 2035
Figure 41: East Asia Market Value Share (%), Growth Rate (Y-o-Y), and Value (USD Mn) & Volume (Unit) Projection by End-Use Industry, 2020 to 2035
Figure 42: East Asia Market Value Share (%), Growth Rate (Y-o-Y), and Value (USD Mn) & Volume (Unit) Projection by Country, 2020 to 2035
Figure 43: Eastern Europe Market Value Share (%), Growth Rate (Y-o-Y), and Value (USD Mn) & Volume (Unit) Projection by Type, 2020 to 2035
Figure 44: Eastern Europe Market Value Share (%), Growth Rate (Y-o-Y), and Value (USD Mn) & Volume (Unit) Projection by Flow Range, 2020 to 2035
Figure 45: Eastern Europe Market Value Share (%), Growth Rate (Y-o-Y), and Value (USD Mn) & Volume (Unit) Projection by Output Type, 2020 to 2035
Figure 46: Eastern Europe Market Value Share (%), Growth Rate (Y-o-Y), and Value (USD Mn) & Volume (Unit) Projection by Mounting, 2020 to 2035
Figure 47: Eastern Europe Market Value Share (%), Growth Rate (Y-o-Y), and Value (USD Mn) & Volume (Unit) Projection by Application, 2020 to 2035
Figure 48: Eastern Europe Market Value Share (%), Growth Rate (Y-o-Y), and Value (USD Mn) & Volume (Unit) Projection by End-Use Industry, 2020 to 2035
Figure 49: Eastern Europe Market Value Share (%), Growth Rate (Y-o-Y), and Value (USD Mn) & Volume (Unit) Projection by Country, 2020 to 2035
Figure 50: Middle East & Africa Market Value Share (%), Growth Rate (Y-o-Y), and Value (USD Mn) & Volume (Unit) Projection by Type, 2020 to 2035
Figure 51: Middle East & Africa Market Value Share (%), Growth Rate (Y-o-Y), and Value (USD Mn) & Volume (Unit) Projection by Flow Range, 2020 to 2035
Figure 52: Middle East & Africa Market Value Share (%), Growth Rate (Y-o-Y), and Value (USD Mn) & Volume (Unit) Projection by Output Type, 2020 to 2035
Figure 53: Middle East & Africa Market Value Share (%), Growth Rate (Y-o-Y), and Value (USD Mn) & Volume (Unit) Projection by Mounting, 2020 to 2035
Figure 54: Middle East & Africa Market Value Share (%), Growth Rate (Y-o-Y), and Value (USD Mn) & Volume (Unit) Projection by Application, 2020 to 2035
Figure 55: Middle East & Africa Market Value Share (%), Growth Rate (Y-o-Y), and Value (USD Mn) & Volume (Unit) Projection by End-Use Industry, 2020 to 2035
Figure 56: Middle East & Africa Market Value Share (%), Growth Rate (Y-o-Y), and Value (USD Mn) & Volume (Unit) Projection by Country, 2020 to 2035
- FAQs -
What was the global air flow sensor market size reported by Fact.MR for 2025?
The global air flow sensor market was valued at USD 2,386 Million in 2025.
Who are the major players operating in the air flow sensor market?
Prominent players in the DENSO, Bosch, Honeywell, Siemens, TE Connectivity, Omron, and Sensata.
What is the Estimated Valuation of the air flow sensor market in 2035?
The market is expected to reach a valuation of USD 3,398 Million in 2035.
What value CAGR did the air flow sensor market exhibit over the last five years?
The historic growth rate of the air flow sensor market was 3.2% from 2020 to 2024.