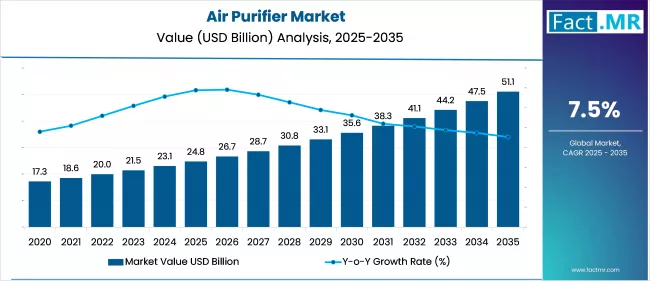
Air Purifier Market
Air Purifier Market Analysis, By Type, By Technology, By Coverage Area, By Use Case, By Sales Channel, and Region - Market Insights 2025 to 2035
Analysis of Air Purifier Market Covering 30+ Countries Including Analysis of US, Canada, UK, Germany, France, Nordics, GCC countries, Japan, Korea and many more.
Air Purifier Market Outlook (2025 to 2035)
The global air purifier market is projected to increase from USD 24.8 billion in 2025 to USD 51.1 billion by 2035, with a CAGR of 7.5%, driven by rising urban air pollution, increasing awareness of respiratory health, and stricter indoor air quality regulations.
High demand from polluted urban centers, coupled with adoption across the healthcare, hospitality, and educational sectors, is driving sales. Technological advancements, such as IoT-enabled systems and energy-efficient designs, are further shaping product development and consumer preferences.
What are the Drivers of the Air Purifier Market?
The air purifier market is gaining momentum due to a convergence of environmental, regulatory, and consumer health trends. Escalating air pollution levels in densely populated urban centers across Asia and the Middle East have heightened public concern about the quality of indoor air.
This concern is further reinforced by a surge in respiratory illnesses, such as asthma and chronic bronchitis, which drives demand for advanced air filtration systems. Government-led initiatives and stricter air quality regulations, such as India’s National Clean Air Programme and the U.S. EPA’s air quality standards, are also encouraging adoption in both residential and commercial spaces. The post-COVID landscape has intensified focus on indoor hygiene, with hospitals, schools, and offices investing in HEPA, activated carbon, and UV-based purifiers to mitigate airborne health risks.
Additionally, the integration of smart technologies, including IoT-enabled air quality monitoring and app-based control, is reshaping consumer expectations and enabling premium product growth. As disposable incomes rise and wellness spending increases in emerging economies, the air purifier market is expected to see sustained expansion across multiple end-user segments.
What are the Regional Trends of the Air Purifier Market?
The air purifier market reflects a diverse regional landscape, with growth trajectories shaped by local environmental conditions, regulatory frameworks, urbanization rates, and shifting consumer health priorities. The Asia Pacific region remains the dominant in the air purifier market share, primarily due to chronic air pollution in fast-developing economies such as China and India, where PM2.5 concentrations regularly exceed the safe thresholds defined by the World Health Organization.
Cities like Delhi, Beijing, and Lahore frequently rank among the polluted globally, prompting governments to introduce large-scale clean air initiatives. China’s “Blue Sky Protection Plan” and India’s National Clean Air Programme (NCAP) are notable examples.
These policies, combined with rising disposable incomes and a surge in respiratory illnesses, are accelerating demand across both residential and institutional sectors, including schools, hospitals, and office buildings. Local manufacturers and international players are capitalizing on this demand by offering affordable, energy-efficient, and app-integrated purifier models tailored for urban households.
In North America, the market is maturing, characterized by high consumer awareness of indoor air quality and the advanced adoption of smart home solutions. The increasing frequency and severity of wildfires in California, Oregon, and parts of British Columbia have reinforced the need for air purifiers capable of filtering fine particulate matter and smoke-related pollutants.
Moreover, the post-pandemic emphasis on air hygiene in workspaces, healthcare environments, and educational facilities has solidified long-term commercial demand. The presence of established brands like Honeywell, 3M, and Dyson, along with regulatory guidance from the U.S. EPA, supports steady air purifier market growth.
Europe is seeing consistent expansion, driven by progressive environmental policies and stringent regulations under the Ambient Air Quality Directive and national clean air acts. Countries such as Germany, France, and the Nordic nations are at the forefront, integrating air purification solutions into broader building sustainability programs, including BREEAM and WELL certifications. There is also a strong consumer shift toward eco-friendly, energy-efficient purification systems, often integrated with HVAC units in homes, public buildings, and transport infrastructure.
In the Middle East, nations such as the UAE and Saudi Arabia are experiencing a rise in demand as governments and the private sector address air quality issues caused by frequent sandstorms, construction dust, and high ambient particulate matter. The hospitality, real estate, and healthcare sectors are investing heavily in centralized and portable air purification systems as a part of broader efforts to improve indoor environments for residents and international visitors. Growing smart city initiatives in Dubai, Riyadh, and Doha are also incorporating air quality monitoring and purification as part of their urban infrastructure planning.
In contrast, Latin America and Africa currently represent emerging markets with relatively low penetration but high long-term potential. Urban centers such as São Paulo, Mexico City, Lagos, and Nairobi are beginning to witness a shift as awareness around air pollution’s health impacts grows. While affordability and limited infrastructure remain barriers, rising urbanization, expanding middle-class populations, and the gradual strengthening of healthcare systems are laying the groundwork for future growth. Governments and NGOs are also playing a role in promoting awareness of indoor air quality and supporting pilot projects in public institutions.
What are the Challenges and Restraining Factors of the Air Purifier Market?
Despite strong growth potential, the air purifier market faces challenges that may limit its pace of expansion. High upfront costs and recurring maintenance expenses, such as filter replacements, remain major deterrents, especially in price-sensitive markets across Latin America, Southeast Asia, and parts of Africa. Consumer skepticism about product efficacy in regions with low awareness or misinformation also impedes adoption.
Additionally, the absence of standardized performance benchmarks across countries complicates product comparison and undermines buyer confidence. In commercial settings, integration with existing HVAC systems can be technically complex and capital-intensive.
Moreover, limited access to electricity and infrastructure in rural and underdeveloped areas restricts market penetration. From an environmental perspective, concerns about electronic waste and the disposal of used filters are gaining attention, pressuring manufacturers to adopt sustainable design and disposal practices.
These factors, coupled with the availability of low-cost, non-certified alternatives, present ongoing hurdles for established brands seeking long-term growth and trust in competitive markets.
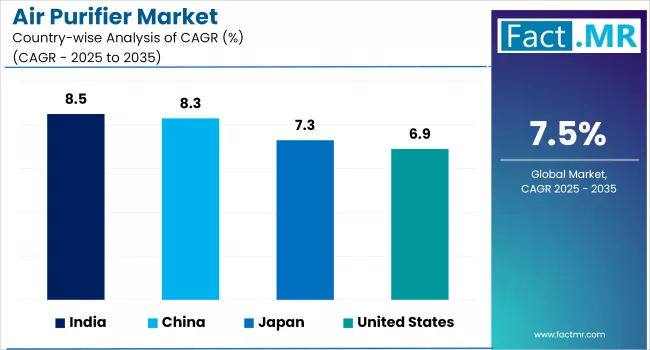
Country-Wise Outlook
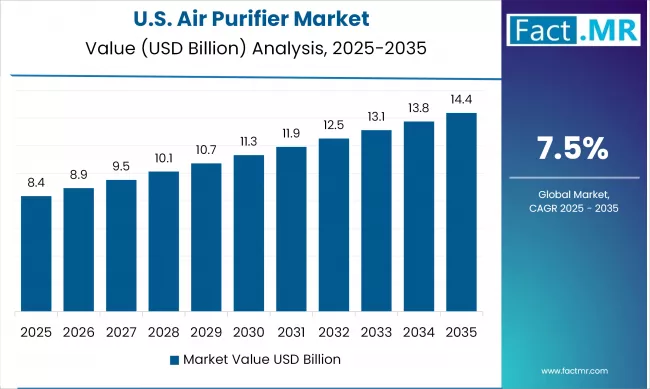
U.S. Air Purifier Market Sees Rising Demand Amid Health and Environmental Concerns
In the U.S., the air purifier market is experiencing steady growth, driven by rising awareness of indoor air quality, increasing cases of respiratory conditions, and the continued emphasis on hygiene following the COVID-19 pandemic.
Factors such as frequent wildfire occurrences, especially in states like California, have accelerated demand for high-efficiency air filtration systems. The adoption of portable purifiers is also expanding rapidly, as consumers seek flexible, room-specific solutions that can operate independently of centralized HVAC systems. In the commercial sector, hospitals, schools, and corporate offices are integrating advanced air purification technologies, such as HEPA, activated carbon, and UV-C systems, to meet safety standards and enhance occupant well-being.
Additionally, the market is being shaped by a growing preference for smart, connected devices that offer real-time air quality monitoring and energy-efficient operation. Government initiatives promoting clean indoor environments and the emergence of green building certifications are further encouraging institutional adoption across the country.
China Experiences Sustained Growth in Air Purifier Adoption Amid Rising Urban Pollution
China continues to see a marked increase in air purifier adoption, driven by persistent air quality challenges across major metropolitan areas such as Beijing, Shanghai, and Guangzhou. According to the Chinese Ministry of Ecology and Environment, concentrations of PM2.5 regularly exceed national safety thresholds, prompting households and institutions to invest in advanced air filtration technologies.
Government-led environmental campaigns, such as the “Blue Sky Protection Plan,” have placed air pollution control at the forefront of public policy, reinforcing demand across both residential and commercial segments. Additionally, growing middle-class spending on health and wellness products, combined with heightened awareness of the link between airborne pollutants and chronic respiratory conditions, is fueling the market.
The integration of smart sensors and app-connected purifiers by domestic brands such as Xiaomi, Haier, and Midea is also accelerating growth in the tech-driven urban consumer base. Meanwhile, adoption is expanding beyond Tier 1 cities into smaller urban centers, as affordability improves and indoor air quality gains broader attention across socioeconomic groups.
Air Purifier Demand Strengthens in Japan Amid Health Priorities and Technological Advancements
Japan is experiencing a steady increase in air purifier demand, driven by heightened public concern over indoor air quality, particularly in densely populated urban centers such as Tokyo, Osaka, and Nagoya. The country’s aging population and high incidence of respiratory and allergy-related conditions have made air purification systems an essential feature in homes, hospitals, and elderly care facilities. Seasonal threats such as pollen surges from sugi (Japanese cedar) and yellow dust from East Asia further reinforce year-round product usage.
Technological innovation plays a key role in shaping consumer preferences. Domestic manufacturers, including Panasonic, Sharp, and Daikin, are leading with advanced features such as plasmacluster ion technology, nanoe filtration, and real-time air quality monitoring.
Moreover, the growing emphasis on energy-efficient, quiet, and compact systems aligns with Japan’s space-conscious living environments. Commercial adoption is also increasing in sectors such as hospitality, public transportation, and retail, driven by post-pandemic safety standards and regulatory support for healthy building environments. As awareness expands beyond urban hubs into regional cities, the air purifier market in Japan is poised for stable, long-term growth.
Category-wise Analysis
Standalone/Portable to Exhibit Leading by Type
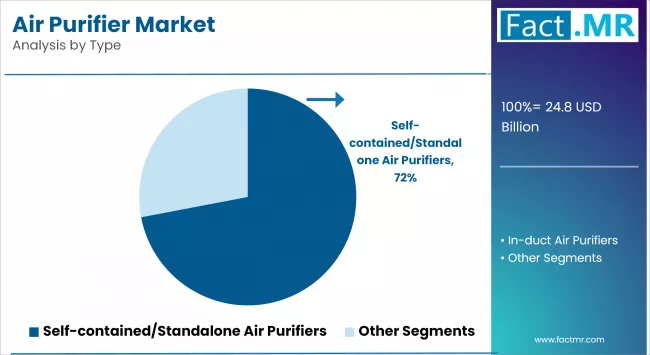
Portable or standalone air purifiers continue to dominate the product landscape, accounting for the highest market share globally. Their popularity stems from ease of use, cost-effectiveness, and adaptability in compact urban living spaces. Consumers in Asia’s metropolitan regions and North America’s rental housing markets prefer portable units for targeted air cleaning without the need for structural modifications. Additionally, ongoing innovation in design, noise reduction, and energy efficiency has made portable models increasingly appealing in both residential and small business settings.
HEPA Filters to Exhibit Leading by Technology
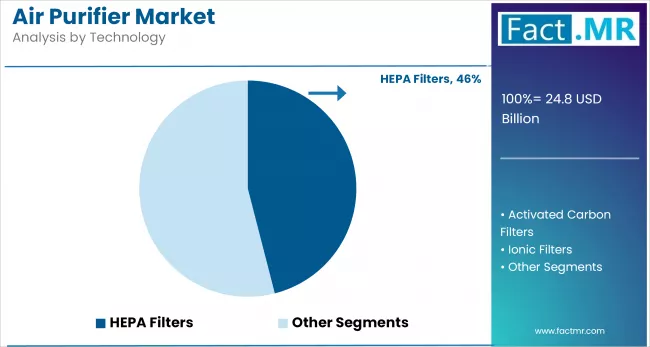
Among the various air purification technologies available, HEPA (High-Efficiency Particulate Air) filters remain the widely adopted. Their proven ability to trap airborne particles as small as 0.3 microns, including dust, allergens, and pathogens, makes them especially suitable for consumers concerned about health and indoor air quality.
HEPA-based systems are widely used in hospitals, laboratories, and schools. They are often recommended by regulatory agencies such as the U.S. Environmental Protection Agency (EPA) and health ministries in Europe and Asia. Leading manufacturers continue to integrate HEPA with activated carbon and UV-C to offer multi-stage filtration systems tailored to diverse indoor environments.
301 - 500 sq. ft.Exhibit Leading by Coverage Area
The 301-500 sq. ft. segment dominates the market due to its suitability for medium-sized residential and commercial spaces, such as living rooms, offices, and conference rooms. Products in this range strike a balance between performance and affordability, making them a preferred choice for users seeking efficient air purification, heating, or cooling solutions. The versatility and wide availability of products in this category cater to the needs of urban households and small businesses, driving consistent demand in the market.
The above 1200 sq. ft. segment is witnessing the fastest growth, fueled by rising demand in large commercial spaces, warehouses, gyms, and open-plan workspaces. As awareness around indoor air quality and energy efficiency increases, organizations are investing in large-capacity solutions that can cover expansive areas. Additionally, the trend of integrating centralized climate and air quality systems in smart buildings is accelerating adoption in this higher coverage range, particularly in developed markets and new infrastructure projects.
Offline to Exhibit Leading Share by Sales Channel
While online platforms are expanding rapidly, offering competitive pricing and convenient delivery, offline sales channels continue to hold the largest market share. Physical retail formats, such as electronics showrooms, department stores, and appliance outlets, offer hands-on demonstrations, in-person consultations, and after-sales support that are especially valued in high-involvement purchases, like air purifiers. This trend is particularly evident in developing economies, where digital penetration is still catching up, and consumers prefer to evaluate performance and noise levels before making a purchase.
Commercial Category to Exhibit Leading by Use Case
The commercial segment, including healthcare, hospitality, education, and office spaces, represents the largest use case in the air purifier market. Organizations are increasingly investing in advanced air filtration systems to meet stringent indoor air quality (IAQ) standards, boost employee and customer confidence, and comply with workplace safety regulations.
In hospitals, air purifiers with HEPA and UV-based technologies are deployed to control nosocomial infections, while hotels and coworking spaces use purification systems as part of their health-conscious branding and ESG strategies. The growing demand for safer indoor environments in shared public spaces post-COVID continues to drive commercial investment.
Asia-Pacific Holds Leading Share in Air Purifier Market
The Asia-Pacific region continues to dominate the global air purifier market in terms of revenue and volume. Rapid urbanization, coupled with severe air pollution in major cities like Delhi, Beijing, and Jakarta, has made air purifiers a critical household appliance.
Rising disposable incomes, increased health consciousness, and government interventions, including subsidies, awareness campaigns, and clean air regulations, have accelerated the adoption of clean energy across residential, commercial, and industrial sectors. Countries such as Japan and South Korea are also investing in smart purification technologies as part of broader initiatives to improve urban living standards and public health outcomes.
Competitive Analysis
The global air purifier market is becoming increasingly competitive, with a mix of established appliance manufacturers, specialized air quality solution providers, and emerging smart home technology firms catering to residential, commercial, and industrial segments.
This competitive landscape is largely driven by innovation in filtration technologies, energy efficiency, smart connectivity features, and compliance with global air quality standards, such as HEPA, CARB, and ENERGY STAR certifications. Companies offering advanced solutions, including IoT-enabled monitoring, multi-stage filtration, and low-noise, high-efficiency systems, are gaining a significant competitive edge.
Japanese and South Korean brands such as Sharp Corporation and LG Electronics have introduced integrated purification systems featuring IoT connectivity and energy-efficient performance to gain traction in urban markets across Asia and Europe. Meanwhile, companies like IQAir and Hitech Ultraviolet Pvt. Ltd. have carved a niche in premium and specialized applications, offering high-performance units for hospitals, laboratories, and cleanrooms.
Global demand is also being shaped by rising air pollution levels, increasing consumer awareness of respiratory health, and stricter indoor air quality regulations in key regions such as North America, Western Europe, and East Asia. Emerging players and regional manufacturers especially in China, India, and Southeast Asia are entering the market with competitively priced, app-enabled purifiers tailored to local conditions.
As sustainability and smart technology integration become more prominent, industry leaders are prioritizing R&D, partnerships, and ESG-aligned production practices to maintain a competitive advantage and meet diverse regulatory standards across markets.
Key players in the air purifier industry, including American Air & Water Inc., Eureka Forbes Ltd., Koninklijke Philips N.V., Panasonic Corporation, Daikin Industries Ltd., LG Electronics, and Honeywell International Inc., continue to invest in advanced filtration technologies, including HEPA, activated carbon, ionizers, UV-C, and photocatalytic oxidation.
Recent Development
- In 2024, Sharp Corporation launched the FX-S/FP-S series Plasmacluster air purifiers, recognized with the iF Design Award 2024, featuring a dual-suction design, high-density ion technology, and compatibility with Sharp’s AIoT cloud services for remote scheduling and smart management.
- In 2024, Xiaomi Corporation introduced the Smart Air Purifier 4 Pro, featuring high-performance specs of up to 500 m³/h CADR, a 24,000 cm² filter surface, 650,000 mg of activated carbon, and TÜV Rheinland Allergy Care certification, positioning it strongly in the mid-range and premium segments.
Segmentation of the Air Purifier Market
-
By Type :
- Self-contained/Standalone Air Purifiers
- Fixed/Wall Mounted
- Portable
- In-duct Air Purifiers
- Self-contained/Standalone Air Purifiers
-
By Technology :
- HEPA Filters
- Activated Carbon Filters
- Ionic Filters
- Ultra-violet (UV) Technologies
- Others
-
By Coverage Area :
- Up to 200 sq. ft.
- 201 - 300 sq. ft.
- 301 - 500 sq. ft.
- 501 - 800 sq. ft.
- 801 - 1200 sq. ft.
- Above 1200 sq. ft.
-
By Use Case :
- Residential Use
- Commercial Use
- Industrial Use
-
By Sales Channel :
- Online
- Company/Brand Websites
- e-Commerce Websites
- Offline
- Hypermarkets/Supermarkets
- Specialty Stores
- Others
- Online
-
By Region :
- North America
- Latin America
- Europe
- East Asia
- South Asia & Oceania
- Middle East & Africa
Table of Content
- Executive Summary
- Global Market Outlook
- Demand-side Trends
- Supply-side Trends
- Technology Roadmap Analysis
- Analysis and Recommendations
- Market Overview
- Market Coverage / Taxonomy
- Market Definition / Scope / Limitations
- Market Background
- Market Dynamics
- Drivers
- Restraints
- Opportunity
- Trends
- Scenario Forecast
- Demand in Optimistic Scenario
- Demand in Likely Scenario
- Demand in Conservative Scenario
- Opportunity Map Analysis
- Product Life Cycle Analysis
- Supply Chain Analysis
- Supply Side Participants and their Roles
- Producers
- Mid-Level Participants (Traders/ Agents/ Brokers)
- Wholesalers and Distributors
- Value Added and Value Created at Node in the Supply Chain
- List of Component Suppliers
- List of Existing and Potential Buyers
- Supply Side Participants and their Roles
- Investment Feasibility Matrix
- Value Chain Analysis
- Profit Margin Analysis
- Wholesalers and Distributors
- Retailers
- PESTLE and Porter’s Analysis
- Regulatory Landscape
- By Key Regions
- By Key Countries
- Production and Consumption Statistics
- Import and Export Statistics
- Market Dynamics
- Global Market Analysis 2020 to 2024 and Forecast, 2025 to 2035
- Historical Market Size Value (USD Bn) & Volume (Units) Analysis, 2020 to 2024
- Current and Future Market Size Value (USD Bn) & Volume (Units) Projections, 2025 to 2035
- Y-o-Y Growth Trend Analysis
- Absolute $ Opportunity Analysis
- Global Market Pricing Analysis 2020 to 2024 and Forecast 2025 to 2035
- Global Market Analysis 2020 to 2024 and Forecast 2025 to 2035, By Type
- Introduction / Key Findings
- Historical Market Size Value (USD Bn) & Volume (Units) Analysis By Type, 2020 to 2024
- Current and Future Market Size Value (USD Bn) & Volume (Units) Analysis and Forecast By Type, 2025 to 2035
- Self-contained/Standalone
- Fixed/Wall Mounted
- Portable
- In-duct Air Purifiers
- Self-contained/Standalone
- Y-o-Y Growth Trend Analysis By Type, 2020 to 2024
- Absolute $ Opportunity Analysis By Type, 2025 to 2035
- Global Market Analysis 2020 to 2024 and Forecast 2025 to 2035, By Technology
- Introduction / Key Findings
- Historical Market Size Value (USD Bn) & Volume (Units) Analysis By Technology, 2020 to 2024
- Current and Future Market Size Value (USD Bn) & Volume (Units) Analysis and Forecast By Technology, 2025 to 2035
- HEPA Filters
- Activated Carbon Filters
- Ionic Filters
- Ultra-violet (UV) Technologies
- Others
- Y-o-Y Growth Trend Analysis By Technology, 2020 to 2024
- Absolute $ Opportunity Analysis By Technology, 2025 to 2035
- Global Market Analysis 2020 to 2024 and Forecast 2025 to 2035, By Coverage Area
- Introduction / Key Findings
- Historical Market Size Value (USD Bn) & Volume (Units) Analysis By Coverage Area, 2020 to 2024
- Current and Future Market Size Value (USD Bn) & Volume (Units) Analysis and Forecast By Coverage Area, 2025 to 2035
- Up to 200 sq. ft.
- 201 - 300 sq. ft.
- 301 - 500 sq. ft.
- 501 - 800 sq. ft.
- 801 - 1200 sq. ft.
- Above 1200 sq. ft.
- Y-o-Y Growth Trend Analysis By Coverage Area, 2020 to 2024
- Absolute $ Opportunity Analysis By Coverage Area, 2025 to 2035
- Global Market Analysis 2020 to 2024 and Forecast 2025 to 2035, By Use Case
- Introduction / Key Findings
- Historical Market Size Value (USD Bn) & Volume (Units) Analysis By Use Case, 2020 to 2024
- Current and Future Market Size Value (USD Bn) & Volume (Units) Analysis and Forecast By Use Case, 2025 to 2035
- Residential Use
- Commercial Use
- Industrial Use
- Y-o-Y Growth Trend Analysis By Use Case, 2020 to 2024
- Absolute $ Opportunity Analysis By Use Case, 2025 to 2035
- Global Market Analysis 2020 to 2024 and Forecast 2025 to 2035, By Sales Channel
- Introduction / Key Findings
- Historical Market Size Value (USD Bn) & Volume (Units) Analysis By Sales Channel, 2020 to 2024
- Current and Future Market Size Value (USD Bn) & Volume (Units) Analysis and Forecast By Sales Channel, 2025 to 2035
- Online
- Company/Brand Websites
- e-Commerce Websites
- Offline
- Hypermarkets/Supermarkets
- Specialty Stores
- Others
- Online
- Y-o-Y Growth Trend Analysis By Sales Channel, 2020 to 2024
- Absolute $ Opportunity Analysis By Sales Channel, 2025 to 2035
- Global Market Analysis 2020 to 2024 and Forecast 2025 to 2035, By Region
- Introduction
- Historical Market Size Value (USD Bn) & Volume (Units) Analysis By Region, 2020 to 2024
- Current Market Size Value (USD Bn) & Volume (Units) Analysis and Forecast By Region, 2025 to 2035
- North America
- Latin America
- Western Europe
- East Asia
- South Asia Pacific
- Eastern Europe
- Middle East & Africa
- Market Attractiveness Analysis By Region
- North America Market Analysis 2020 to 2024 and Forecast 2025 to 2035, By Country
- Historical Market Size Value (USD Bn) & Volume (Units) Trend Analysis By Market Taxonomy, 2020 to 2024
- Market Size Value (USD Bn) & Volume (Units) Forecast By Market Taxonomy, 2025 to 2035
- By Country
- U.S.
- Canada
- Mexico
- By Type
- By Technology
- By Coverage Area
- By Use Case
- By Sales Channel
- By Country
- Market Attractiveness Analysis
- By Country
- By Type
- By Technology
- By Coverage Area
- By Use Case
- By Sales Channel
- Key Takeaways
- Latin America Market Analysis 2020 to 2024 and Forecast 2025 to 2035, By Country
- Historical Market Size Value (USD Bn) & Volume (Units) Trend Analysis By Market Taxonomy, 2020 to 2024
- Market Size Value (USD Bn) & Volume (Units) Forecast By Market Taxonomy, 2025 to 2035
- By Country
- Brazil
- Chile
- Rest of Latin America
- By Type
- By Technology
- By Coverage Area
- By Use Case
- By Sales Channel
- By Country
- Market Attractiveness Analysis
- By Country
- By Type
- By Technology
- By Coverage Area
- By Use Case
- By Sales Channel
- Key Takeaways
- Western Europe Market Analysis 2020 to 2024 and Forecast 2025 to 2035, By Country
- Historical Market Size Value (USD Bn) & Volume (Units) Trend Analysis By Market Taxonomy, 2020 to 2024
- Market Size Value (USD Bn) & Volume (Units) Forecast By Market Taxonomy, 2025 to 2035
- By Country
- Germany
- Italy
- France
- U.K.
- Spain
- Russia
- BENELUX
- Rest of Europe
- By Type
- By Technology
- By Coverage Area
- By Use Case
- By Sales Channel
- By Country
- Market Attractiveness Analysis
- By Country
- By Type
- By Technology
- By Coverage Area
- By Use Case
- By Sales Channel
- Key Takeaways
- East Asia Market Analysis 2020 to 2024 and Forecast 2025 to 2035, By Country
- Historical Market Size Value (USD Bn) & Volume (Units) Trend Analysis By Market Taxonomy, 2020 to 2024
- Market Size Value (USD Bn) & Volume (Units) Forecast By Market Taxonomy, 2025 to 2035
- By Country
- China
- Japan
- South Korea
- By Type
- By Technology
- By Coverage Area
- By Use Case
- By Sales Channel
- By Country
- Market Attractiveness Analysis
- By Country
- By Type
- By Technology
- By Coverage Area
- By Use Case
- By Sales Channel
- Key Takeaways
- South Asia Pacific Market Analysis 2020 to 2024 and Forecast 2025 to 2035, By Country
- Historical Market Size Value (USD Bn) & Volume (Units) Trend Analysis By Market Taxonomy, 2020 to 2024
- Market Size Value (USD Bn) & Volume (Units) Forecast By Market Taxonomy, 2025 to 2035
- By Country
- India
- ASEAN Countries
- Australia & New Zealand
- Rest of South Asia Pacific
- By Type
- By Technology
- By Coverage Area
- By Use Case
- By Sales Channel
- By Country
- Market Attractiveness Analysis
- By Country
- By Type
- By Technology
- By Coverage Area
- By Use Case
- By Sales Channel
- Key Takeaways
- Eastern Europe Market Analysis 2020 to 2024 and Forecast 2025 to 2035, By Country
- Historical Market Size Value (USD Bn) & Volume (Units) Trend Analysis By Market Taxonomy, 2020 to 2024
- Market Size Value (USD Bn) & Volume (Units) Forecast By Market Taxonomy, 2025 to 2035
- By Country
- Russia
- Poland
- Hungary
- Balkan & Baltics
- Rest of Eastern Europe
- By Type
- By Technology
- By Coverage Area
- By Use Case
- By Sales Channel
- By Country
- Market Attractiveness Analysis
- By Country
- By Type
- By Technology
- By Coverage Area
- By Use Case
- By Sales Channel
- Key Takeaways
- Middle East & Africa Market Analysis 2020 to 2024 and Forecast 2025 to 2035, By Country
- Historical Market Size Value (USD Bn) & Volume (Units) Trend Analysis By Market Taxonomy, 2020 to 2024
- Market Size Value (USD Bn) & Volume (Units) Forecast By Market Taxonomy, 2025 to 2035
- By Country
- KSA
- Other GCC Countries
- Turkiye
- South Africa
- Rest of MEA
- By Type
- By Technology
- By Coverage Area
- By Use Case
- By Sales Channel
- By Country
- Market Attractiveness Analysis
- By Country
- By Type
- By Technology
- By Coverage Area
- By Use Case
- By Sales Channel
- Key Takeaways
- Key Countries Market Analysis
- China
- Pricing Analysis
- Market Share Analysis, 2024
- By Type
- By Technology
- By Coverage Area
- By Use Case
- By Sales Channel
- India
- Pricing Analysis
- Market Share Analysis, 2024
- By Type
- By Technology
- By Coverage Area
- By Use Case
- By Sales Channel
- Value (USD Bn) & Volume (Units)ed States
- Pricing Analysis
- Market Share Analysis, 2024
- By Type
- By Technology
- By Coverage Area
- By Use Case
- By Sales Channel
- Japan
- Pricing Analysis
- Market Share Analysis, 2024
- By Type
- By Technology
- By Coverage Area
- By Use Case
- By Sales Channel
- South Korea
- Pricing Analysis
- Market Share Analysis, 2024
- By Type
- By Technology
- By Coverage Area
- By Use Case
- By Sales Channel
- China
- Market Structure Analysis
- Competition Dashboard
- Competition Benchmarking
- Market Share Analysis of Top Players
- By Regional
- By Type
- By Technology
- By Coverage Area
- By Use Case
- By Sales Channel
- Competition Analysis
- Competition Deep Dive
- Eureka Forbes Ltd.
- Overview
- Product Portfolio
- Profitability by Market Segments (Product/Age /Sales Channel/Region)
- Sales Footprint
- Strategy Overview
- Marketing Strategy
- Product Strategy
- Channel Strategy
- Koninklijke Philips N.V.
- Overview
- Product Portfolio
- Profitability by Market Segments (Product/Age /Sales Channel/Region)
- Sales Footprint
- Strategy Overview
- Marketing Strategy
- Product Strategy
- Channel Strategy
- Panasonic Corporation
- Overview
- Product Portfolio
- Profitability by Market Segments (Product/Age /Sales Channel/Region)
- Sales Footprint
- Strategy Overview
- Marketing Strategy
- Product Strategy
- Channel Strategy
- Daikin Industries Ltd.
- Overview
- Product Portfolio
- Profitability by Market Segments (Product/Age /Sales Channel/Region)
- Sales Footprint
- Strategy Overview
- Marketing Strategy
- Product Strategy
- Channel Strategy
- LG Electronics
- Overview
- Product Portfolio
- Profitability by Market Segments (Product/Age /Sales Channel/Region)
- Sales Footprint
- Strategy Overview
- Marketing Strategy
- Product Strategy
- Channel Strategy
- IQAir
- Overview
- Product Portfolio
- Profitability by Market Segments (Product/Age /Sales Channel/Region)
- Sales Footprint
- Strategy Overview
- Marketing Strategy
- Product Strategy
- Channel Strategy
- Eureka Forbes Ltd.
- Competition Deep Dive
- Assumptions & Acronyms Used
- Research Methodology
List Of Table
- Table 1: Global Market Value (USD Bn) Forecast by Region, 2020 to 2035
- Table 2: Global Market Volume (Units) Forecast by Region, 2020 to 2035
- Table 3: Global Market Value (USD Bn) Forecast by Type, 2020 to 2035
- Table 4: Global Market Volume (Units) Forecast by Type, 2020 to 2035
- Table 5: Global Market Value (USD Bn) Forecast by Technology, 2020 to 2035
- Table 6: Global Market Volume (Units) Forecast by Technology, 2020 to 2035
- Table 7: Global Market Value (USD Bn) Forecast by Coverage Area, 2020 to 2035
- Table 8: Global Market Volume (Units) Forecast by Coverage Area, 2020 to 2035
- Table 9: Global Market Value (USD Bn) Forecast by Use Case, 2020 to 2035
- Table 10: Global Market Volume (Units) Forecast by Use Case, 2020 to 2035
- Table 11: Global Market Value (USD Bn) Forecast by Sales Channel, 2020 to 2035
- Table 12: Global Market Volume (Units) Forecast by Sales Channel, 2020 to 2035
- Table 13: North America Market Value (USD Bn) Forecast by Country, 2020 to 2035
- Table 14: North America Market Volume (Units) Forecast by Country, 2020 to 2035
- Table 15: North America Market Value (USD Bn) Forecast by Type, 2020 to 2035
- Table 16: North America Market Volume (Units) Forecast by Type, 2020 to 2035
- Table 17: North America Market Value (USD Bn) Forecast by Technology, 2020 to 2035
- Table 18: North America Market Volume (Units) Forecast by Technology, 2020 to 2035
- Table 19: North America Market Value (USD Bn) Forecast by Coverage Area, 2020 to 2035
- Table 20: North America Market Volume (Units) Forecast by Coverage Area, 2020 to 2035
- Table 21: North America Market Value (USD Bn) Forecast by Use Case, 2020 to 2035
- Table 22: North America Market Volume (Units) Forecast by Use Case, 2020 to 2035
- Table 23: North America Market Value (USD Bn) Forecast by Sales Channel, 2020 to 2035
- Table 24: North America Market Volume (Units) Forecast by Sales Channel, 2020 to 2035
- Table 25: Latin America Market Value (USD Bn) Forecast by Country, 2020 to 2035
- Table 26: Latin America Market Volume (Units) Forecast by Country, 2020 to 2035
- Table 27: Latin America Market Value (USD Bn) Forecast by Type, 2020 to 2035
- Table 28: Latin America Market Volume (Units) Forecast by Type, 2020 to 2035
- Table 29: Latin America Market Value (USD Bn) Forecast by Technology, 2020 to 2035
- Table 30: Latin America Market Volume (Units) Forecast by Technology, 2020 to 2035
- Table 31: Latin America Market Value (USD Bn) Forecast by Coverage Area, 2020 to 2035
- Table 32: Latin America Market Volume (Units) Forecast by Coverage Area, 2020 to 2035
- Table 33: Latin America Market Value (USD Bn) Forecast by Use Case, 2020 to 2035
- Table 34: Latin America Market Volume (Units) Forecast by Use Case, 2020 to 2035
- Table 35: Latin America Market Value (USD Bn) Forecast by Sales Channel, 2020 to 2035
- Table 36: Latin America Market Volume (Units) Forecast by Sales Channel, 2020 to 2035
- Table 37: Western Europe Market Value (USD Bn) Forecast by Country, 2020 to 2035
- Table 38: Western Europe Market Volume (Units) Forecast by Country, 2020 to 2035
- Table 39: Western Europe Market Value (USD Bn) Forecast by Type, 2020 to 2035
- Table 40: Western Europe Market Volume (Units) Forecast by Type, 2020 to 2035
- Table 41: Western Europe Market Value (USD Bn) Forecast by Technology, 2020 to 2035
- Table 42: Western Europe Market Volume (Units) Forecast by Technology, 2020 to 2035
- Table 43: Western Europe Market Value (USD Bn) Forecast by Coverage Area, 2020 to 2035
- Table 44: Western Europe Market Volume (Units) Forecast by Coverage Area, 2020 to 2035
- Table 45: Western Europe Market Value (USD Bn) Forecast by Use Case, 2020 to 2035
- Table 46: Western Europe Market Volume (Units) Forecast by Use Case, 2020 to 2035
- Table 47: Western Europe Market Value (USD Bn) Forecast by Sales Channel, 2020 to 2035
- Table 48: Western Europe Market Volume (Units) Forecast by Sales Channel, 2020 to 2035
- Table 49: East Asia Market Value (USD Bn) Forecast by Country, 2020 to 2035
- Table 50: East Asia Market Volume (Units) Forecast by Country, 2020 to 2035
- Table 51: East Asia Market Value (USD Bn) Forecast by Type, 2020 to 2035
- Table 52: East Asia Market Volume (Units) Forecast by Type, 2020 to 2035
- Table 53: East Asia Market Value (USD Bn) Forecast by Technology, 2020 to 2035
- Table 54: East Asia Market Volume (Units) Forecast by Technology, 2020 to 2035
- Table 55: East Asia Market Value (USD Bn) Forecast by Coverage Area, 2020 to 2035
- Table 56: East Asia Market Volume (Units) Forecast by Coverage Area, 2020 to 2035
- Table 57: East Asia Market Value (USD Bn) Forecast by Use Case, 2020 to 2035
- Table 58: East Asia Market Volume (Units) Forecast by Use Case, 2020 to 2035
- Table 59: East Asia Market Value (USD Bn) Forecast by Sales Channel, 2020 to 2035
- Table 60: East Asia Market Volume (Units) Forecast by Sales Channel, 2020 to 2035
- Table 61: South Asia Pacific Market Value (USD Bn) Forecast by Country, 2020 to 2035
- Table 62: South Asia Pacific Market Volume (Units) Forecast by Country, 2020 to 2035
- Table 63: South Asia Pacific Market Value (USD Bn) Forecast by Type, 2020 to 2035
- Table 64: South Asia Pacific Market Volume (Units) Forecast by Type, 2020 to 2035
- Table 65: South Asia Pacific Market Value (USD Bn) Forecast by Technology, 2020 to 2035
- Table 66: South Asia Pacific Market Volume (Units) Forecast by Technology, 2020 to 2035
- Table 67: South Asia Pacific Market Value (USD Bn) Forecast by Coverage Area, 2020 to 2035
- Table 68: South Asia Pacific Market Volume (Units) Forecast by Coverage Area, 2020 to 2035
- Table 69: South Asia Pacific Market Value (USD Bn) Forecast by Use Case, 2020 to 2035
- Table 70: South Asia Pacific Market Volume (Units) Forecast by Use Case, 2020 to 2035
- Table 71: South Asia Pacific Market Value (USD Bn) Forecast by Sales Channel, 2020 to 2035
- Table 72: South Asia Pacific Market Volume (Units) Forecast by Sales Channel, 2020 to 2035
- Table 73: Eastern Europe Market Value (USD Bn) Forecast by Country, 2020 to 2035
- Table 74: Eastern Europe Market Volume (Units) Forecast by Country, 2020 to 2035
- Table 75: Eastern Europe Market Value (USD Bn) Forecast by Type, 2020 to 2035
- Table 76: Eastern Europe Market Volume (Units) Forecast by Type, 2020 to 2035
- Table 77: Eastern Europe Market Value (USD Bn) Forecast by Technology, 2020 to 2035
- Table 78: Eastern Europe Market Volume (Units) Forecast by Technology, 2020 to 2035
- Table 79: Eastern Europe Market Value (USD Bn) Forecast by Coverage Area, 2020 to 2035
- Table 80: Eastern Europe Market Volume (Units) Forecast by Coverage Area, 2020 to 2035
- Table 81: Eastern Europe Market Value (USD Bn) Forecast by Use Case, 2020 to 2035
- Table 82: Eastern Europe Market Volume (Units) Forecast by Use Case, 2020 to 2035
- Table 83: Eastern Europe Market Value (USD Bn) Forecast by Sales Channel, 2020 to 2035
- Table 84: Eastern Europe Market Volume (Units) Forecast by Sales Channel, 2020 to 2035
- Table 85: Middle East & Africa Market Value (USD Bn) Forecast by Country, 2020 to 2035
- Table 86: Middle East & Africa Market Volume (Units) Forecast by Country, 2020 to 2035
- Table 87: Middle East & Africa Market Value (USD Bn) Forecast by Type, 2020 to 2035
- Table 88: Middle East & Africa Market Volume (Units) Forecast by Type, 2020 to 2035
- Table 89: Middle East & Africa Market Value (USD Bn) Forecast by Technology, 2020 to 2035
- Table 90: Middle East & Africa Market Volume (Units) Forecast by Technology, 2020 to 2035
- Table 91: Middle East & Africa Market Value (USD Bn) Forecast by Coverage Area, 2020 to 2035
- Table 92: Middle East & Africa Market Volume (Units) Forecast by Coverage Area, 2020 to 2035
- Table 93: Middle East & Africa Market Value (USD Bn) Forecast by Use Case, 2020 to 2035
- Table 94: Middle East & Africa Market Volume (Units) Forecast by Use Case, 2020 to 2035
- Table 95: Middle East & Africa Market Value (USD Bn) Forecast by Sales Channel, 2020 to 2035
- Table 96: Middle East & Africa Market Volume (Units) Forecast by Sales Channel, 2020 to 2035
List Of Figures
- Figure 1: Global Market Volume (Units) Forecast 2020 to 2035
- Figure 2: Global Market Pricing Analysis
- Figure 3: Global Market Value (USD Bn) Forecast 2020 to 2035
- Figure 4: Global Market Value Share and BPS Analysis by Type, 2025 and 2035
- Figure 5: Global Market Y-o-Y Growth Comparison by Type, 2025 to 2035
- Figure 6: Global Market Attractiveness Analysis by Type
- Figure 7: Global Market Value Share and BPS Analysis by Technology, 2025 and 2035
- Figure 8: Global Market Y-o-Y Growth Comparison by Technology, 2025 to 2035
- Figure 9: Global Market Attractiveness Analysis by Technology
- Figure 10: Global Market Value Share and BPS Analysis by Coverage Area, 2025 and 2035
- Figure 11: Global Market Y-o-Y Growth Comparison by Coverage Area, 2025 to 2035
- Figure 12: Global Market Attractiveness Analysis by Coverage Area
- Figure 13: Global Market Value Share and BPS Analysis by Use Case, 2025 and 2035
- Figure 14: Global Market Y-o-Y Growth Comparison by Use Case, 2025 to 2035
- Figure 15: Global Market Attractiveness Analysis by Use Case
- Figure 16: Global Market Value Share and BPS Analysis by Sales Channel, 2025 and 2035
- Figure 17: Global Market Y-o-Y Growth Comparison by Sales Channel, 2025 to 2035
- Figure 18: Global Market Attractiveness Analysis by Sales Channel
- Figure 19: Global Market Value (USD Bn) Share and BPS Analysis by Region, 2025 and 2035
- Figure 20: Global Market Y-o-Y Growth Comparison by Region, 2025 to 2035
- Figure 21: Global Market Attractiveness Analysis by Region
- Figure 22: North America Market Incremental $ Opportunity, 2025 to 2035
- Figure 23: Latin America Market Incremental $ Opportunity, 2025 to 2035
- Figure 24: Western Europe Market Incremental $ Opportunity, 2025 to 2035
- Figure 25: East Asia Market Incremental $ Opportunity, 2025 to 2035
- Figure 26: South Asia Pacific Market Incremental $ Opportunity, 2025 to 2035
- Figure 27: Eastern Europe Market Incremental $ Opportunity, 2025 to 2035
- Figure 28: Middle East & Africa Market Incremental $ Opportunity, 2025 to 2035
- Figure 29: North America Market Value Share and BPS Analysis by Country, 2025 and 2035
- Figure 30: North America Market Value Share and BPS Analysis by Type, 2025 and 2035
- Figure 31: North America Market Y-o-Y Growth Comparison by Type, 2025 to 2035
- Figure 32: North America Market Attractiveness Analysis by Type
- Figure 33: North America Market Value Share and BPS Analysis by Technology, 2025 and 2035
- Figure 34: North America Market Y-o-Y Growth Comparison by Technology, 2025 to 2035
- Figure 35: North America Market Attractiveness Analysis by Technology
- Figure 36: North America Market Value Share and BPS Analysis by Coverage Area, 2025 and 2035
- Figure 37: North America Market Y-o-Y Growth Comparison by Coverage Area, 2025 to 2035
- Figure 38: North America Market Attractiveness Analysis by Coverage Area
- Figure 39: North America Market Value Share and BPS Analysis by Use Case, 2025 and 2035
- Figure 40: North America Market Y-o-Y Growth Comparison by Use Case, 2025 to 2035
- Figure 41: North America Market Attractiveness Analysis by Use Case
- Figure 42: North America Market Value Share and BPS Analysis by Sales Channel, 2025 and 2035
- Figure 43: North America Market Y-o-Y Growth Comparison by Sales Channel, 2025 to 2035
- Figure 44: North America Market Attractiveness Analysis by Sales Channel
- Figure 45: Latin America Market Value Share and BPS Analysis by Country, 2025 and 2035
- Figure 46: Latin America Market Value Share and BPS Analysis by Type, 2025 and 2035
- Figure 47: Latin America Market Y-o-Y Growth Comparison by Type, 2025 to 2035
- Figure 48: Latin America Market Attractiveness Analysis by Type
- Figure 49: Latin America Market Value Share and BPS Analysis by Technology, 2025 and 2035
- Figure 50: Latin America Market Y-o-Y Growth Comparison by Technology, 2025 to 2035
- Figure 51: Latin America Market Attractiveness Analysis by Technology
- Figure 52: Latin America Market Value Share and BPS Analysis by Coverage Area, 2025 and 2035
- Figure 53: Latin America Market Y-o-Y Growth Comparison by Coverage Area, 2025 to 2035
- Figure 54: Latin America Market Attractiveness Analysis by Coverage Area
- Figure 55: Latin America Market Value Share and BPS Analysis by Use Case, 2025 and 2035
- Figure 56: Latin America Market Y-o-Y Growth Comparison by Use Case, 2025 to 2035
- Figure 57: Latin America Market Attractiveness Analysis by Use Case
- Figure 58: Latin America Market Value Share and BPS Analysis by Sales Channel, 2025 and 2035
- Figure 59: Latin America Market Y-o-Y Growth Comparison by Sales Channel, 2025 to 2035
- Figure 60: Latin America Market Attractiveness Analysis by Sales Channel
- Figure 61: Western Europe Market Value Share and BPS Analysis by Country, 2025 and 2035
- Figure 62: Western Europe Market Value Share and BPS Analysis by Type, 2025 and 2035
- Figure 63: Western Europe Market Y-o-Y Growth Comparison by Type, 2025 to 2035
- Figure 64: Western Europe Market Attractiveness Analysis by Type
- Figure 65: Western Europe Market Value Share and BPS Analysis by Technology, 2025 and 2035
- Figure 66: Western Europe Market Y-o-Y Growth Comparison by Technology, 2025 to 2035
- Figure 67: Western Europe Market Attractiveness Analysis by Technology
- Figure 68: Western Europe Market Value Share and BPS Analysis by Coverage Area, 2025 and 2035
- Figure 69: Western Europe Market Y-o-Y Growth Comparison by Coverage Area, 2025 to 2035
- Figure 70: Western Europe Market Attractiveness Analysis by Coverage Area
- Figure 71: Western Europe Market Value Share and BPS Analysis by Use Case, 2025 and 2035
- Figure 72: Western Europe Market Y-o-Y Growth Comparison by Use Case, 2025 to 2035
- Figure 73: Western Europe Market Attractiveness Analysis by Use Case
- Figure 74: Western Europe Market Value Share and BPS Analysis by Sales Channel, 2025 and 2035
- Figure 75: Western Europe Market Y-o-Y Growth Comparison by Sales Channel, 2025 to 2035
- Figure 76: Western Europe Market Attractiveness Analysis by Sales Channel
- Figure 77: East Asia Market Value Share and BPS Analysis by Country, 2025 and 2035
- Figure 78: East Asia Market Value Share and BPS Analysis by Type, 2025 and 2035
- Figure 79: East Asia Market Y-o-Y Growth Comparison by Type, 2025 to 2035
- Figure 80: East Asia Market Attractiveness Analysis by Type
- Figure 81: East Asia Market Value Share and BPS Analysis by Technology, 2025 and 2035
- Figure 82: East Asia Market Y-o-Y Growth Comparison by Technology, 2025 to 2035
- Figure 83: East Asia Market Attractiveness Analysis by Technology
- Figure 84: East Asia Market Value Share and BPS Analysis by Coverage Area, 2025 and 2035
- Figure 85: East Asia Market Y-o-Y Growth Comparison by Coverage Area, 2025 to 2035
- Figure 86: East Asia Market Attractiveness Analysis by Coverage Area
- Figure 87: East Asia Market Value Share and BPS Analysis by Use Case, 2025 and 2035
- Figure 88: East Asia Market Y-o-Y Growth Comparison by Use Case, 2025 to 2035
- Figure 89: East Asia Market Attractiveness Analysis by Use Case
- Figure 90: East Asia Market Value Share and BPS Analysis by Sales Channel, 2025 and 2035
- Figure 91: East Asia Market Y-o-Y Growth Comparison by Sales Channel, 2025 to 2035
- Figure 92: East Asia Market Attractiveness Analysis by Sales Channel
- Figure 93: South Asia Pacific Market Value Share and BPS Analysis by Country, 2025 and 2035
- Figure 94: South Asia Pacific Market Value Share and BPS Analysis by Type, 2025 and 2035
- Figure 95: South Asia Pacific Market Y-o-Y Growth Comparison by Type, 2025 to 2035
- Figure 96: South Asia Pacific Market Attractiveness Analysis by Type
- Figure 97: South Asia Pacific Market Value Share and BPS Analysis by Technology, 2025 and 2035
- Figure 98: South Asia Pacific Market Y-o-Y Growth Comparison by Technology, 2025 to 2035
- Figure 99: South Asia Pacific Market Attractiveness Analysis by Technology
- Figure 100: South Asia Pacific Market Value Share and BPS Analysis by Coverage Area, 2025 and 2035
- Figure 101: South Asia Pacific Market Y-o-Y Growth Comparison by Coverage Area, 2025 to 2035
- Figure 102: South Asia Pacific Market Attractiveness Analysis by Coverage Area
- Figure 103: South Asia Pacific Market Value Share and BPS Analysis by Use Case, 2025 and 2035
- Figure 104: South Asia Pacific Market Y-o-Y Growth Comparison by Use Case, 2025 to 2035
- Figure 105: South Asia Pacific Market Attractiveness Analysis by Use Case
- Figure 106: South Asia Pacific Market Value Share and BPS Analysis by Sales Channel, 2025 and 2035
- Figure 107: South Asia Pacific Market Y-o-Y Growth Comparison by Sales Channel, 2025 to 2035
- Figure 108: South Asia Pacific Market Attractiveness Analysis by Sales Channel
- Figure 109: Eastern Europe Market Value Share and BPS Analysis by Country, 2025 and 2035
- Figure 110: Eastern Europe Market Value Share and BPS Analysis by Type, 2025 and 2035
- Figure 111: Eastern Europe Market Y-o-Y Growth Comparison by Type, 2025 to 2035
- Figure 112: Eastern Europe Market Attractiveness Analysis by Type
- Figure 113: Eastern Europe Market Value Share and BPS Analysis by Technology, 2025 and 2035
- Figure 114: Eastern Europe Market Y-o-Y Growth Comparison by Technology, 2025 to 2035
- Figure 115: Eastern Europe Market Attractiveness Analysis by Technology
- Figure 116: Eastern Europe Market Value Share and BPS Analysis by Coverage Area, 2025 and 2035
- Figure 117: Eastern Europe Market Y-o-Y Growth Comparison by Coverage Area, 2025 to 2035
- Figure 118: Eastern Europe Market Attractiveness Analysis by Coverage Area
- Figure 119: Eastern Europe Market Value Share and BPS Analysis by Use Case, 2025 and 2035
- Figure 120: Eastern Europe Market Y-o-Y Growth Comparison by Use Case, 2025 to 2035
- Figure 121: Eastern Europe Market Attractiveness Analysis by Use Case
- Figure 122: Eastern Europe Market Value Share and BPS Analysis by Sales Channel, 2025 and 2035
- Figure 123: Eastern Europe Market Y-o-Y Growth Comparison by Sales Channel, 2025 to 2035
- Figure 124: Eastern Europe Market Attractiveness Analysis by Sales Channel
- Figure 125: Middle East & Africa Market Value Share and BPS Analysis by Country, 2025 and 2035
- Figure 126: Middle East & Africa Market Value Share and BPS Analysis by Type, 2025 and 2035
- Figure 127: Middle East & Africa Market Y-o-Y Growth Comparison by Type, 2025 to 2035
- Figure 128: Middle East & Africa Market Attractiveness Analysis by Type
- Figure 129: Middle East & Africa Market Value Share and BPS Analysis by Technology, 2025 and 2035
- Figure 130: Middle East & Africa Market Y-o-Y Growth Comparison by Technology, 2025 to 2035
- Figure 131: Middle East & Africa Market Attractiveness Analysis by Technology
- Figure 132: Middle East & Africa Market Value Share and BPS Analysis by Coverage Area, 2025 and 2035
- Figure 133: Middle East & Africa Market Y-o-Y Growth Comparison by Coverage Area, 2025 to 2035
- Figure 134: Middle East & Africa Market Attractiveness Analysis by Coverage Area
- Figure 135: Middle East & Africa Market Value Share and BPS Analysis by Use Case, 2025 and 2035
- Figure 136: Middle East & Africa Market Y-o-Y Growth Comparison by Use Case, 2025 to 2035
- Figure 137: Middle East & Africa Market Attractiveness Analysis by Use Case
- Figure 138: Middle East & Africa Market Value Share and BPS Analysis by Sales Channel, 2025 and 2035
- Figure 139: Middle East & Africa Market Y-o-Y Growth Comparison by Sales Channel, 2025 to 2035
- Figure 140: Middle East & Africa Market Attractiveness Analysis by Sales Channel
- Figure 141: Global Market - Tier Structure Analysis
- Figure 142: Global Market - Company Share Analysis
- FAQs -
What is the Global Air Purifier Market Size in 2025?
The air purifier market is valued at USD 24.8 billion in 2025.
Who are the Major Players Operating in the Air Purifier Market?
Prominent players in the air purifier market include Eureka Forbes Ltd., Koninklijke Philips N.V., Panasonic Corporation, Daikin Industries Ltd., LG Electronics, IQAir, and others.
What is the Estimated Valuation of the Air Purifier Market by 2035?
The air purifier market is expected to reach a valuation of USD 51.1 billion by 2035.
What Value CAGR Did the Air Purifier Market Exhibit over the Last Five Years?
The historic growth rate of the air purifier market was 6.9% from 2020 to 2024.