- Market Value (2025): USD 1.9 Bn
- Estimated Value (2026): USD 2.1 Bn
- Forecast Value (2036): USD 4.5 Bn
- CAGR (2026-2036): 8.0%
What is the Massaging Cosmetic Applicators Market forecast to be worth by 2036?
USD 2.1 billion in 2026 to USD 4.5 billion by 2036 at an 8.0% CAGR.
- The massaging cosmetic applicators market reached USD 1.9 billion in 2025.
- Demand is projected to increase from USD 2.1 billion in 2026 to USD 4.5 billion by 2036.
- The market is projected to expand at an 8.0% CAGR from 2026 to 2036.
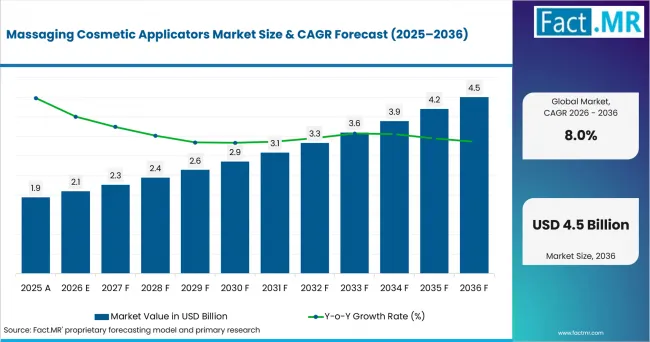
Massaging Cosmetic Applicators Market Value Analysis | Source: Fact.MR
What are the defining numbers behind Massaging Cosmetic Applicators Market growth?
An absolute opportunity of USD 2.4 billion is expected between 2026 and 2036.
- Demand Drivers in the Market
- Skin care is the largest cosmetics and personal-care category in Europe, valued by Cosmetics Europe at EUR 32.3 billion in 2025. A larger base of daily moisturization, anti-aging and rejuvenation routines creates more occasions for rollers, vibrating tools and other beauty devices that are used before, during or after topical application.
- At-home device use is becoming more established as consumers look for convenient ways to extend professional-style routines between salon or clinic visits. A 2026 review in Dermatologic Surgery found that home-use dermatologic devices are increasingly used because of convenience and accessibility, while evidence and safety vary by modality. This supports differentiated demand for simple applicators as well as more technology-intensive skin rejuvenation products.
- Mechanical facial massage has a clear functional use case without requiring complex electronics. A randomized study published in Complementary Therapies in Medicine found that five minutes of facial roller use increased skin blood flow in the massaged cheek and that repeated use improved vascular dilation response. This helps explain the durable appeal of roller-based and manual-pressure products within routine cosmetic care.
- Technology is broadening the category beyond simple rollers. Reviews of home beauty devices describe radiofrequency, microcurrent, LED and related modalities used for facial rejuvenation, while the U.S. FDA notes that intended use and claims determine whether an aesthetic product is regulated as a medical device. Suppliers therefore compete on usable intensity, safety, instructions and defensible claims as they move closer to adjacent skincare devices categories.
- Channel expansion is widening access to devices that previously relied on professional demonstration. Germany's IKW reported that e-commerce posted the strongest sales growth within beauty and home care in 2025. Online discovery, tutorials, social commerce and brand-owned stores allow applicator brands to demonstrate technique and bundle tools with skin-care routines without depending solely on salon retail.
- Key Segments Analyzed
- Facial Massaging Applicators account for 46.8% of Product in 2026 because they fit easily into everyday facial care routines and can be used repeatedly with serums, creams and other topical products.
- Skin Care Treatment holds 71.3% of Application in 2026 as applicators are commonly used alongside anti-aging, hydration and other regular skin-care routines.
- Beauty & Cosmetic Clinics represent 52.6% of End Use in 2026 owing to the fact that clinics and spas can combine applicator use with professional treatments, product guidance and repeat visits.
- Mechanical Massage Technology accounts for 58.9% of Technology in 2026 on account of manual rollers and pressure-based systems are easy to use, relatively inexpensive and compatible with a wide range of cosmetic routines.
- Non-Invasive Cosmetic Systems hold 64.1% of Formulation in 2026 because they support surface-level skin care without needles or other invasive procedures, making them suitable for both home and professional use.
- Direct Sales account for 41.7% of Distribution Channel in 2026 because brand-owned channels and professional relationships make it easier to demonstrate products, explain usage and bundle applicators with complementary skin-care products.
- Analyst Opinion at Fact.MR
- Shambhu Nath Jha, Principal Consultant, Fact.MR, states, "Massaging cosmetic applicators sit between a simple beauty accessory and a technology-led personal-care device. The strongest products make the routine easy to repeat, give users a clear reason to choose a specific motion or energy type and avoid claims that exceed the evidence behind the device. Suppliers that combine comfortable design, credible instructions, hygiene, durability and an effective channel demonstration can serve both professional and at-home users without overcomplicating the product."
- Strategic Implications
- Suppliers should draw a clear line between everyday cosmetic massage tools and higher-intensity aesthetic devices. As product claims move closer to changing body structure or function, regulatory classification and supporting evidence become more important.
- Direct sales remains the leading channel, but brands also need product education, demonstrations and warranty support that work well through personal care e-commerce, where consumers increasingly discover and compare beauty devices online.
- Product portfolios can range from simple manual rollers to vibrating, heated, light-based and connected systems. This gives brands a way to serve low-cost routine use while maintaining higher price points for more advanced devices.
- Clinics and salons place greater emphasis on cleanability, reusable contact surfaces and consistent performance across repeated treatments. After-sales support also matters more in professional settings where devices are used frequently and downtime affects service delivery.
How does the Massaging Cosmetic Applicators Market break down by segment?
The market is segmented by Product, Application, End Use, Technology, Formulation and Distribution Channel.
Why do Facial Massaging Applicators lead Product?
Facial Massaging Applicators are projected to account for a 46.8% share of Product in 2026.
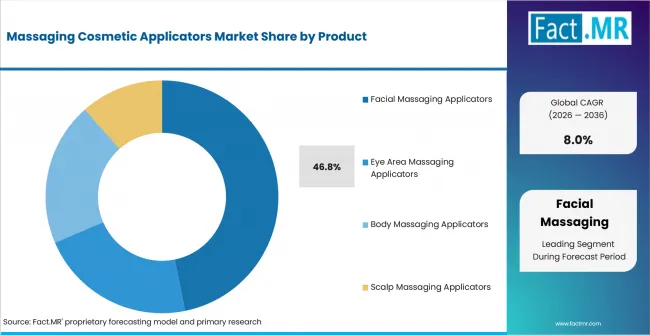
Massaging Cosmetic Applicators Market Analysis By Product | Source: Fact.MR
Facial products lead because the face is the most frequent point of contact between cosmetic routines and handheld applicators. Rollers and vibrating facial tools can be added to cleansing and anti-aging routines without requiring a separate treatment setting, which increases potential use frequency and supports repeat replacement or upgrade purchases.
Why does Skin Care Treatment lead Application?
Skin Care Treatment is projected to account for a 71.3% share of Application in 2026.
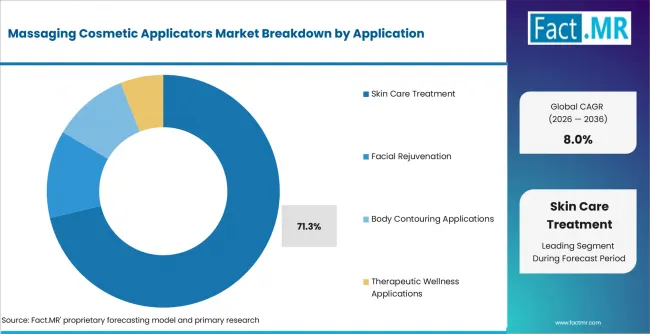
Massaging Cosmetic Applicators Market Analysis By Application | Source: Fact.MR
Skin-care treatment leads owing to the fact that applicators can be used repeatedly with moisturizers, serums, masks and other topical routines. Anti-aging and hydration are especially compatible with repeat home use because consumers can integrate the device into an existing regimen rather than scheduling a separate service.
Cosmetics Europe reports that skin care was Europe's largest cosmetics and personal-care category in 2025. That category depth gives massaging applicators a broad installed base of routines to complement, while facial rejuvenation, body contouring and therapeutic wellness remain more use-case specific.
Why do Beauty & Cosmetic Clinics lead End Use?
Beauty & Cosmetic Clinics are projected to account for a 52.6% share of End Use in 2026.
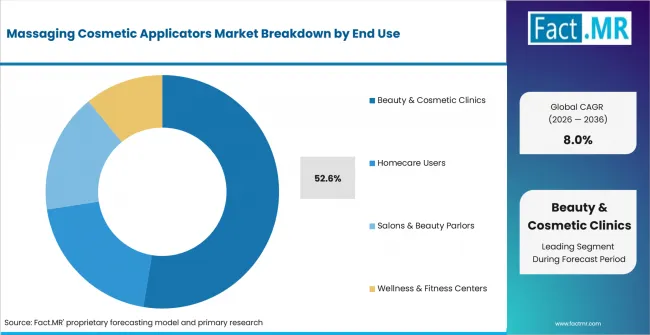
Massaging Cosmetic Applicators Market Analysis By End Use | Source: Fact.MR
Clinics and associated dermatology or spa settings lead as they combine professional assessment, repeat appointments and direct product recommendation. A clinic can use a device during a service then sell or recommend a home-use version, creating a bridge between professional treatment and daily self-care.
The U.S. FDA advises consumers to understand the benefits and risks of aesthetic devices and to discuss appropriate procedures with trained providers. That regulatory and safety context favors professional involvement as technologies move from basic mechanical massage toward light, heat or other higher-intensity systems.
Why does Mechanical Massage Technology lead Technology?
Mechanical Massage Technology is projected to account for a 58.9% share of Technology in 2026.
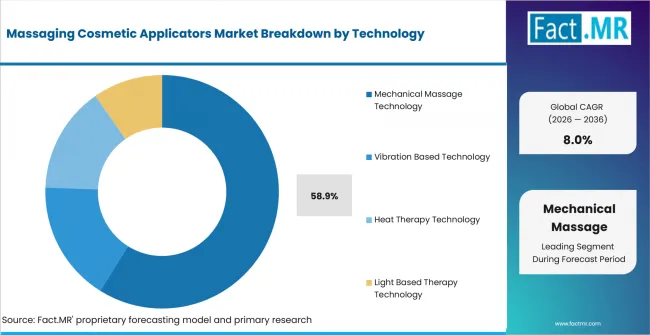
Massaging Cosmetic Applicators Market Analysis By Technology | Source: Fact.MR
Mechanical systems lead because manual pressure and rotational movement are easy to understand, inexpensive to manufacture and free from charging, battery life or wavelength selection. That simplicity supports low-cost entry products, travel use and routine pairing with creams or serums.
Mechanical designs also face a lower complexity threshold than products built around light or thermal claims. Buyers can judge comfort and perceived massage effect directly, while more advanced modalities require stronger instructions and safety controls.
Why do Non-Invasive Cosmetic Systems lead Formulation?
Non-Invasive Cosmetic Systems are projected to account for a 64.1% share of Formulation in 2026.
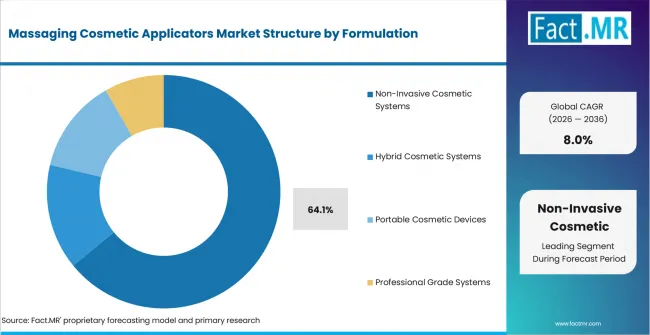
Massaging Cosmetic Applicators Market Analysis By Formulation | Source: Fact.MR
The Formulation category uses this label for non-invasive professional-grade system formats. Non-invasive systems lead because surface-level treatment and controlled stimulation can be used across wider consumer groups without needles or procedural downtime.
Regulatory boundaries reinforce this preference. The FDA distinguishes cosmetics from drugs and medical devices according to intended use and claims, while EU cosmetics law separately defines cosmetic products and medical devices. Products positioned around appearance, massage and routine care can therefore reach a broader consumer audience when claims remain aligned with their evidence and intended use.
Why does Direct Sales lead Distribution Channel?
Direct Sales is projected to account for a 41.7% share of Distribution Channel in 2026.
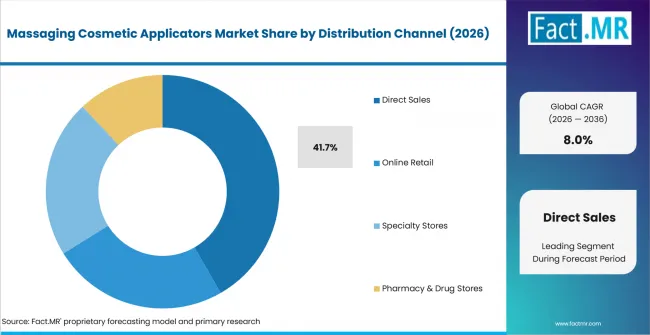
Massaging Cosmetic Applicators Market Analysis By Distribution Channel | Source: Fact.MR
Direct sales lead as many massaging applicators need some explanation before purchase. Brand stores, clinic counters and professional suppliers can show users how much pressure to apply and how to clean or pair it with skincare products.
Online retail is gaining ground, especially for simpler tools. Direct channels remain more relevant for higher-priced or technology-led devices because buyers may want a demonstration and access to warranty or after-sales support. Professional aesthetic suppliers commonly emphasize demos and post-purchase service as part of the buying process.
What is accelerating Massaging Cosmetic Applicators Market adoption, and what is holding it back?
Adoption is being accelerated by deeper skin-care routines, at-home beauty-device use, professional-to-home crossover, greater e-commerce discovery and a wider choice of mechanical, vibration, heat and light technologies. Growth is constrained by inconsistent evidence across device modalities, the need to keep cosmetic claims within regulatory boundaries, price sensitivity for premium powered tools, hygiene requirements for reusable contact surfaces and long replacement cycles for durable manual applicators.
Drivers Impact Analysis
| Factor | (~) % Impact on CAGR | Geographic Relevance | Impact Timeline |
|---|---|---|---|
| Expansion of daily skin-care and anti-aging routines | +1.3% | Global | Short term (<= 2 years) |
| At-home beauty-device adoption and convenience | +1.1% | USA, Germany, UK and Japan | Medium term (2-4 years) |
| Mechanical, vibration, heat and light product innovation | +0.9% | Global | Medium term (2-4 years) |
| Clinic-to-home recommendation and device retail | +0.7% | USA, Germany and UK | Medium term (2-4 years) |
| Online discovery and social-commerce education | +0.6% | Brazil, USA and Germany | Short term (<= 2 years) |
Source: Fact.MR analysis. Updated Aug 28, 2026
Opportunity Impact Analysis
| Factor | (~) % Impact on CAGR | Geographic Relevance | Impact Timeline |
|---|---|---|---|
| Hybrid and smart-integrated multi-function devices | +0.9% | Japan, Germany and USA | Medium term (2-4 years) |
| Scalp and body applicator category expansion | +0.7% | Brazil, USA and Japan | Medium term (2-4 years) |
| Professional-grade systems for clinics and salons | +0.6% | USA, UK and Germany | Long term (>= 4 years) |
| Brand-owned direct-to-consumer ecosystems | +0.5% | Global | Short term (<= 2 years) |
Source: Fact.MR analysis. Updated Aug 28, 2026
Restraints Impact Analysis
| Factor | (~) % Impact on CAGR | Geographic Relevance | Impact Timeline |
|---|---|---|---|
| Evidence gaps across higher-intensity home-use modalities | -0.8% | Global | Medium term (2-4 years) |
| Regulatory limits on therapeutic and structure-function claims | -0.7% | USA, UK and Europe | Short term (<= 2 years) |
| Premium device price sensitivity and long replacement cycles | -0.6% | Global | Medium term (2-4 years) |
| Cleaning, hygiene and skin-sensitivity concerns | -0.4% | Global | Short term (<= 2 years) |
Source: Fact.MR analysis. Updated Aug 28, 2026
Which countries are scaling the Massaging Cosmetic Applicators Market through 2036?
- Germany: Beauty and home-care sales reached EUR 23.9 billion, approximately USD 27.8 billion, in 2025, while e-commerce recorded the strongest channel growth. This gives massaging applicators room to grow through everyday skincare routines and online discovery, particularly for products that can be demonstrated clearly through digital content.
- Brazil: Brazil’s beauty and personal-care sector generated about R$ 200 billion, approximately USD 38.8 billion, in 2025. Strong household penetration and frequent product launches create a broad customer base for facial, body and scalp applicators sold through beauty stores, pharmacies and online channels.
- USA: Average household spending on personal care products and services reached USD 978 in 2024, up 2.9% from 2023. This established spending base supports demand across home-use applicators and devices recommended through clinics or specialist beauty channels.
- UK: The beauty industry directly contributed GBP 15.9 billion, approximately USD 21.6 billion, to UK GDP in 2024. A developed beauty market spanning professional services and online retail supports applicators that move between salon recommendations and home routines.
- Japan: Cosmetics shipments reached about JPY 1.37 trillion, approximately USD 8.6 billion, in 2024, with skincare accounting for 44.5% of shipment value. The strong emphasis on skincare creates a natural use case for facial and other applicators designed to become part of regular topical-care routines.
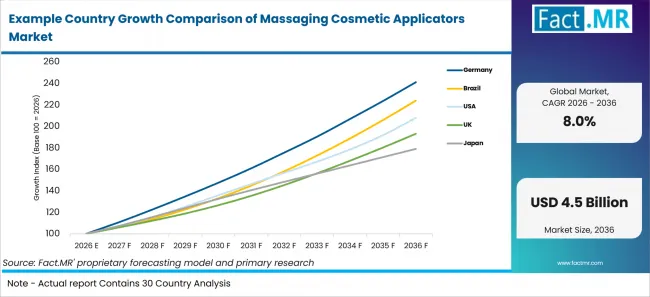
Example Country Growth Comparison Of Massaging Cosmetic Applicators Market | Source: Fact.MR
| Country | CAGR, 2026-2036 |
|---|---|
| Germany | 9.2% |
| Brazil | 8.4% |
| USA | 7.6% |
| UK | 6.8% |
| Japan | 6.0% |
Source: Fact.MR analysis. Updated Aug 28, 2026
What is driving Germany's growth through 2036?
Germany is forecast to expand at a 9.2% CAGR from 2026 to 2036.
Germany has a well-established cosmetics and personal-care market, valued by Cosmetics Europe at EUR 18.0 billion, approximately USD 21.0 billion, in 2025. IKW also identified e-commerce as the strongest-growing sales channel. This gives applicator brands access to a large skincare customer base while making visually demonstrated products easier to sell online.
Demand spans simple rollers and pressure-based tools as well as vibration, heat and light devices. Direct channels remain useful for explaining premium products, while e-commerce supports replacement purchases and skincare-device bundles.
What is driving Brazil's growth through 2036?
Brazil is forecast to expand at an 8.4% CAGR from 2026 to 2036.
Brazil's beauty and personal-care sector generated about R$ 200 billion, approximately USD 38.8 billion, in 2025, according to ABIHPEC. The association also reported 7,359 product launches during the year. Active skincare product development creates opportunities for applicators used with anti-aging, hydration and body-care routines.
Brands can reach consumers through beauty stores, pharmacies and direct-selling channels, while digital commerce provides another route for demonstrating how applicators are used with topical products.
What is driving USA's growth through 2036?
The USA is forecast to expand at a 7.6% CAGR from 2026 to 2036.
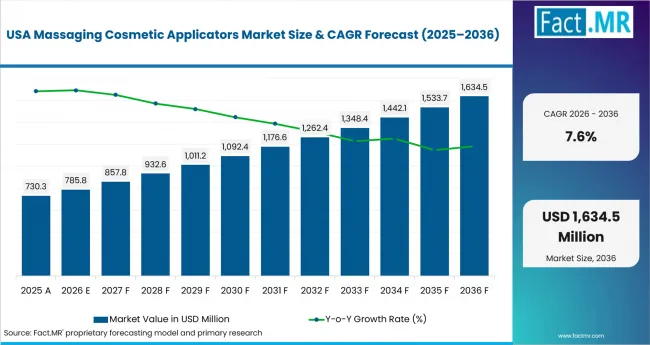
Massaging Cosmetic Applicators Market Country Value Analysis | Source: Fact.MR
Average household spending on personal care products and services reached USD 978 in 2024, according to the U.S. Bureau of Labor Statistics. This established spending base supports inexpensive manual applicators as well as higher-priced home-use devices when they become part of regular skincare routines.
Regulation becomes more relevant as devices add technology or make stronger claims. The FDA may regulate an aesthetic product as a medical device depending on its intended use and its effect on body structure or function. Clear instructions and carefully defined cosmetic claims therefore matter more for technology-led products.
What is driving UK's growth through 2036?
The UK is forecast to expand at a 6.8% CAGR from 2026 to 2036.
The British Beauty Council estimated that the beauty sector directly contributed GBP 15.9 billion, approximately USD 21.6 billion, to UK GDP in 2024 and supported 496,000 jobs. Its combination of beauty retail and professional services gives applicator brands access to home users as well as salon and spa customers.
Safety and product instructions remain important, particularly when applicators are used professionally or bundled with cosmetics. Clear cleaning guidance and durable contact surfaces can therefore influence purchasing alongside appearance and functionality.
What is driving Japan's growth through 2036?
Japan is forecast to expand at a 6.0% CAGR from 2026 to 2036.
Japan's cosmetics shipments reached JPY 1.3745 trillion, approximately USD 8.6 billion, in 2024, up 5.5%, according to the Japan Cosmetic Industry Association. Skin care accounted for 44.5% of shipment value, giving facial and eye-area applicators a natural place within established daily routines.
Demand extends from mechanical rollers to compact vibrating and multi-function devices. Salons and clinics provide an additional route for products where demonstration and consistent treatment protocols matter more than portability.
Who Leads the Massaging Cosmetic Applicators Market?
Key players in the Massaging Cosmetic Applicators Market include Estée Lauder Companies Inc., L'Oréal S.A., The Procter & Gamble Company, Unilever PLC, Shiseido Company, Limited, Beiersdorf AG, Coty Inc., Henkel AG & Co. KGaA, Amorepacific Corporation, FOREO, NuFACE, ReFa, Trophy Skin, Dermaflash, Clarisonic, Avon Products Inc., Mary Kay Inc., Nu Skin Enterprises, Nature Republic, Ozomax and TNT Global Manufacturing.
Competition varies considerably by product type. Manual applicators are judged mainly on comfort, durability and ease of cleaning. Powered devices add other considerations such as vibration consistency, temperature control, charging convenience and user guidance.
Distribution also affects how suppliers compete. Beauty groups can pair applicators with existing skincare products and use their retail relationships to explain usage. Specialist device brands compete more directly through product engineering, portability and features designed around repeat treatment routines.
Professional buyers place additional weight on cleaning requirements and dependable performance because devices may be used repeatedly throughout the day. Warranty and after-sales support can therefore influence supplier selection more strongly in clinics and salons than in occasional home use.
Which companies are the key providers?
Estée Lauder Companies Inc., L'Oréal S.A., The Procter & Gamble Company, Unilever PLC, Shiseido Company, Limited, Beiersdorf AG, Coty Inc., Henkel AG & Co. KGaA, Amorepacific Corporation, FOREO, NuFACE, ReFa, Trophy Skin, Dermaflash, Clarisonic, Avon Products Inc., Mary Kay Inc., Nu Skin Enterprises, Nature Republic, Ozomax and TNT Global Manufacturing.
- Estée Lauder Companies Inc.
- L'Oréal S.A.
- The Procter & Gamble Company
- Unilever PLC
- Shiseido Company, Limited
- Beiersdorf AG
- Coty Inc.
- Henkel AG & Co. KGaA
- Amorepacific Corporation
- FOREO
- NuFACE
- ReFa
- Trophy Skin
- Dermaflash
- Clarisonic
- Avon Products Inc.
- Mary Kay Inc.
- Nu Skin Enterprises
- Nature Republic
- Ozomax
- TNT Global Manufacturing
Bibliography
- Cosmetics Europe. (2025). Our Industry: Economic Value of the Cosmetics and Personal Care Industry. Cosmetics Europe.
- Industrieverband Körperpflege- und Waschmittel. (2025). Market Data: Renewed Growth for the Beauty and Home Care Industry. IKW.
- Associação Brasileira da Indústria de Higiene Pessoal, Perfumaria e Cosméticos. (2026). Tamanho do mercado de beleza e cuidados pessoais no Brasil. ABIHPEC.
- U.S. Bureau of Labor Statistics. (2026). Consumer Expenditures in 2024. U.S. Department of Labor.
- British Beauty Council. (2025). The Value of Beauty 2025. British Beauty Council.
- Office for Product Safety and Standards. (2025). Consumer Products: Cosmetics. UK Government.
- Japan Cosmetic Industry Association. (2025). Cosmetics Shipments. Japan Cosmetic Industry Association.
- U.S. Food and Drug Administration. (2024). Aesthetic (Cosmetic) Devices. U.S. Department of Health and Human Services.
- U.S. Food and Drug Administration. (2024). Cosmetics Labeling Claims. U.S. Department of Health and Human Services.
- European Commission. (2025). Regulation (EC) No 1223/2009 on Cosmetic Products, consolidated text. European Union.
- Miyaji, A., Sugimori, K., and Hayashi, N. (2018). Short- and long-term effects of using a facial massage roller on facial skin blood flow and vascular reactivity. Complementary Therapies in Medicine.
- Raef, H. S., Gaumond, S. I., Geisler, A. N., and Eber, A. E. (2026). Home-Based Dermatologic Devices for Acne and Rejuvenation: Evidence-Based Insights. Dermatologic Surgery.
- Bu, P., Duan, R., Luo, J., Yang, T., Liu, N., and Wen, C. (2024). Development of Home Beauty Devices for Facial Rejuvenation: Establishment of Efficacy Evaluation System. Clinical, Cosmetic and Investigational Dermatology.
This Report Answers
- Which massaging cosmetic applicator products fit daily facial, eye-area, body and scalp routines?
- Why do skin-care applications account for the leading application share?
- How do mechanical, vibration, heat and light technologies differ in buyer requirements?
- What makes direct sales important even as online beauty-device purchasing expands?
- Which safety, claims and design factors influence professional and home-use adoption?
What does the Massaging Cosmetic Applicators Market cover?
The Massaging Cosmetic Applicators Market covers complete non-invasive tools and devices used to apply massage, pressure, vibration, controlled heat or light during cosmetic and personal-care routines for the face, eye area, body and scalp. Revenue is counted for applicator products sold through the Product, Application, End Use, Technology, Formulation and Distribution Channel taxonomy specified in the assessment.
The Formulation label refers to system formats such as non-invasive, hybrid, portable and professional-grade cosmetic systems rather than the chemical formulation of a topical cosmetic product.
What is included in the scope?
The scope includes roller-based and vibrating facial applicators, under-eye and contour tools, handheld and targeted body massagers, scalp massage and stimulation applicators, mechanical, vibration, thermal and light-based technologies, and the specified non-invasive, hybrid, portable and professional-grade systems when sold as complete cosmetic applicator devices.
Included end uses cover beauty and cosmetic clinics, dermatology clinics, spas, homecare users, personal-care consumers, salons, boutique beauty studios, wellness centers and fitness or recovery clinics. Distribution includes direct sales, online retail, specialty stores and pharmacy or drug-store channels within the defined hierarchy.
What is excluded from the scope?
The scope excludes topical cosmetics sold without an applicator device, invasive microneedling or needle-based systems, surgical aesthetic equipment, implantable devices and products intended primarily to diagnose, prevent or treat disease. Medical aesthetic devices are excluded when their principal commercial use falls outside cosmetic massage or non-invasive beauty care.
Standalone replacement batteries, generic charging accessories, unrelated massage equipment, salon service revenue and single-use cosmetic packaging components are excluded unless they are sold as part of a complete massaging cosmetic applicator system.
How Was the Analysis Built?
The analysis combines primary interviews, regulatory and scientific research, company portfolio review and market sizing across the specified countries and segment hierarchy.
- Primary Research: Interviews with beauty-device buyers, clinic and spa operators, salon professionals, distributors, direct sellers, pharmacy buyers, cosmetic brands and consumers examine purchase triggers, routine frequency, price points, motion or energy preference, cleaning practices, replacement behavior, training needs and channel choice.
- Desk Research: The review covers national and industry beauty-sector statistics, cosmetic and aesthetic-device regulations, peer-reviewed evidence on facial massage and home-use devices, company product portfolios and public consumer-spending indicators. Evidence used to explain market mechanisms is recorded in the bibliography.
- Market Sizing and Forecasting: Estimates combine device demand by end use, average selling price, manual-versus-powered mix, application frequency, beauty-sector spending, professional-service activity, channel mix, replacement cycles and country-level adoption of at-home beauty technology.
- Data Validation and Update Cycle: Market estimates are checked against company activity, public indicators and buyer interviews. Updates account for changes in beauty spending, device technology, regulatory treatment, online retail, professional adoption, pricing and replacement behavior.
Segmentation
What is the report's scope and coverage?
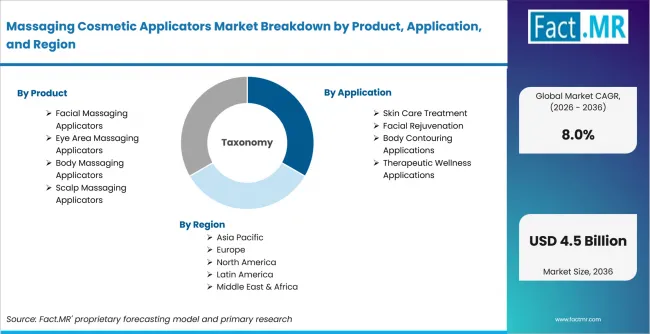
Massaging Cosmetic Applicators Market Breakdown By Product, Application, And Region | Source: Fact.MR
| Attribute | Details |
|---|---|
| Quantitative Units | USD billion |
| Market Definition | Non-invasive cosmetic applicators used to apply massage, pressure, vibration, controlled heat or light during facial, eye-area, body and scalp care routines |
| Segments Covered | Product; Application; End Use; Technology; Formulation; Distribution Channel |
| Regions Covered | North America; Latin America; Europe; East Asia; South Asia and Pacific; Middle East and Africa |
| Countries Covered | Germany; Brazil; USA; UK; Japan |
| Key Companies Profiled | Estée Lauder Companies Inc.; L'Oréal S.A.; The Procter & Gamble Company; Unilever PLC; Shiseido Company, Limited; Beiersdorf AG; Coty Inc.; Henkel AG & Co. KGaA; Amorepacific Corporation; FOREO; NuFACE; ReFa; Trophy Skin; Dermaflash; Clarisonic; Avon Products Inc.; Mary Kay Inc.; Nu Skin Enterprises; Nature Republic; Ozomax; TNT Global Manufacturing |
| Forecast Period | 2026 to 2036 |
| Base Year | 2025 |
| Market Value, 2026 | USD 2.1 billion |
| Market Value, 2036 | USD 4.5 billion |
| CAGR, 2026-2036 | 8.0% |
| Absolute Opportunity | USD 2.4 billion |
| Approach | Hybrid top-down and bottom-up approach using beauty spending, device demand, average selling price, professional and home-use mix, channel structure, technology mix and replacement cycles |
Source: Fact.MR analysis. Updated Aug 28, 2026
How is the market segmented?
-
By Product:
- Facial Massaging Applicators
- Roller Based Applicators
- Vibrating Facial Applicators
- Eye Area Massaging Applicators
- Under Eye Roller Devices
- Eye Contour Sculpting Tools
- Body Massaging Applicators
- Handheld Body Massagers
- Targeted Body Applicators
- Scalp Massaging Applicators
- Hair Growth Stimulation Devices
- Therapeutic Scalp Applicators
- Facial Massaging Applicators
-
By Application:
- Skin Care Treatment
- Anti-Aging Treatments
- Hydration Enhancement Applications
- Facial Rejuvenation
- Collagen Stimulation Applications
- Glow Enhancement Applications
- Body Contouring Applications
- Fat Reduction Treatments
- Skin Smoothing Applications
- Therapeutic Wellness Applications
- Stress Relief Applications
- Circulation Improvement Applications
- Skin Care Treatment
-
By End Use
- Beauty & Cosmetic Clinics
- Dermatology Clinics
- Spa & Wellness Centers
- Homecare Users
- Personal Care Consumers
- Professional Home Devices
- Salons & Beauty Parlors
- Hair & Beauty Salons
- Boutique Beauty Studios
- Wellness & Fitness Centers
- Holistic Wellness Centers
- Fitness & Recovery Clinics
- Beauty & Cosmetic Clinics
-
By Technology
- Mechanical Massage Technology
- Manual Pressure Systems
- Rotational Massage Systems
- Vibration Based Technology
- Micro Vibration Systems
- Pulsation Technology
- Heat Therapy Technology
- Thermal Massage Systems
- Controlled Temperature Systems
- Light Based Therapy Technology
- LED Therapy Systems
- Phototherapy Systems
- Mechanical Massage Technology
-
By Formulation
- Non-Invasive Cosmetic Systems
- Surface Level Treatment Systems
- Deep Penetration Stimulation Systems
- Hybrid Cosmetic Systems
- Multi Function Devices
- Smart Integrated Systems
- Portable Cosmetic Devices
- Battery Powered Systems
- Compact Travel Devices
- Professional Grade Systems
- Clinical Use Devices
- Salon Grade Devices
- Non-Invasive Cosmetic Systems
-
By Distribution Channel
- Direct Sales
- Brand Owned Stores
- Professional Supply Sales
- Online Retail
- E-Commerce Platforms
- Social Commerce Channels
- Specialty Stores
- Cosmetic Specialty Shops
- Wellness Stores
- Pharmacy & Drug Stores
- Retail Pharmacy Chains
- Online Pharmacy Platforms
- Direct Sales
Frequently Asked Questions
What is the Massaging Cosmetic Applicators Market value in 2026?
At what CAGR is the market projected to grow?
What is the projected market value by 2036?
Which Product leads the market?
Which Application leads the market?
Which End Use leads the market?
Which Technology leads the market?
Which Formulation leads the market?
Which Distribution Channel leads the market?
Which listed country is forecast at a 9.2% CAGR?
Which companies are included in the market assessment?
Who worked on this report


Preview the report firsthand - request a free sample
Free SampleGet the brochure for pricing and purchase details
Download PDF