- Market Value (2025): USD 28.4 Bn
- Estimated Value (2026): USD 29.9 Bn
- Forecast Value (2036): USD 50.6 Bn
- CAGR (2026-2036): 5.4%
What is the Fortified Dairy Products Market forecast to be worth by 2036?
USD 29.9 billion in 2026 to USD 50.6 billion by 2036, at 5.4% CAGR.
- The fortified dairy products market reached USD 28.4 billion in 2025.
- Demand is projected to increase from USD 29.9 billion in 2026 to USD 50.6 billion by 2036.
- The market is expected to expand at 5.4% CAGR from 2026 to 2036.
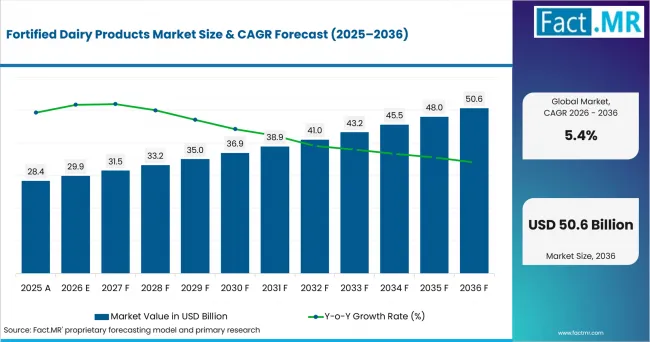
Fortified Dairy Products Market Value Analysis | Source: Fact.MR
What are the defining numbers behind Fortified Dairy Products Market growth?
- USD 20.7 billion in absolute opportunity is expected between 2026 and 2036.
- Demand Drivers in the Market
- Dairy processors use fortification to build differentiated milk, powder, formula, flavored milk, cheese, yogurt, and dairy-dessert lines.
- Vitamin and mineral dosing lets brands address defined nutritional specifications while using familiar dairy formats.
- Modern retail and pharmacy channels give processors controlled routes for assortment, labeling, and product education.
- Quality systems for nutrient stability, dispersion, taste, and declared content shape supplier qualification.
- Key Segments Analyzed
- By Product: Milk accounts for 35.6% in 2026. Milk leads because it offers high household familiarity, repeat purchase, and a direct route for nutrient addition in fresh and UHT formats.
- By Micronutrients: Vitamins accounts for 56.2% in 2026. Vitamins lead because fat-soluble and water-soluble systems support a broad set of positioning choices across liquid and dry dairy products.
- By Sales Channel: Modern Trade accounts for 31.5% in 2026. Modern Trade leads because hypermarkets and supermarkets combine cold-chain reach, shelf comparison, branded assortment, and routine replenishment.
- Analyst Opinion at Fact.MR
- Fact.MR opines, "Fortified dairy succeeds only when the nutrient system survives processing and storage without undermining taste, texture, or label accuracy. Ingredient suppliers gain position by helping dairies control premix dispersion, overage, heat exposure, and analytical verification across milk, powder, formula, yogurt, and cheese lines." - Shambhu Nath Jha, Principal Consultant at Fact.MR.
- Strategic Implications
- Premix and dairy suppliers need application data covering heat treatment, storage, and nutrient retention.
- Processors should align product claims with permitted nutrient sources, declared levels, and country-specific labeling rules.
- Channel strategy must distinguish daily-use milk and yogurt from specialized formula, powder, and pharmacy-oriented products.
How does the Fortified Dairy Products Market break down by segment?
Why does Milk lead Product?
Milk leads Product within the fortified dairy products market. Milk leads because fortified dairy products in fresh and UHT formats offer high household familiarity, repeat purchase, and a direct route for nutrient addition.
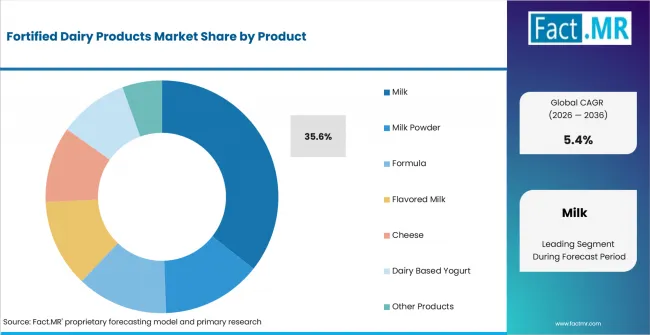
Fortified Dairy Products Market Analysis By Product | Source: Fact.MR
The remaining Product set includes Milk Powder, Formula, Flavored Milk, Cheese, Dairy Based Yogurt, and Other Products. Enriched milk powder, formula, flavored milk, cheese, yogurt, butter, spreads, and dairy desserts address different age groups, storage conditions, textures, and use occasions.
Why does Vitamins lead Micronutrients?
Vitamins leads Micronutrients within the fortified dairy products market. Vitamin B12 and other fat-soluble or water-soluble systems support a broad set of positioning choices across liquid and dry dairy products.
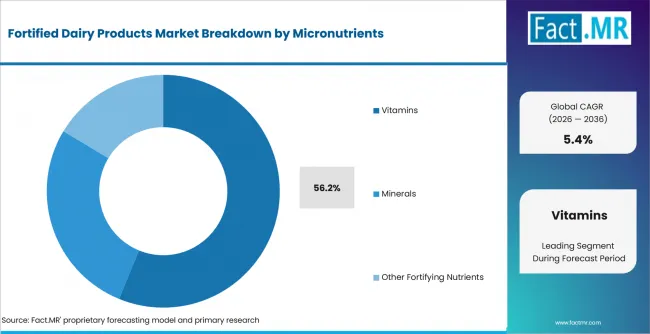
Fortified Dairy Products Market Analysis By Micronutrients | Source: Fact.MR
The remaining Micronutrients set includes Minerals and Other Fortifying Nutrients. Minerals, proteins, prebiotics, probiotics, dairy enzymes, and other fortifying ingredients require different solubility, stability, sensory, and dose-control approaches.
Why does Modern Trade lead Sales Channel?
Modern Trade leads Sales Channel within the fortified dairy products market. Modern Trade leads because hypermarkets and supermarkets combine cold-chain reach, shelf comparison, branded assortment, and routine replenishment.
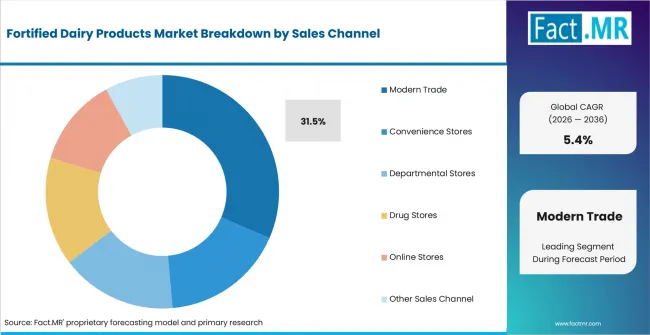
Fortified Dairy Products Market Analysis By Sales Channel | Source: Fact.MR
The remaining Sales Channel set includes Convenience Stores, Departmental Stores, Drug Stores, Online Stores, and Other Sales Channel. Convenience, department, pharmacy, online, foodservice, and specialty channels compete on availability, advisory support, pack format, and fulfillment economics.
What is accelerating Fortified Dairy Products Market adoption, and what is holding it back?
Adoption depends on nutrient stability, sensory acceptance, permitted ingredient sources, label accuracy, cold-chain or shelf-stable distribution, and the processor's ability to validate declared composition. Flavored milk requires added control of taste, color, nutrient stability, and sedimentation.
Drivers Impact Analysis
| DRIVER | (~) % IMPACT ON CAGR | GEOGRAPHIC RELEVANCE | IMPACT TIMELINE |
|---|---|---|---|
| Demand for nutrition-positioned everyday dairy | +1.4% | Global | Short term (<= 2 years) |
| Processor investment in accurate premix dosing | +1.0% | North America, Europe, Asia | Medium term (2-4 years) |
| Expansion of UHT, powder, yogurt, and formula portfolios | +0.9% | Global | Medium term (2-4 years) |
| Retail assortment and product education | +0.7% | Global | Short term (<= 2 years) |
| Supplier support for stability and analytical verification | +0.5% | Global | Long term (> 4 years) |
Opportunity Impact Analysis
| OPPORTUNITY | (~) % IMPACT ON CAGR | GEOGRAPHIC RELEVANCE | IMPACT TIMELINE |
|---|---|---|---|
| Heat-stable vitamin and mineral premixes | +0.9% | Global | Medium term (2-4 years) |
| Fortified products for age- and need-specific nutrition | +0.8% | North America, Europe, Asia | Long term (> 4 years) |
| Shelf-stable and powder formats for wider distribution | +0.7% | Asia, Africa, Latin America | Long term (> 4 years) |
| Online and pharmacy-led specialized dairy ranges | +0.5% | Global | Medium term (2-4 years) |
Restraints Impact Analysis
| RESTRAINT | (~) % IMPACT ON CAGR | GEOGRAPHIC RELEVANCE | IMPACT TIMELINE |
|---|---|---|---|
| Nutrient loss during heat treatment and storage | -0.6% | Global | Short term (<= 2 years) |
| Taste, color, sedimentation, and texture trade-offs | -0.5% | Global | Medium term (2-4 years) |
| Country-specific fortification and labeling controls | -0.5% | Global | Long term (> 4 years) |
| Premix, testing, and cold-chain cost pressure | -0.4% | Global | Short term (<= 2 years) |
Which countries are scaling the Fortified Dairy Products Market through 2036?
- USA: Large dairy processing and retail systems support milk, powder, yogurt, cheese, and formula qualification.
- U.K.: Retail concentration and established dairy categories make label accuracy and sensory acceptance central buying tests.
- France: A broad milk, cheese, yogurt, and dessert base creates multiple fortified-product routes.
- Germany: Large-scale dairy processing rewards repeatable dosing, thermal stability, and documented nutrient content.
- Italy: Milk, cheese, yogurt, and dessert applications create distinct formulation and channel requirements.
- South Korea: Branded dairy beverages, yogurt, formula, and modern retail create room for differentiated nutrient systems.
- Japan: High product turnover and strict quality expectations favor controlled doses and stable sensory performance.
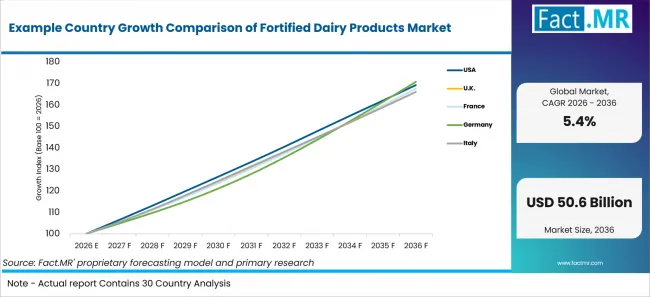
Example Country Growth Comparison Of Fortified Dairy Products Market | Source: Fact.MR
| Country | CAGR (2026-2036) |
|---|---|
| USA | 5.4% |
| U.K. | 5.2% |
| France | 5.3% |
| Germany | 5.5% |
| Italy | 5.2% |
| South Korea | 5.6% |
| Japan | 5.4% |
What is the USA growth outlook through 2036?
The fortified dairy products market in the USA is projected to expand at 5.4% CAGR from 2026 to 2036.
In the United States, FDA's food-fortification policy is codified at 21 CFR 104.20. It establishes principles for rational nutrient addition and discourages indiscriminate fortification that could create nutrient imbalance or misleading claims.
What is the U.K. growth outlook through 2036?
The fortified dairy products market in the U.K. is projected to expand at 5.2% CAGR from 2026 to 2036.
U.K. processors work across fresh milk, UHT, yogurt, cheese, and powder formats. Product decisions therefore balance nutrient claims with composition rules, chilled distribution, shelf life, and taste.
What is the France growth outlook through 2036?
The fortified dairy products market in France is projected to expand at 5.3% CAGR from 2026 to 2036.
Official European dairy statistics capture production across milk and processed dairy categories. French launches still require product-specific decisions on nutrient form, texture, taste, and compliant labeling.
What is the Germany growth outlook through 2036?
The fortified dairy products market in Germany is projected to expand at 5.5% CAGR from 2026 to 2036.
German dairy and food manufacturers operate under harmonized EU rules for vitamins and minerals added to foods. This raises the value of premix traceability and process-specific retention data.
What is the Italy growth outlook through 2036?
The fortified dairy products market in Italy is projected to expand at 5.2% CAGR from 2026 to 2036.
Italy's dairy mix spans fresh and processed products with different heat, moisture, and storage conditions. Fortification programs must therefore be qualified by product matrix rather than transferred unchanged.
What is the South Korea growth outlook through 2036?
The fortified dairy products market in South Korea is projected to expand at 5.6% CAGR from 2026 to 2036.
Korean dairy processors serve convenience-oriented and specialized nutrition formats. Supplier fit depends on dispersion, sensory control, packaging compatibility, and documentation for the intended claim.
What is the Japan growth outlook through 2036?
The fortified dairy products market in Japan is projected to expand at 5.4% CAGR from 2026 to 2036.
Japan's Ministry of Agriculture tracks milk and dairy production, including processed categories. Fortified products face detailed tests for taste, texture, nutrient retention, and pack-size economics.
Who leads the Fortified Dairy Products Market?
Competition spans dairy groups, ingredient suppliers, premix specialists, and food companies with milk, powder, formula, yogurt, cheese, and flavored-product portfolios. Qualification depends on nutrient-system compatibility, processing support, analytical documentation, and channel reach.
Suppliers compete on qualification evidence, fit with the buyer's operating conditions, delivery reliability, and technical support. Competitive positioning varies by product portfolio, end-use coverage, regional reach, and service capability.
Which companies are profiled in the Fortified Dairy Products Market?
Key companies profiled include Nestlé S.A.; Danone SA; Arla Foods amba; Fonterra Co-operative Group; General Mills, Inc.; Bright Dairy & Food Co., Ltd.; China Mengniu Dairy Company Limited; Gujarat Cooperative Milk Marketing Federation Ltd.; and BASF SE.
- Nestlé S.A.
- Danone SA
- Arla Foods amba
- Fonterra Co-operative Group
- General Mills, Inc.
- Bright Dairy & Food Co., Ltd.
- China Mengniu Dairy Company Limited
- Gujarat Cooperative Milk Marketing Federation Ltd
- BASF SE
Research Sources and Bibliography
- World Health Organization and Food and Agriculture Organization. Guidelines on Food Fortification with Micronutrients.
- European Commission. Addition of Vitamins and Minerals.
- U.S. Department of Agriculture, Economic Research Service. Dairy Data.
- U.S. Department of Agriculture, National Agricultural Statistics Service. Dairy Products 2025 Summary.
- Japan Ministry of Agriculture, Forestry and Fisheries. Milk and Dairy Products Statistics Survey.
- Eurostat. Milk and Milk Product Statistics.
- U.S. Food and Drug Administration. Questions and Answers on FDA's Fortification Policy.
- Electronic Code of Federal Regulations. 21 CFR 104.20, Nutritional Quality of Foods.
- Codex Alimentarius Commission. General Principles for the Addition of Essential Nutrients to Foods.
This Report Answers
- The report assesses the fortified dairy products market by Product, Micronutrients, Sales Channel, and Region.
- It compares the complete taxonomy and explains every listed alternative qualitatively.
- Country analysis covers USA, U.K., France, Germany, Italy, South Korea, and Japan.
- The competitive review compares product portfolios, application coverage, regional reach, and technical positioning.
- The scope separates fortified dairy products demand from adjacent products, equipment, and services.
What does the Fortified Dairy Products Market cover?
Dairy foods and beverages to which vitamins, minerals, proteins, prebiotics, probiotics, or other approved nutrients are added to deliver a defined nutritional composition beyond the unfortified product.
What is included in scope?
Every listed subsegment under Product, Micronutrients, and Sales Channel, together with the regional coverage across seven regions.
What is excluded from the scope?
Plant-based beverages without dairy ingredients; Standalone dietary supplements; Unfortified dairy products where no added nutrient system is used; Equipment and testing services sold without the fortified dairy product.
How Was the Analysis Built?
Fact.MR is of the opinion that this assessment combines structured market inputs with a review of public information and industry evidence relevant to the fortified dairy products market.
- Primary Research: Research design covers dairy processors, nutrition and premix suppliers, retail buyers, quality teams, regulatory specialists, and distributors.
- Desk Research: Review covers food-fortification rules, dairy production statistics, nutrient-source permissions, label controls, and official company information.
- Market Sizing and Forecasting: Market inputs are assessed against dairy-product volumes, realized prices, product mix, nutrient-system use, channel mix, and country-level commercial activity.
- Data Validation and Update Cycle: Historical progression, forecast values, CAGR, absolute opportunity, country rates, segment logic, and taxonomy sequence are cross-checked across the forecast period and refreshed through Fact.MR's scheduled update cycle.
Research Scope and Coverage
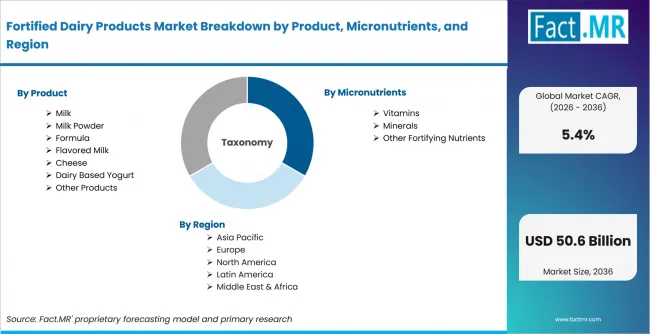
Fortified Dairy Products Market Breakdown By Product, Micronutrients, And Region | Source: Fact.MR
| Attribute | Details |
|---|---|
| Quantitative Units | USD billion |
| Market Definition | Dairy foods and beverages to which vitamins, minerals, proteins, prebiotics, probiotics, or other approved nutrients are added to deliver a defined nutritional composition beyond the unfortified product. |
| Segments Covered | Product; Micronutrients; Sales Channel |
| Regions Covered | North America; Latin America; Western Europe; Eastern Europe; East Asia; South Asia & Pacific; Middle East & Africa |
| Countries Covered | USA; U.K.; France; Germany; Italy; South Korea; Japan |
| Companies Included | Nestlé S.A.; Danone SA; Arla Foods amba; Fonterra Co-operative Group; General Mills, Inc.; Bright Dairy & Food Co., Ltd.; China Mengniu Dairy Company Limited; Gujarat Cooperative Milk Marketing Federation Ltd; BASF SE |
| Forecast Period | 2026 to 2036 |
| Base Year | 2025 |
| Market Value, 2025 | USD 28.4 billion |
| Market Value, 2026 | USD 29.9 billion |
| Market Value, 2036 | USD 50.6 billion |
| CAGR, 2026-2036 | 5.4% |
| Absolute Opportunity | USD 20.7 billion |
| Approach | Assessment considers dairy-product volumes, realized prices, product mix, nutrient-system use, channel mix, and country-level commercial activity. |
Market Breakdown by Segments
-
By Product
- Milk
- Fresh Milk
- UHT Milk
- Milk Powder
- Whole Milk Powder
- Skimmed Milk Powder
- Formula
- Infant Formula
- Follow On Formula
- Flavored Milk
- Dairy Based Flavored Milk
- Functional Flavored Milk
- Cheese
- Natural Cheese
- Processed Cheese
- Dairy Based Yogurt
- Set Yogurt
- Drinking Yogurt
- Other Products
- Butter And Spreads
- Dairy Desserts
- Milk
-
By Micronutrients
- Vitamins
- Fat Soluble Vitamins
- Water Soluble Vitamins
- Minerals
- Macrominerals
- Trace Minerals
- Other Fortifying Nutrients
- Proteins
- Prebiotics And Probiotics
- Vitamins
-
By Sales Channel
- Modern Trade
- Hypermarkets
- Supermarkets
- Convenience Stores
- Independent Stores
- Chain Convenience Stores
- Departmental Stores
- General Merchandise Stores
- Premium Department Stores
- Drug Stores
- Pharmacy Chains
- Independent Pharmacies
- Online Stores
- E Commerce Platforms
- Brand Owned Stores
- Other Sales Channel
- Foodservice
- Specialty Stores
- Modern Trade
-
By Region
- North America
- Latin America
- Western Europe
- Eastern Europe
- East Asia
- South Asia & Pacific
- Middle East & Africa