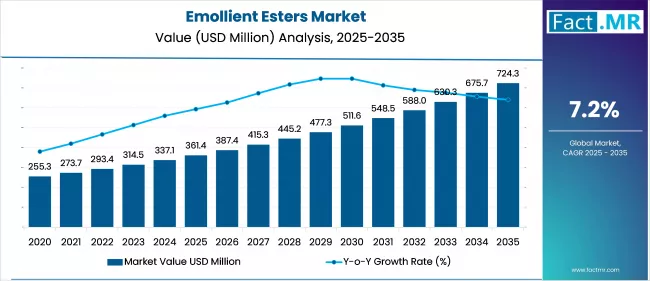
Emollient Esters Market

Emollient Esters Market Analysis, By Product, By Source, By Application, By Form, and Region - Market Insights 2025 to 2035

Analysis of Emollient Esters Market Covering 30+ Countries Including Analysis of US, Canada, UK, Germany, France, Nordics, GCC countries, Japan, Korea and many more.

Emollient Esters Market Outlook from 2025 to 2035

The global emollient esters market is projected to increase from USD 361.4 million in 2025 to USD 724.3 million by 2035, with a CAGR of 7.2% during the forecast period. Growth is driven by rising popularity of clean beauty, natural formulations, and multifunctional esters like isopropyl palmitate and caprylic/capric triglyceride. Their use in skincare and personal care products makes them ideal for enhancing skin feel, improving spreadability, and delivering moisturization without greasiness.

Emollient Esters Market

What are the Drivers of the Emollient Esters Market?

The emollient esters market is gaining momentum, supported by a combination of industry trends and evolving consumer expectations in the personal care and cosmetics sectors.

A major growth driver is the increased demand for skin-friendly and multifunctional ingredients in formulations. Emollient esters improve texture, spread ability, and moisture retention in products like creams, lotions, sunscreens, and hair conditioners. Their ability to deliver a non-greasy, smooth feel while enhancing product stability makes them highly desirable across product categories.

The rise of clean beauty and natural formulations is also pushing demand. Consumers are actively seeking products free from mineral oils, silicones, and harsh synthetic additives. Emollient esters derived from natural sources such as jojoba, sunflower, and coconut are increasingly being incorporated into plant-based and vegan cosmetic lines in North America and Europe.

Growing awareness around sensitive skin care and demand for hypoallergenic solutions have further accelerated interest in mild, non-comedogenic esters that provide hydration without causing irritation or pore blockage. In addition, regulatory support for sustainable and biodegradable ingredients, especially in the EU and Japan, has led manufacturers to shift away from traditional petrochemicals toward environmentally compliant ester alternatives.

The market is also benefiting from technological advancements in green chemistry, enabling producers to offer tailored emollient profiles with improved oxidative stability, longer shelf life, and enhanced sensory appeal. This is particularly relevant in premium personal care, baby care, and dermo cosmetics. Together, these factors position emollient esters as essential components in the evolving landscape of modern cosmetic and skincare formulations.

What are the Regional Trends of the Emollient Esters Market?

The emollient esters market shows distinct regional dynamics, shaped by variations in consumer preferences, regulatory frameworks, and industrial capabilities across key geographies.

Asia-Pacific leads global demand, driven by its dominant personal care and cosmetics manufacturing base. Countries like South Korea, China, India, and Japan are witnessing strong growth due to rising disposable incomes, growing beauty consciousness, and a shift toward multifunctional skincare products. South Korea’s K-beauty segment continues to set product innovation standards, relying heavily on mild and fast-absorbing emollients to meet consumer expectations for lightweight, layered skincare.

In Europe, the demand is underpinned by a well-established cosmetics industry with a strong focus on sustainability, ingredient transparency, and regulatory compliance. The EU’s REACH regulation has pushed manufacturers to adopt biodegradable and plant-based esters, aligning with the region's preference for clean-label and vegan formulations. Markets like Germany, France, and Italy are especially active in R&D and production of natural emollient blends.

North America remains a major consumer, with the U.S. at the forefront of demand for high-performance skincare and dermo cosmetic products. Consumer interest in dermatologist-tested and sensitive-skin-friendly formulations supports the use of esters with low irritation potential and proven moisturizing efficacy. The region is also witnessing the rising adoption of esters in men’s grooming and anti-aging solutions.

Meanwhile, Latin America and the Middle East & Africa are emerging markets, showing increasing uptake of premium personal care products. In Brazil and the UAE, for instance, rapid urbanization, expanding middle-class populations, and growing awareness of skincare routines are contributing to the rising demand for effective, affordable emollients.

What are the Challenges and Restraining Factors of the Emollient Esters Market?

The emollient esters market faces key hurdles that could affect its growth trajectory. Fluctuating prices of raw materials like palm and coconut oil impact production costs, especially for natural-origin esters. Strict regulatory frameworks across regions, such as EU REACH and U.S. FDA labeling laws, require extensive compliance efforts, slowing product development.

Formulation challenges also persist, as some esters may be unstable in certain cosmetic systems or interact poorly with active ingredients. Additionally, the push for sustainable, high-performance alternatives raises R&D costs, while growing competition from silicones and natural butters puts pressure on ester suppliers to differentiate their offerings.

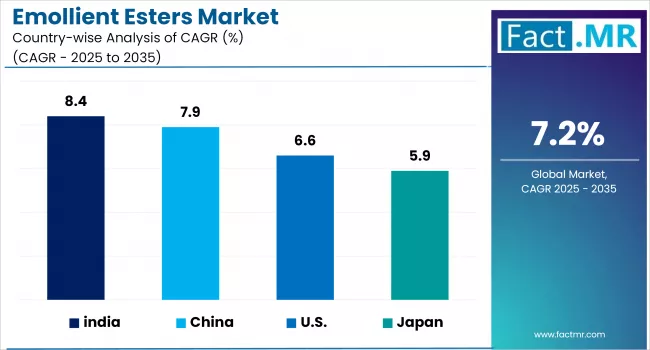
Country-Wise Outlook

Emollient Esters Market Cagr Analysis By Country

U.S. Emollient Esters Market Sees Strong Demand from Skincare Innovation and Clean Beauty Trends

The U.S. emollient esters market is experiencing strong growth, fueled by increasing demand for skin-friendly and multifunctional ingredients across personal care and cosmetic applications. Formulators are favoring esters like caprylic/capric triglyceride and isopropyl palmitate for their non-greasy feel, quick absorption, and compatibility with sensitive skin products.

The rise of clean beauty, coupled with growing consumer awareness of ingredient transparency and sustainability, has encouraged the use of PEG-free, biodegradable, and plant-derived esters. U.S.-based brands are also responding to regulatory pressure by prioritizing safer, eco-conscious formulations that meet both performance and compliance expectations.

United States Emollient Esters Market Value Analysis

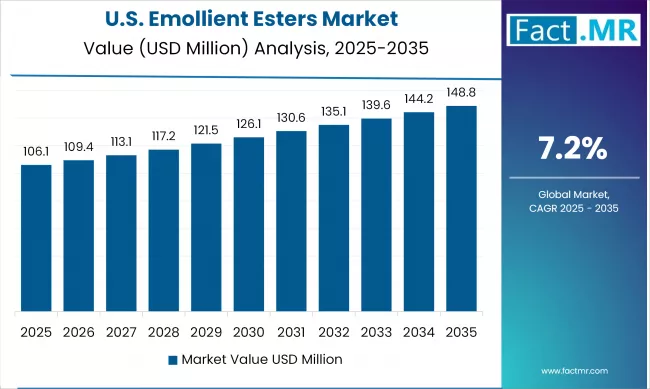
Innovation in green chemistry and biotechnology is enabling domestic producers to create next-generation emollients with improved stability, sensory appeal, and environmental profiles. This trend is especially strong in anti-aging, sun care, and sensitive-skin product lines, solidifying the U.S. as a key market for advanced emollient ester adoption.

China Drives Emollient Esters Market Amid Shifting Consumer Trends and Regulatory Reform

China is playing a pivotal role in the growth of the emollient esters market, driven by rapid urbanization, rising disposable incomes, and evolving consumer preferences toward high-quality personal care products. The country’s booming cosmetics sector, especially in skincare and sun protection, is encouraging manufacturers to incorporate gentle, fast-absorbing esters into moisturizers, lotions, and facial treatments.

With increasing awareness around ingredient safety and performance, there is a growing demand for biodegradable and naturally derived esters in clean-label and sensitive-skin formulations. Chinese consumers are becoming ingredient-conscious, prompting brands to move away from silicones and synthetic oils in favor of plant-based emollients.

At the same time, regulatory shifts mandating clearer labeling and ingredient transparency have raised formulation standards. Global and domestic suppliers are responding with localized manufacturing and R&D investments, enhancing their capacity to meet regional preferences and compliance requirements.

Japan Advances Market Uptake of Emollient Esters Through Sensitivity Care and Innovation Focus

Japan is emerging as a sophisticated market for emollient esters, driven by strong consumer preference for gentle, low-irritant skincare, and a high value placed on formulation precision. Japanese consumers frequently choose products formulated with refined esters such as caprylic/capric triglyceride and cetearyl ethyl hexanoate for their non-greasy texture, enhanced spread ability, and hydrating benefits, commonly found in lotions, sunscreens, and baby care products.

Manufacturers in Japan are placing increasing emphasis on dermatological testing and efficacy validation, strengthening the reputation of emollient esters as safe and effective ingredients. Regulatory programs like the Pharmaceutical and Medical Device Act (PMD Act), which requires cosmetic ingredients to meet rigorous safety and performance standards, further support this trend.

On the innovation front, Japanese R&D firms are at the cutting edge of developing multifunctional emollient esters with added features such as improved oxidative stability, emulsification tolerance, and sensory elegance to support high-end cosmetic and dermo cosmetic brands. This aligns with consumer demand for premium skincare that balances effectiveness with sensorial experience.

Moreover, trends in minimalistic skincare routines, clean-label products, and refined beauty standards are driving formulators to adopt plant-based and PEG-free ester solutions. These align with ecological sensibilities and transparent ingredient labeling, further fueling adoption in markets that prioritize both heritage and modernization in personal care.

Category-wise Analysis

Plant-based to Exhibit Leading by Source

Emollient Esters Market Analysis By Source

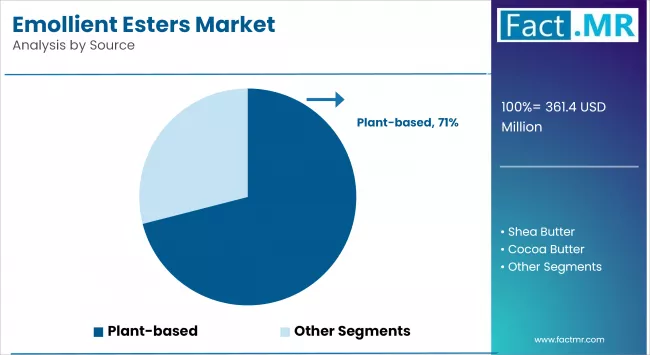
Plant-derived emollient esters are capturing a significant share of the market as manufacturers shift toward sustainable and renewable raw materials. Increasing consumer demand for vegan, cruelty-free, and naturally sourced personal care products has accelerated the adoption of esters produced from coconut, sunflower, and castor oils. Their low toxicity, enhanced skin compatibility, and strong market positioning in the clean beauty space make plant-based esters the preferred choice across both mass and premium formulations.

Isopropyl Myristate to Exhibit Leading By Product

Emollient Esters Market Analysis By Product

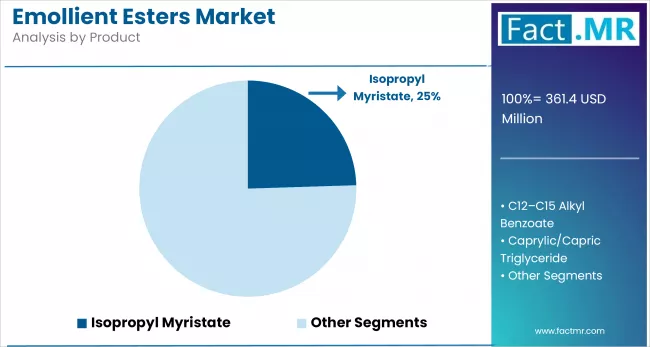
Among various ester compounds, isopropyl myristate continues to stand out for its versatility and performance. Widely used in skincare, haircare, and pharmaceutical preparations, it offers excellent emollience, spread ability, and quick absorption. Its ability to reduce the greasy feel of formulations makes it a staple in sunscreens, lotions, and topical medicinal products. Its dominance is further supported by consistent regulatory acceptance and broad application compatibility.

Liquid to Exhibit Leading by Form

Liquid esters remain the preferred format due to their ease of formulation, uniform application, and compatibility with a wide range of emulsions and oil-based systems. The growing demand for lightweight, fast-absorbing cosmetics and personal care products has solidified liquid esters as the standard in skin and hair formulations. Their fluid nature also makes them ideal for sprayable and pump-delivered products.

Skin Care to Exhibit Leading by Application

Skin care remains the leading application segment for emollient esters, driven by rising consumer interest in moisturizers, anti-aging creams, and sensitive skin solutions. Esters are valued for delivering hydration without clogging pores, making them suitable for daily-use products. The ongoing expansion of facial care, body lotions, and serums, especially those catering to specific concerns like dryness, eczema, and uneven texture, is fueling continued demand.

Asia Pacific Holds Leading Share in the Emollient Esters Market

Asia-Pacific holds the leading share in the global emollient esters market, propelled by strong cosmetics production hubs and rapidly expanding consumer bases. Countries such as China, Japan, South Korea, and India are witnessing a growing uptake of personal care products featuring plant-based and high-performance ingredients. Regional trends such as K-beauty, J-beauty, and Ayurveda-based skincare are contributing to the rising demand for esters with lightweight and functional characteristics. Additionally, local regulatory support for safe and natural ingredients continues to favor market expansion in the region.

Competitive Analysis

The emollient esters market is becoming increasingly competitive, with the presence of established chemical giants and specialized ingredient manufacturers. Leading players such as BASF SE, Evonik Industries AG, Croda International Plc, and Lubrizol Corporation continue to drive innovation through advanced formulation technologies, sustainable raw material sourcing, and global distribution networks.

Companies like Ashland Inc., Solvay SA, and Lonza Group Ltd. are focusing on multifunctional esters designed for premium skincare, haircare, and pharmaceutical applications. These firms are investing in R&D to meet the rising demand for biodegradable, non-irritating, and naturally derived ingredients, especially in Europe and North America, where regulatory pressure and clean-label trends are reshaping formulation priorities.

Specialty producers such as Vantage Specialty Chemicals, Phoenix Chemical Inc., Innospec Inc., and RITA Corporation are leveraging niche expertise and flexible manufacturing capabilities to offer tailored solutions for indie brands and mid-tier manufacturers. These companies often emphasize high purity, sensory innovation, and customized ester blends to stand out in the personal care market.

Meanwhile, Yasho Industries Pvt. Ltd. and ABITEC Corporation are strengthening their global presence by expanding their ester portfolios for both cosmetic and pharmaceutical end-uses. Players like Stepan Company and Lipo Chemicals, Inc. continue to supply emulsifiers and emollients at scale, serving both established brands and contract manufacturers.

Recent Development

  • In 2024, Evonik Industries AG launched Vecollage Fortify L, a vegan, fermentation-based collagen-like polypeptide. This innovative ingredient is vegan collagen-like polypeptide produced through fermentation technology.
  • In 2023, BASF SE introduced Emulgade Verde 10 MS/OL, two natural-based, COSMOS-approved emulsifiers derived from 100% renewable feedstocks, ideal for sensitive skin and eco-friendly formulations. These ingredients are ideal for sensitive skin and eco-friendly formulations.

Segmentation of Emollient Esters Market

  • By Source :

    • Plant-based
    • Shea Butter
    • Cocoa Butter
    • Others
  • By Product :

    • Isopropyl Myristate
    • C12-C15 Alkyl Benzoate
    • Caprylic/Capric Triglyceride
    • Cetyl Palmitate
    • Myristyl Myristate
    • Others
  • By Form :

    • Solid
    • Semi-solid
    • Liquid
    • Powder/Flakes
  • By Application :

    • Skin Care
    • Hair Care
    • Cosmetics
    • Oral Care
  • By Region :

    • North America
    • Europe
    • Asia Pacific
    • Latin America
    • Middle East & Africa

Table of Content

  1. Executive Summary
    • Global Market Outlook
    • Demand-side Trends
    • Supply-side Trends
    • Technology Roadmap Analysis
    • Analysis and Recommendations
  2. Market Overview
    • Market Coverage / Taxonomy
    • Market Definition / Scope / Limitations
  3. Market Background
    • Market Dynamics
      • Drivers
      • Restraints
      • Opportunity
      • Trends
    • Scenario Forecast
      • Demand in Optimistic Scenario
      • Demand in Likely Scenario
      • Demand in Conservative Scenario
    • Opportunity Map Analysis
    • Product Life Cycle Analysis
    • Supply Chain Analysis
      • Supply Side Participants and their Roles
        • Producers
        • Mid-Level Participants (Traders/ Agents/ Brokers)
        • Wholesalers and Distributors
      • Value Added and Value Created at Node in the Supply Chain
      • List of Component Suppliers
      • List of Existing and Potential Buyers
    • Investment Feasibility Matrix
    • Value Chain Analysis
      • Profit Margin Analysis
      • Wholesalers and Distributors
      • Retailers
    • PESTLE and Porter’s Analysis
    • Regulatory Landscape
      • By Key Regions
      • By Key Countries
    • Production and Consumption Statistics
    • Import and Export Statistics
  4. Global Market Analysis 2020 to 2024 and Forecast, 2025 to 2035
    • Historical Market Size Value (USD Mn) & Volume (Tons) Analysis, 2020 to 2024
    • Current and Future Market Size Value (USD Mn) & Volume (Tons) Projections, 2025 to 2035
      • Y-o-Y Growth Trend Analysis
      • Absolute $ Opportunity Analysis
  5. Global Market Pricing Analysis 2020 to 2024 and Forecast 2025 to 2035
  6. Global Market Analysis 2020 to 2024 and Forecast 2025 to 2035, By Source
    • Introduction / Key Findings
    • Historical Market Size Value (USD Mn) & Volume (Tons) Analysis By Source, 2020 to 2024
    • Current and Future Market Size Value (USD Mn) & Volume (Tons) Analysis and Forecast By Source, 2025 to 2035
      • Plant-based
      • Shea Butter
      • Cocoa Butter
      • Others
    • Y-o-Y Growth Trend Analysis By Source, 2020 to 2024
    • Absolute $ Opportunity Analysis By Source, 2025 to 2035
  7. Global Market Analysis 2020 to 2024 and Forecast 2025 to 2035, By Product
    • Introduction / Key Findings
    • Historical Market Size Value (USD Mn) & Volume (Tons) Analysis By Product, 2020 to 2024
    • Current and Future Market Size Value (USD Mn) & Volume (Tons) Analysis and Forecast By Product, 2025 to 2035
      • Isopropyl Myristate
      • C12-C15 Alkyl Benzoate
      • Caprylic/Capric Triglyceride
      • Cetyl Palmitate
      • Myristyl Myristate
      • Others
    • Y-o-Y Growth Trend Analysis By Product, 2020 to 2024
    • Absolute $ Opportunity Analysis By Product, 2025 to 2035
  8. Global Market Analysis 2020 to 2024 and Forecast 2025 to 2035, By Form
    • Introduction / Key Findings
    • Historical Market Size Value (USD Mn) & Volume (Tons) Analysis By Form, 2020 to 2024
    • Current and Future Market Size Value (USD Mn) & Volume (Tons) Analysis and Forecast By Form, 2025 to 2035
      • Solid
      • Semi-solid
      • Liquid
      • Powder/Flakes
    • Y-o-Y Growth Trend Analysis By Form, 2020 to 2024
    • Absolute $ Opportunity Analysis By Form, 2025 to 2035
  9. Global Market Analysis 2020 to 2024 and Forecast 2025 to 2035, By Application
    • Introduction / Key Findings
    • Historical Market Size Value (USD Mn) & Volume (Tons) Analysis By Application, 2020 to 2024
    • Current and Future Market Size Value (USD Mn) & Volume (Tons) Analysis and Forecast By Application, 2025 to 2035
      • Skin Care
      • Hair Care
      • Cosmetics
      • Oral Care
    • Y-o-Y Growth Trend Analysis By Application, 2020 to 2024
    • Absolute $ Opportunity Analysis By Application, 2025 to 2035
  10. Global Market Analysis 2020 to 2024 and Forecast 2025 to 2035, By Region
    • Introduction
    • Historical Market Size Value (USD Mn) & Volume (Tons) Analysis By Region, 2020 to 2024
    • Current Market Size Value (USD Mn) & Volume (Tons) Analysis and Forecast By Region, 2025 to 2035
      • North America
      • Latin America
      • Western Europe
      • East Asia
      • South Asia Pacific
      • Eastern Europe
      • Middle East & Africa
    • Market Attractiveness Analysis By Region
  11. North America Market Analysis 2020 to 2024 and Forecast 2025 to 2035, By Country
    • Historical Market Size Value (USD Mn) & Volume (Tons) Trend Analysis By Market Taxonomy, 2020 to 2024
    • Market Size Value (USD Mn) & Volume (Tons) Forecast By Market Taxonomy, 2025 to 2035
      • By Country
        • U.S.
        • Canada
        • Mexico
      • By Source
      • By Product
      • By Form
      • By Application
    • Market Attractiveness Analysis
      • By Country
      • By Source
      • By Product
      • By Form
      • By Application
    • Key Takeaways
  12. Latin America Market Analysis 2020 to 2024 and Forecast 2025 to 2035, By Country
    • Historical Market Size Value (USD Mn) & Volume (Tons) Trend Analysis By Market Taxonomy, 2020 to 2024
    • Market Size Value (USD Mn) & Volume (Tons) Forecast By Market Taxonomy, 2025 to 2035
      • By Country
        • Brazil
        • Chile
        • Rest of Latin America
      • By Source
      • By Product
      • By Form
      • By Application
    • Market Attractiveness Analysis
      • By Country
      • By Source
      • By Product
      • By Form
      • By Application
    • Key Takeaways
  13. Western Europe Market Analysis 2020 to 2024 and Forecast 2025 to 2035, By Country
    • Historical Market Size Value (USD Mn) & Volume (Tons) Trend Analysis By Market Taxonomy, 2020 to 2024
    • Market Size Value (USD Mn) & Volume (Tons) Forecast By Market Taxonomy, 2025 to 2035
      • By Country
        • Germany
        • Italy
        • France
        • U.K.
        • Spain
        • Russia
        • BENELUX
        • Rest of Europe
      • By Source
      • By Product
      • By Form
      • By Application
    • Market Attractiveness Analysis
      • By Country
      • By Source
      • By Product
      • By Form
      • By Application
    • Key Takeaways
  14. East Asia Market Analysis 2020 to 2024 and Forecast 2025 to 2035, By Country
    • Historical Market Size Value (USD Mn) & Volume (Tons) Trend Analysis By Market Taxonomy, 2020 to 2024
    • Market Size Value (USD Mn) & Volume (Tons) Forecast By Market Taxonomy, 2025 to 2035
      • By Country
        • China
        • Japan
        • South Korea
      • By Source
      • By Product
      • By Form
      • By Application
    • Market Attractiveness Analysis
      • By Country
      • By Source
      • By Product
      • By Form
      • By Application
    • Key Takeaways
  15. South Asia Pacific Market Analysis 2020 to 2024 and Forecast 2025 to 2035, By Country
    • Historical Market Size Value (USD Mn) & Volume (Tons) Trend Analysis By Market Taxonomy, 2020 to 2024
    • Market Size Value (USD Mn) & Volume (Tons) Forecast By Market Taxonomy, 2025 to 2035
      • By Country
        • India
        • ASEAN Countries
        • Australia & New Zealand
        • Rest of South Asia Pacific
      • By Source
      • By Product
      • By Form
      • By Application
    • Market Attractiveness Analysis
      • By Country
      • By Source
      • By Product
      • By Form
      • By Application
    • Key Takeaways
  16. Eastern Europe Market Analysis 2020 to 2024 and Forecast 2025 to 2035, By Country
    • Historical Market Size Value (USD Mn) & Volume (Tons) Trend Analysis By Market Taxonomy, 2020 to 2024
    • Market Size Value (USD Mn) & Volume (Tons) Forecast By Market Taxonomy, 2025 to 2035
      • By Country
        • Russia
        • Poland
        • Hungary
        • Balkan & Baltics
        • Rest of Eastern Europe
      • By Source
      • By Product
      • By Form
      • By Application
    • Market Attractiveness Analysis
      • By Country
      • By Source
      • By Product
      • By Form
      • By Application
    • Key Takeaways
  17. Middle East & Africa Market Analysis 2020 to 2024 and Forecast 2025 to 2035, By Country
    • Historical Market Size Value (USD Mn) & Volume (Tons) Trend Analysis By Market Taxonomy, 2020 to 2024
    • Market Size Value (USD Mn) & Volume (Tons) Forecast By Market Taxonomy, 2025 to 2035
      • By Country
        • KSA
        • Other GCC Countries
        • Turkiye
        • South Africa
        • Rest of MEA
      • By Source
      • By Product
      • By Form
      • By Application
    • Market Attractiveness Analysis
      • By Country
      • By Source
      • By Product
      • By Form
      • By Application
    • Key Takeaways
  18. Key Countries Market Analysis
    • United States
      • Pricing Analysis
      • Market Share Analysis, 2024
        • By Source
        • By Product
        • By Form
        • By Application
    • Germany
      • Pricing Analysis
      • Market Share Analysis, 2024
        • By Source
        • By Product
        • By Form
        • By Application
    • China
      • Pricing Analysis
      • Market Share Analysis, 2024
        • By Source
        • By Product
        • By Form
        • By Application
    • India
      • Pricing Analysis
      • Market Share Analysis, 2024
        • By Source
        • By Product
        • By Form
        • By Application
    • France
      • Pricing Analysis
      • Market Share Analysis, 2024
        • By Source
        • By Product
        • By Form
        • By Application
  19. Market Structure Analysis
    • Competition Dashboard
    • Competition Benchmarking
    • Market Share Analysis of Top Players
      • By Regional
      • By Source
      • By Product
      • By Form
      • By Application
  20. Competition Analysis
    • Competition Deep Dive
      • BASF SE
        • Overview
        • Product Portfolio
        • Profitability by Market Segments (Product/Age /Sales Channel/Region)
        • Sales Footprint
        • Strategy Overview
          • Marketing Strategy
          • Product Strategy
          • Channel Strategy
      • RITA Corporation
        • Overview
        • Product Portfolio
        • Profitability by Market Segments (Product/Age /Sales Channel/Region)
        • Sales Footprint
        • Strategy Overview
          • Marketing Strategy
          • Product Strategy
          • Channel Strategy
      • Ashland Inc.
        • Overview
        • Product Portfolio
        • Profitability by Market Segments (Product/Age /Sales Channel/Region)
        • Sales Footprint
        • Strategy Overview
          • Marketing Strategy
          • Product Strategy
          • Channel Strategy
      • ABITEC Corporation
        • Overview
        • Product Portfolio
        • Profitability by Market Segments (Product/Age /Sales Channel/Region)
        • Sales Footprint
        • Strategy Overview
          • Marketing Strategy
          • Product Strategy
          • Channel Strategy
      • Phoenix Chemical, Inc.
        • Overview
        • Product Portfolio
        • Profitability by Market Segments (Product/Age /Sales Channel/Region)
        • Sales Footprint
        • Strategy Overview
          • Marketing Strategy
          • Product Strategy
          • Channel Strategy
      • Solvay SA
        • Overview
        • Product Portfolio
        • Profitability by Market Segments (Product/Age /Sales Channel/Region)
        • Sales Footprint
        • Strategy Overview
          • Marketing Strategy
          • Product Strategy
          • Channel Strategy
      • Croda International Plc
        • Overview
        • Product Portfolio
        • Profitability by Market Segments (Product/Age /Sales Channel/Region)
        • Sales Footprint
        • Strategy Overview
          • Marketing Strategy
          • Product Strategy
          • Channel Strategy
  21. Assumptions & Acronyms Used
  22. Research Methodology

List Of Table

  • Table 1: Global Market Value (USD Mn) Forecast by Region, 2020 to 2035
  • Table 2: Global Market Volume (Tons) Forecast by Region, 2020 to 2035
  • Table 3: Global Market Value (USD Mn) Forecast by Source, 2020 to 2035
  • Table 4: Global Market Volume (Tons) Forecast by Source, 2020 to 2035
  • Table 5: Global Market Value (USD Mn) Forecast by Product, 2020 to 2035
  • Table 6: Global Market Volume (Tons) Forecast by Product, 2020 to 2035
  • Table 7: Global Market Value (USD Mn) Forecast by Form, 2020 to 2035
  • Table 8: Global Market Volume (Tons) Forecast by Form, 2020 to 2035
  • Table 9: Global Market Value (USD Mn) Forecast by Application, 2020 to 2035
  • Table 10: Global Market Volume (Tons) Forecast by Application, 2020 to 2035
  • Table 11: North America Market Value (USD Mn) Forecast by Country, 2020 to 2035
  • Table 12: North America Market Volume (Tons) Forecast by Country, 2020 to 2035
  • Table 13: North America Market Value (USD Mn) Forecast by Source, 2020 to 2035
  • Table 14: North America Market Volume (Tons) Forecast by Source, 2020 to 2035
  • Table 15: North America Market Value (USD Mn) Forecast by Product, 2020 to 2035
  • Table 16: North America Market Volume (Tons) Forecast by Product, 2020 to 2035
  • Table 17: North America Market Value (USD Mn) Forecast by Form, 2020 to 2035
  • Table 18: North America Market Volume (Tons) Forecast by Form, 2020 to 2035
  • Table 19: North America Market Value (USD Mn) Forecast by Application, 2020 to 2035
  • Table 20: North America Market Volume (Tons) Forecast by Application, 2020 to 2035
  • Table 21: Latin America Market Value (USD Mn) Forecast by Country, 2020 to 2035
  • Table 22: Latin America Market Volume (Tons) Forecast by Country, 2020 to 2035
  • Table 23: Latin America Market Value (USD Mn) Forecast by Source, 2020 to 2035
  • Table 24: Latin America Market Volume (Tons) Forecast by Source, 2020 to 2035
  • Table 25: Latin America Market Value (USD Mn) Forecast by Product, 2020 to 2035
  • Table 26: Latin America Market Volume (Tons) Forecast by Product, 2020 to 2035
  • Table 27: Latin America Market Value (USD Mn) Forecast by Form, 2020 to 2035
  • Table 28: Latin America Market Volume (Tons) Forecast by Form, 2020 to 2035
  • Table 29: Latin America Market Value (USD Mn) Forecast by Application, 2020 to 2035
  • Table 30: Latin America Market Volume (Tons) Forecast by Application, 2020 to 2035
  • Table 31: Western Europe Market Value (USD Mn) Forecast by Country, 2020 to 2035
  • Table 32: Western Europe Market Volume (Tons) Forecast by Country, 2020 to 2035
  • Table 33: Western Europe Market Value (USD Mn) Forecast by Source, 2020 to 2035
  • Table 34: Western Europe Market Volume (Tons) Forecast by Source, 2020 to 2035
  • Table 35: Western Europe Market Value (USD Mn) Forecast by Product, 2020 to 2035
  • Table 36: Western Europe Market Volume (Tons) Forecast by Product, 2020 to 2035
  • Table 37: Western Europe Market Value (USD Mn) Forecast by Form, 2020 to 2035
  • Table 38: Western Europe Market Volume (Tons) Forecast by Form, 2020 to 2035
  • Table 39: Western Europe Market Value (USD Mn) Forecast by Application, 2020 to 2035
  • Table 40: Western Europe Market Volume (Tons) Forecast by Application, 2020 to 2035
  • Table 41: East Asia Market Value (USD Mn) Forecast by Country, 2020 to 2035
  • Table 42: East Asia Market Volume (Tons) Forecast by Country, 2020 to 2035
  • Table 43: East Asia Market Value (USD Mn) Forecast by Source, 2020 to 2035
  • Table 44: East Asia Market Volume (Tons) Forecast by Source, 2020 to 2035
  • Table 45: East Asia Market Value (USD Mn) Forecast by Product, 2020 to 2035
  • Table 46: East Asia Market Volume (Tons) Forecast by Product, 2020 to 2035
  • Table 47: East Asia Market Value (USD Mn) Forecast by Form, 2020 to 2035
  • Table 48: East Asia Market Volume (Tons) Forecast by Form, 2020 to 2035
  • Table 49: East Asia Market Value (USD Mn) Forecast by Application, 2020 to 2035
  • Table 50: East Asia Market Volume (Tons) Forecast by Application, 2020 to 2035
  • Table 51: South Asia Pacific Market Value (USD Mn) Forecast by Country, 2020 to 2035
  • Table 52: South Asia Pacific Market Volume (Tons) Forecast by Country, 2020 to 2035
  • Table 53: South Asia Pacific Market Value (USD Mn) Forecast by Source, 2020 to 2035
  • Table 54: South Asia Pacific Market Volume (Tons) Forecast by Source, 2020 to 2035
  • Table 55: South Asia Pacific Market Value (USD Mn) Forecast by Product, 2020 to 2035
  • Table 56: South Asia Pacific Market Volume (Tons) Forecast by Product, 2020 to 2035
  • Table 57: South Asia Pacific Market Value (USD Mn) Forecast by Form, 2020 to 2035
  • Table 58: South Asia Pacific Market Volume (Tons) Forecast by Form, 2020 to 2035
  • Table 59: South Asia Pacific Market Value (USD Mn) Forecast by Application, 2020 to 2035
  • Table 60: South Asia Pacific Market Volume (Tons) Forecast by Application, 2020 to 2035
  • Table 61: Eastern Europe Market Value (USD Mn) Forecast by Country, 2020 to 2035
  • Table 62: Eastern Europe Market Volume (Tons) Forecast by Country, 2020 to 2035
  • Table 63: Eastern Europe Market Value (USD Mn) Forecast by Source, 2020 to 2035
  • Table 64: Eastern Europe Market Volume (Tons) Forecast by Source, 2020 to 2035
  • Table 65: Eastern Europe Market Value (USD Mn) Forecast by Product, 2020 to 2035
  • Table 66: Eastern Europe Market Volume (Tons) Forecast by Product, 2020 to 2035
  • Table 67: Eastern Europe Market Value (USD Mn) Forecast by Form, 2020 to 2035
  • Table 68: Eastern Europe Market Volume (Tons) Forecast by Form, 2020 to 2035
  • Table 69: Eastern Europe Market Value (USD Mn) Forecast by Application, 2020 to 2035
  • Table 70: Eastern Europe Market Volume (Tons) Forecast by Application, 2020 to 2035
  • Table 71: Middle East & Africa Market Value (USD Mn) Forecast by Country, 2020 to 2035
  • Table 72: Middle East & Africa Market Volume (Tons) Forecast by Country, 2020 to 2035
  • Table 73: Middle East & Africa Market Value (USD Mn) Forecast by Source, 2020 to 2035
  • Table 74: Middle East & Africa Market Volume (Tons) Forecast by Source, 2020 to 2035
  • Table 75: Middle East & Africa Market Value (USD Mn) Forecast by Product, 2020 to 2035
  • Table 76: Middle East & Africa Market Volume (Tons) Forecast by Product, 2020 to 2035
  • Table 77: Middle East & Africa Market Value (USD Mn) Forecast by Form, 2020 to 2035
  • Table 78: Middle East & Africa Market Volume (Tons) Forecast by Form, 2020 to 2035
  • Table 79: Middle East & Africa Market Value (USD Mn) Forecast by Application, 2020 to 2035
  • Table 80: Middle East & Africa Market Volume (Tons) Forecast by Application, 2020 to 2035

List Of Figures

  • Figure 1: Global Market Volume (Tons) Forecast 2020 to 2035
  • Figure 2: Global Market Pricing Analysis
  • Figure 3: Global Market Value (USD Mn) Forecast 2020 to 2035
  • Figure 4: Global Market Value Share and BPS Analysis by Source, 2025 and 2035
  • Figure 5: Global Market Y-o-Y Growth Comparison by Source, 2025 to 2035
  • Figure 6: Global Market Attractiveness Analysis by Source
  • Figure 7: Global Market Value Share and BPS Analysis by Product, 2025 and 2035
  • Figure 8: Global Market Y-o-Y Growth Comparison by Product, 2025 to 2035
  • Figure 9: Global Market Attractiveness Analysis by Product
  • Figure 10: Global Market Value Share and BPS Analysis by Form, 2025 and 2035
  • Figure 11: Global Market Y-o-Y Growth Comparison by Form, 2025 to 2035
  • Figure 12: Global Market Attractiveness Analysis by Form
  • Figure 13: Global Market Value Share and BPS Analysis by Application, 2025 and 2035
  • Figure 14: Global Market Y-o-Y Growth Comparison by Application, 2025 to 2035
  • Figure 15: Global Market Attractiveness Analysis by Application
  • Figure 16: Global Market Value (USD Mn) Share and BPS Analysis by Region, 2025 and 2035
  • Figure 17: Global Market Y-o-Y Growth Comparison by Region, 2025 to 2035
  • Figure 18: Global Market Attractiveness Analysis by Region
  • Figure 19: North America Market Incremental $ Opportunity, 2025 to 2035
  • Figure 20: Latin America Market Incremental $ Opportunity, 2025 to 2035
  • Figure 21: Western Europe Market Incremental $ Opportunity, 2025 to 2035
  • Figure 22: East Asia Market Incremental $ Opportunity, 2025 to 2035
  • Figure 23: South Asia Pacific Market Incremental $ Opportunity, 2025 to 2035
  • Figure 24: Eastern Europe Market Incremental $ Opportunity, 2025 to 2035
  • Figure 25: Middle East & Africa Market Incremental $ Opportunity, 2025 to 2035
  • Figure 26: North America Market Value Share and BPS Analysis by Country, 2025 and 2035
  • Figure 27: North America Market Value Share and BPS Analysis by Source, 2025 and 2035
  • Figure 28: North America Market Y-o-Y Growth Comparison by Source, 2025 to 2035
  • Figure 29: North America Market Attractiveness Analysis by Source
  • Figure 30: North America Market Value Share and BPS Analysis by Product, 2025 and 2035
  • Figure 31: North America Market Y-o-Y Growth Comparison by Product, 2025 to 2035
  • Figure 32: North America Market Attractiveness Analysis by Product
  • Figure 33: North America Market Value Share and BPS Analysis by Form, 2025 and 2035
  • Figure 34: North America Market Y-o-Y Growth Comparison by Form, 2025 to 2035
  • Figure 35: North America Market Attractiveness Analysis by Form
  • Figure 36: North America Market Value Share and BPS Analysis by Application, 2025 and 2035
  • Figure 37: North America Market Y-o-Y Growth Comparison by Application, 2025 to 2035
  • Figure 38: North America Market Attractiveness Analysis by Application
  • Figure 39: Latin America Market Value Share and BPS Analysis by Country, 2025 and 2035
  • Figure 40: Latin America Market Value Share and BPS Analysis by Source, 2025 and 2035
  • Figure 41: Latin America Market Y-o-Y Growth Comparison by Source, 2025 to 2035
  • Figure 42: Latin America Market Attractiveness Analysis by Source
  • Figure 43: Latin America Market Value Share and BPS Analysis by Product, 2025 and 2035
  • Figure 44: Latin America Market Y-o-Y Growth Comparison by Product, 2025 to 2035
  • Figure 45: Latin America Market Attractiveness Analysis by Product
  • Figure 46: Latin America Market Value Share and BPS Analysis by Form, 2025 and 2035
  • Figure 47: Latin America Market Y-o-Y Growth Comparison by Form, 2025 to 2035
  • Figure 48: Latin America Market Attractiveness Analysis by Form
  • Figure 49: Latin America Market Value Share and BPS Analysis by Application, 2025 and 2035
  • Figure 50: Latin America Market Y-o-Y Growth Comparison by Application, 2025 to 2035
  • Figure 51: Latin America Market Attractiveness Analysis by Application
  • Figure 52: Western Europe Market Value Share and BPS Analysis by Country, 2025 and 2035
  • Figure 53: Western Europe Market Value Share and BPS Analysis by Source, 2025 and 2035
  • Figure 54: Western Europe Market Y-o-Y Growth Comparison by Source, 2025 to 2035
  • Figure 55: Western Europe Market Attractiveness Analysis by Source
  • Figure 56: Western Europe Market Value Share and BPS Analysis by Product, 2025 and 2035
  • Figure 57: Western Europe Market Y-o-Y Growth Comparison by Product, 2025 to 2035
  • Figure 58: Western Europe Market Attractiveness Analysis by Product
  • Figure 59: Western Europe Market Value Share and BPS Analysis by Form, 2025 and 2035
  • Figure 60: Western Europe Market Y-o-Y Growth Comparison by Form, 2025 to 2035
  • Figure 61: Western Europe Market Attractiveness Analysis by Form
  • Figure 62: Western Europe Market Value Share and BPS Analysis by Application, 2025 and 2035
  • Figure 63: Western Europe Market Y-o-Y Growth Comparison by Application, 2025 to 2035
  • Figure 64: Western Europe Market Attractiveness Analysis by Application
  • Figure 65: East Asia Market Value Share and BPS Analysis by Country, 2025 and 2035
  • Figure 66: East Asia Market Value Share and BPS Analysis by Source, 2025 and 2035
  • Figure 67: East Asia Market Y-o-Y Growth Comparison by Source, 2025 to 2035
  • Figure 68: East Asia Market Attractiveness Analysis by Source
  • Figure 69: East Asia Market Value Share and BPS Analysis by Product, 2025 and 2035
  • Figure 70: East Asia Market Y-o-Y Growth Comparison by Product, 2025 to 2035
  • Figure 71: East Asia Market Attractiveness Analysis by Product
  • Figure 72: East Asia Market Value Share and BPS Analysis by Form, 2025 and 2035
  • Figure 73: East Asia Market Y-o-Y Growth Comparison by Form, 2025 to 2035
  • Figure 74: East Asia Market Attractiveness Analysis by Form
  • Figure 75: East Asia Market Value Share and BPS Analysis by Application, 2025 and 2035
  • Figure 76: East Asia Market Y-o-Y Growth Comparison by Application, 2025 to 2035
  • Figure 77: East Asia Market Attractiveness Analysis by Application
  • Figure 78: South Asia Pacific Market Value Share and BPS Analysis by Country, 2025 and 2035
  • Figure 79: South Asia Pacific Market Value Share and BPS Analysis by Source, 2025 and 2035
  • Figure 80: South Asia Pacific Market Y-o-Y Growth Comparison by Source, 2025 to 2035
  • Figure 81: South Asia Pacific Market Attractiveness Analysis by Source
  • Figure 82: South Asia Pacific Market Value Share and BPS Analysis by Product, 2025 and 2035
  • Figure 83: South Asia Pacific Market Y-o-Y Growth Comparison by Product, 2025 to 2035
  • Figure 84: South Asia Pacific Market Attractiveness Analysis by Product
  • Figure 85: South Asia Pacific Market Value Share and BPS Analysis by Form, 2025 and 2035
  • Figure 86: South Asia Pacific Market Y-o-Y Growth Comparison by Form, 2025 to 2035
  • Figure 87: South Asia Pacific Market Attractiveness Analysis by Form
  • Figure 88: South Asia Pacific Market Value Share and BPS Analysis by Application, 2025 and 2035
  • Figure 89: South Asia Pacific Market Y-o-Y Growth Comparison by Application, 2025 to 2035
  • Figure 90: South Asia Pacific Market Attractiveness Analysis by Application
  • Figure 91: Eastern Europe Market Value Share and BPS Analysis by Country, 2025 and 2035
  • Figure 92: Eastern Europe Market Value Share and BPS Analysis by Source, 2025 and 2035
  • Figure 93: Eastern Europe Market Y-o-Y Growth Comparison by Source, 2025 to 2035
  • Figure 94: Eastern Europe Market Attractiveness Analysis by Source
  • Figure 95: Eastern Europe Market Value Share and BPS Analysis by Product, 2025 and 2035
  • Figure 96: Eastern Europe Market Y-o-Y Growth Comparison by Product, 2025 to 2035
  • Figure 97: Eastern Europe Market Attractiveness Analysis by Product
  • Figure 98: Eastern Europe Market Value Share and BPS Analysis by Form, 2025 and 2035
  • Figure 99: Eastern Europe Market Y-o-Y Growth Comparison by Form, 2025 to 2035
  • Figure 100: Eastern Europe Market Attractiveness Analysis by Form
  • Figure 101: Eastern Europe Market Value Share and BPS Analysis by Application, 2025 and 2035
  • Figure 102: Eastern Europe Market Y-o-Y Growth Comparison by Application, 2025 to 2035
  • Figure 103: Eastern Europe Market Attractiveness Analysis by Application
  • Figure 104: Middle East & Africa Market Value Share and BPS Analysis by Country, 2025 and 2035
  • Figure 105: Middle East & Africa Market Value Share and BPS Analysis by Source, 2025 and 2035
  • Figure 106: Middle East & Africa Market Y-o-Y Growth Comparison by Source, 2025 to 2035
  • Figure 107: Middle East & Africa Market Attractiveness Analysis by Source
  • Figure 108: Middle East & Africa Market Value Share and BPS Analysis by Product, 2025 and 2035
  • Figure 109: Middle East & Africa Market Y-o-Y Growth Comparison by Product, 2025 to 2035
  • Figure 110: Middle East & Africa Market Attractiveness Analysis by Product
  • Figure 111: Middle East & Africa Market Value Share and BPS Analysis by Form, 2025 and 2035
  • Figure 112: Middle East & Africa Market Y-o-Y Growth Comparison by Form, 2025 to 2035
  • Figure 113: Middle East & Africa Market Attractiveness Analysis by Form
  • Figure 114: Middle East & Africa Market Value Share and BPS Analysis by Application, 2025 and 2035
  • Figure 115: Middle East & Africa Market Y-o-Y Growth Comparison by Application, 2025 to 2035
  • Figure 116: Middle East & Africa Market Attractiveness Analysis by Application
  • Figure 117: Global Market - Tier Structure Analysis
  • Figure 118: Global Market - Company Share Analysis

- FAQs -

What is the Global Emollient Esters Market Size in 2025?

The emollient esters market is valued at USD 361.4 million in 2025.

Who are the Major Players Operating in the Emollient Esters Market?

Prominent players in the emollient esters market include BASF SE, RITA Corporation, Ashland Inc., ABITEC Corporation, Phoenix Chemical, Inc., Solvay SA, Croda International Plc, and others.

What is the Estimated Valuation of the Emollient Esters Market by 2035?

The emollient esters market is expected to reach a valuation of USD 724.3 million by 2035.

What Value CAGR Did the Emollient Esters Market Exhibit over the Last Five Years?

The historic growth rate of the emollient esters market was 6.8% from 2020 to 2024.

- Also of Interest -

Oleate Esters Market

Oleate Esters Market Analysis, By Type (Ethyl Oleate, Methyl Oleate, Butyl Oleate, Trimethylolpropane Trioleate), By Application (Lubricants, Plasticizers, Agrochemicals, Cosmetics), and Region - Market Insights 2024 to 2034

Sucrose Esters Market

Sucrose Esters Market Share & Trends Analysis, By Form (Liquid, Powder, Pellets), By Application (Cosmetics, Food, Fruits & Beverage, Textiles, Detergents and Cleaners), By Hydrophile-Lipophile Balance (HLB) values, By Fatty Acids & By Region Forecast - Global Market Insights 2019 to 2029

Cosmetic Esters Market

Cosmetic Esters Market Analysis, By Source (Natural Esters, Synthetic Esters), By Application (Skincare Products, Haircare Products, Oral Care, Cosmetic Products), and Region - Market Insights 2024 to 2034

Polyglycerol Esters Market

Polyglycerol Esters Market Analysis, By Color (Light Yellow, Amber, Light Tan, and Brown), By Functionality (Emulsifying Agent, Dispersing Agent, Stabilizing Agent, and Lubricant), By Formulation (Solid, Liquid, and Powdered), and Region – Market Insights 2024 to 2034

Emollient Esters Market

Schedule a Call