Automated Guided Vehicle Market

Automated Guided Vehicle Market Analysis, By Vehicle Type, By Navigation Technology, By Battery, By Application, By End-User and Region - Market Insights 2025 to 2035

Analysis of Automated Guided Vehicle Market Covering 30+ Countries Including Analysis of US, Canada, UK, Germany, France, Nordics, GCC countries, Japan, Korea and many more

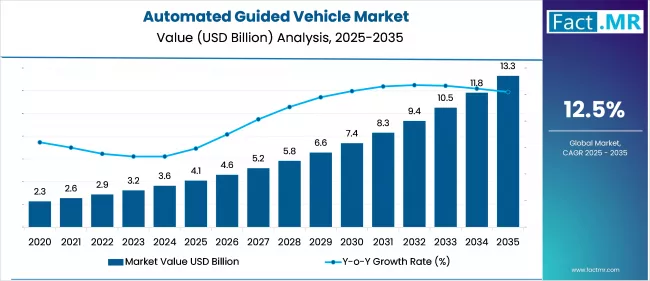
Automated Guided Vehicle Market Outlook (2025 to 2035)

The global automated guided vehicle market is projected to increase from USD 4.1 billion in 2025 to USD 13.3 billion by 2035, with a CAGR of 12.5% during the forecast period. Growth is driven by the increasing need for automation in logistics and manufacturing, as businesses seek to enhance efficiency, reduce labor costs, and streamline operations. Their precision, reliability, and ability to operate 24/7 make AGVs ideal for warehouses, distribution centers, and manufacturing floors.

Automated Guided Vehicle Market Value Analysis 2025 To 2035

Metric Value
Industry Size (2025E) USD 4.1 billion
Industry Size (2035F) USD 13.3 billion
CAGR (2025 to 2035) 12.5%

What are the Drivers of Automated Guided Vehicle Market?

The growth of the automated guided vehicle market is driven by the rapid expansion of e-commerce and the increasing demand for efficient and scalable logistics. In e-commerce warehouses and retail distribution hubs, AGVs streamline material handling, order fulfillment, and packaging operations. E-commerce involves buying and selling goods and services online. E-commerce is growing due to shifting consumer preferences, increased convenience, and personalized offerings. In e-commerce warehouses and retail hubs, automated guided vehicles simplify material handling, packaging, and supply chain management.

Automation solutions utilize technology and software to automate activities, eliminating the need for human intervention, thereby improving efficiency, productivity, and operations across various industries. Automation solutions in AGVs follow Industry 4.0, where smart technology and connectivity automate production and logistics. In October 2023, Cavintek Inc., a U.S.-based productivity applications and workflow automation company, found that over 80% of corporate executives were increasing productivity automation and using remote workers.

Government initiatives promoting Industry 4.0 and smart factories are driving the adoption of AGVs, especially in countries that are heavily investing in manufacturing modernization.

What are the Regional Trends of Automated Guided Vehicle Market?

The North American market is experiencing growth driven by advanced technology and widespread automation. Automation technology is heavily invested in the region, with applications in the automotive, e-commerce, and manufacturing sectors. Logistics maturity and innovations in automated guided vehicle technology support regional market growth.

Sales of automated guided vehicles are increasing in Europe due to the growing adoption of automation in the manufacturing and logistics sectors. Stringent regulations promoting efficiency and environmental sustainability support the region's growth. Due to technological advances and the advent of Industry 4.0, Germany and the U.K. are leading the adoption of AGVs in the automotive and industrial sectors.

The Asia Pacific region is experiencing significant growth in the e-commerce sector, particularly in China and India, where online shopping has emerged as the dominant retail channel. AGVs are increasingly being utilized in warehouses and fulfillment centers to efficiently handle large volumes of orders while optimizing inventory management and order processing.

Middle East & Africa (MEA) countries, such as the UAE and Saudi Arabia, are developing infrastructure and logistics hubs, driving the automated guided vehicle market growth.

What are the Challenges and Restraining Factors of Automated Guided Vehicle Market?

The high upfront cost of automated guided vehicle (AGV) systems is a significant barrier to market expansion, particularly for small and medium-sized businesses. The initial costs include not only the vehicles, but also the supporting infrastructure, software integration, and employee training. For instance, depending on load capacity and sophistication, a single AGV unit can cost between USD 20,000 and $100,000, indicating a significant capital investment.

Most AGVs are programmed to follow predetermined paths and routines, which limits their adaptability in rapidly changing environments, such as modern warehouses or manufacturing plants. This rigidity necessitates costly reprogramming or upgrades whenever the layout or workflow changes.

Integration with legacy systems is frequently complicated and expensive. Facilities with out-of-date warehouse management or enterprise resource planning systems may experience compatibility issues, requiring more time and money to overhaul the system or deploy middleware.

Safety concerns, while less frequent with newer models, remain a barrier. Malfunctions and sensor failures can result in accidents or operational disruptions. To meet stringent safety standards such as ISO 3691-4, businesses must conduct extensive testing and routine maintenance, which increases operating costs.

Country-Wise Outlook

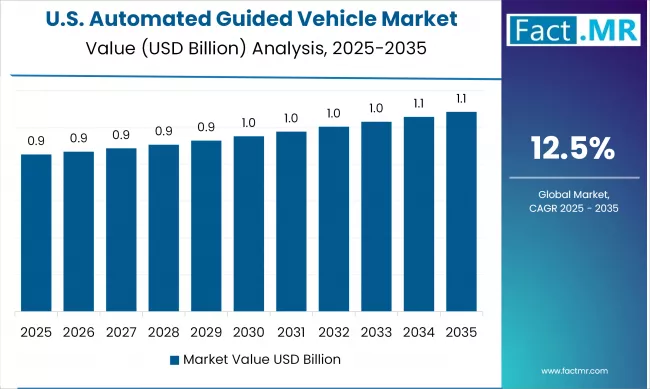
The U.S. Drives AGV Market Growth with Industry 4.0 Adoption

Automated Guided Vehicle Market Country Wise Analysis Of CAGR

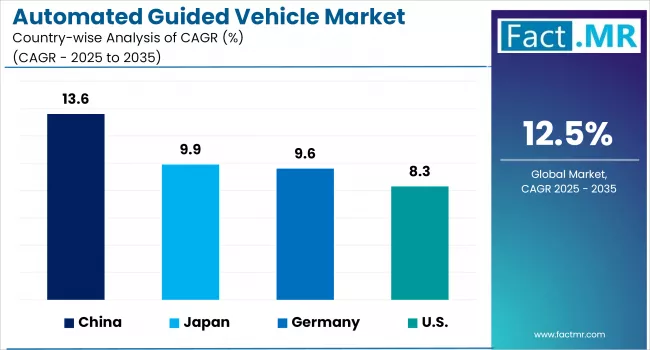
The U.S. is a prominent player in the automated guided vehicle (AGV) market, owing to its advanced manufacturing infrastructure, robust e-commerce ecosystem, and strong emphasis on automation and Industry 4.0 integration. AGV adoption is rapidly increasing in industries such as automotive, retail, healthcare, and food and beverage, as businesses seek to increase productivity and reduce labor dependency.

The U.S. Bureau of Labor Statistics estimates that job openings in the transportation and warehousing sector will exceed 500,000 by 2023. AGVs provide a solution by automating repetitive material handling tasks and maintaining a consistent workflow in high-demand fulfillment centers.

US Automated Guided Vehicle Market

The Occupational Safety and Health Administration (OSHA) requires strict adherence to workplace safety, and AGVs help reduce worker exposure to high-risk areas, aligning with compliance objectives. The American National Standards Institute (ANSI) and the Industrial Truck Standards Development Foundation (ITSDF) provide safety guidelines for AGV design and deployment, thereby enhancing market confidence.

Germany witnesses Rapid Market Growth Backed by Strong Automotive and Manufacturing Sector

The country has a strong automotive and manufacturing sector. As companies such as BMW, Volkswagen, and Siemens automate their intralogistics, the demand for precision-guided, autonomous transportation systems grows. According to the German Engineering Federation (VDMA), by 2023, more than 65% of Germany's large industrial facilities are expected to have implemented automated material handling systems.

Germany is also experiencing a skilled labor shortage, particularly in logistics and warehousing. AGVs are viewed as a strategic solution for sustaining productivity levels. According to a 2022 survey by the German Chamber of Commerce and Industry (DIHK), 57% of logistics companies reported difficulty finding qualified employees, accelerating the push toward automation.

Strict workplace safety regulations, enforced by the German Statutory Accident Insurance (DGUV), promote the use of AGVs to reduce human exposure to hazardous environments. Furthermore, TÜV certification standards for industrial vehicles encourage the safe deployment of AGVs in factories and warehouses.

Germany's emphasis on sustainable production is also consistent with the growth of the AGV market. Electric AGVs help to reduce emissions and noise levels, aligning with national environmental goals. Many German logistics companies are incorporating AGVs powered by lithium-ion batteries and solar-assisted charging systems.

Japan Fuels AGV Market Growth Through Robotics and Ageing Workforce Solutions

Japan is a key player in the automated guided vehicle (AGV) market, owing to its advanced robotics industry, ageing workforce, and emphasis on precision manufacturing. As a global leader in industrial automation, Japan has long adopted AGV technologies in various sectors, including automotive, electronics, and pharmaceuticals.

Toyota, Honda, and Nissan have aggressively implemented AGVs in their production lines to improve just-in-time manufacturing. Toyota Industries Corporation, for example, will expand its AGV offerings in 2023 by integrating AI-powered fleet management and real-time path adjustment systems.

The Japanese government's Society 5.0 initiative promotes the integration of robotics and artificial intelligence (AI) into industrial infrastructure, thereby increasing AGV deployment. Government funding for smart factory technologies through programs run by the Ministry of Economy, Trade, and Industry (METI) has enabled SMEs to modernize their logistics with AGV solutions.

In terms of regulations, Japan's Industrial Safety and Health Act promotes the use of automation in hazardous work environments, which helps drive the adoption of AGVs. The Japanese Industrial Standards Committee (JISC) oversees industrial safety standards, ensuring that AGVs meet stringent performance and safety benchmarks.

Category-wise Analysis

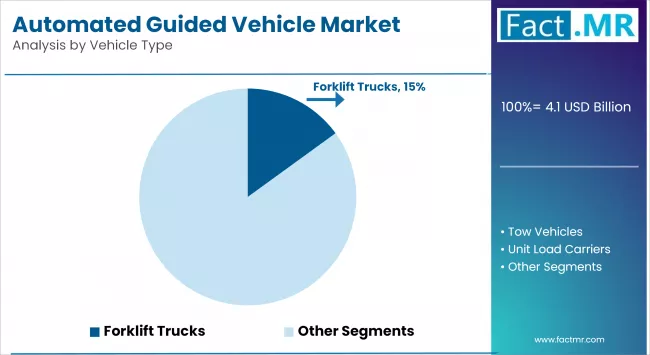
Forklift Trucks to Exhibit Leading by Vehicle Type

A forklift is one of the most common automated guided vehicles because it performs the necessary stacking and unstacking operations. It is occasionally used for short-distance transportation in a manufacturing environment. It was one of the first modified AGVs, and it is in high demand in today's market. Forklifts are the most popular type of AGV because they can perform a variety of material handling tasks such as loading, unloading, transporting, and stacking. These are useful in almost all manufacturing plants, hence they are in high demand across all industries.

Automated Guided Vehicle Market Analysis By Vehicle Type

Tow trucks are the most productive autonomous guided vehicles for towing and pulling because they can transport more loads with multiple trailers than forklifts. Loading can be performed either automatically or manually within the vehicle. The navigation system utilizes sensors and algorithms to detect and avoid obstacles autonomously. This vehicle's economical design enables it to operate at a set speed while meeting safety standards and production goals, thereby indirectly contributing to the growth of the global automated guided vehicle market and increased demand.

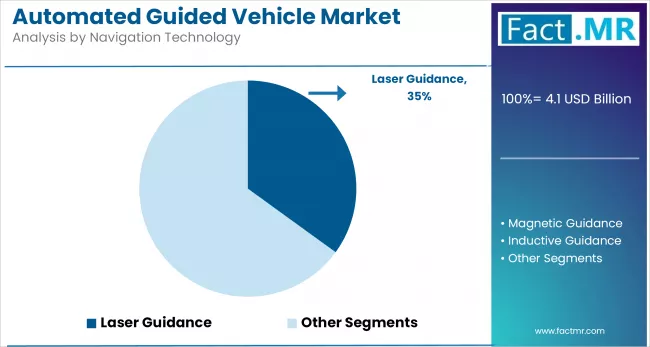
Laser Guided to Exhibit led by Navigation Technology

Industrial demand for accurate and reliable navigation solutions is driving growth in the laser guidance segment, as it enhances both operational efficiency and workplace safety. The performance of AGVs in complex industrial environments relies on the accurate, reliable, and adaptable navigation solutions provided by laser guidance technology. Laser scans enable laser-guided AGVs to follow predefined paths and navigate around obstacles with precision. For complex manoeuvring and consistent performance, large warehouses, manufacturing facilities, and distribution centers need this accuracy.

Automated Guided Vehicle Market Analysis By Navigation Technology

Vision-guided AGVs leverage cameras and sensors to navigate and make real-time decisions in complex or unstructured environments. With the rising adoption of advanced automation, this segment is experiencing steady growth. Other cars, including wire-guided AGVs, use physical wires or other navigation methods to meet niche market needs. As industries utilize advanced navigation technologies to enhance efficiency and flexibility, the market is expanding.

Lead to Exhibit Leading by Battery

Lead batteries are used in AGVs due to their affordability, reliability, and compatibility with existing infrastructure. These batteries are suitable for AGVs in initial cost-sensitive applications. Lead-acid batteries are favored in low-duty-cycle or predictable usage settings due to their affordability and recyclability, despite their heavier weight and slower charging times. Small to mid-sized businesses often choose them for their low upfront costs and ease of maintenance.

Lithium-ion batteries' higher energy density, faster charging, and longer lifecycle are making them popular in AGVs. High-efficiency environments, such as e-commerce, automotive, and manufacturing warehouses, require AGVs to operate for extended periods with minimal downtime. Although lithium-ion batteries are more expensive than lead-acid batteries, they offer savings in maintenance and energy costs. Opportunity charging adaptability ensures continuous workflow in demanding industrial settings.

Transportation to Exhibit Leading by Application

The transportation segment holds a significant market share, as AGVs optimize the movement of goods within warehouses and distribution centers. Their efficiency in managing large volumes of materials and seamless integration with modern supply chains make them a preferred choice for widespread adoption. Storage and assembly AGVs optimize warehouse storage and assembly line operations and boost productivity and organization. This segment is growing steadily as industries seek improvements in warehouse management and assembly efficiency.

Packaging AGVs help to automate the packaging process, which is becoming increasingly important for ensuring consistency and speed in production lines. The demand for efficient and dependable packaging solutions is driving the segment's growth. Overall, the automated guided vehicle market is growing as companies seek to use automation to improve efficiency in transportation, storage, and packaging applications.

Manufacturing to Exhibit Leading by End-User

Manufacturing led the automated guided vehicle market due to rising demand for automated solutions that streamline production workflows and reduce manual labor. The timely and accurate delivery of materials, components, and finished products between manufacturing stages is automated by AGVs. This reduces bottlenecks, downtime, and boosts production efficiency, enabling companies to meet market demands and stay competitive. Integrating AGVs with Industry 4.0 technologies, such as IoT and real-time data analytics, enables manufacturers to monitor and improve their operational performance.

Aerospace is expected to be the most opportunistic segment during the forecast period. The complexity of components such as wings, engine pods, and nacelles necessitates large aerospace manufacturing facilities. Automated guided vehicles make it easier to transport aerospace components without accidents or mishaps.

Competitive Analysis

The global automated guided vehicle (AGV) market is becoming increasingly competitive, with a mix of established automation providers, robotics startups, and system integrators serving diverse industries, including automotive, food and beverage, pharmaceuticals, and e-commerce. This competitive landscape is largely driven by innovation in navigation technologies, battery efficiency, fleet management software, and AI integration. Companies are focusing on enhancing AGV performance in complex environments, offering modular solutions, and developing scalable systems to meet the growing demand for smart, flexible, and labor-efficient material handling solutions.

Technological advancements are transforming the AGV landscape. Integration with Industry 4.0 technologies, including AI, machine learning, and IoT, has enabled AGVs to become more autonomous, intelligent, and adaptable. Modern AGVs can navigate in real-time with sensors, cameras, and LiDAR systems, allowing them to operate safely in dynamic environments. This has shifted their use cases from traditional repetitive material handling to more complex, collaborative operations.

 These businesses are investing in product development, partnerships, and acquisitions to gain a competitive advantage. Smaller companies are also entering the market with niche products, particularly custom-built AGVs and AI-powered control systems.

Key players in the automated guided vehicle industry include Addverb Technologies, Aichi Machine Industry Co., Ltd., China SME Group Co., Ltd., DAIFUKU GROUP, Egemin Automation Inc., GreyOrange, GRIDBOTS, JBT Corporation, KOLEC, Konecranes, KUKA AG, Murata Machinery, Ltd., Oceaneering International, Inc., SHENZHEN MIRCOLOMAY TECHNOLOGY CO., LTD., System Logistics S.p.A., TOYOTA INDUSTRIES CORPORATION, and others.

Recent Development

  • In April 2024, HMS Networks significantly improved the efficiency of Mercedes-Benz's Automated Guided Vehicle (AGV) system at its Ludwigsfelde auto plant. The upgrade entailed installing an advanced wireless system to support expanded AGV operations, increase efficiency, and ensure compliance with the EU Machinery Regulation 2023/1230.
  • In April 2024, Siemens Nederland and VDL Automated Vehicles strengthened their partnership to launch the second generation of their automated logistics platform, which is based on automated guided vehicles (AGVs). This collaboration builds upon their previous work on AGVs, with the new generation offering enhanced capabilities and features.

Segmentation of the Automated Guided Vehicle Market

  • By Vehicle Type :

    • Tow Vehicles
    • Unit Load Carriers
    • Pallet Trucks
    • Assembly Line Vehicles
    • Forklift Trucks
    • Other Types
  • By Navigation Technology :

    • Laser Guidance
    • Magnetic Guidance
    • Inductive Guidance
    • Optical Tape Guidance
    • Vision Guidance
    • Others

  • By Battery :

    • Lead Battery
    • Lithium-Ion Battery
    • Nickel-based Battery
    • Others
  • By Application :

    • Transportation
    • Storage
    • Distribution
    • Assembly
    • Packaging
    • Waste Handling
  • By End-User :

    • Automotive
    • Manufacturing
    • Food & Beverages
    • Aerospace
    • Healthcare
    • Logistics
    • Retail
  • By Region :

    • North America
    • Latin America
    • Western Europe
    • Eastern Europe
    • East Asia
    • South Asia & Pacific
    • Middle East & Africa

Table of Content

  1. Executive Summary
    • Global Market Outlook
    • Demand-side Trends
    • Supply-side Trends
    • Technology Roadmap Analysis
    • Analysis and Recommendations
  2. Market Overview
    • Market Coverage / Taxonomy
    • Market Definition / Scope / Limitations
  3. Market Background
    • Market Dynamics
      • Drivers
      • Restraints
      • Opportunity
      • Trends
    • Scenario Forecast
      • Demand in Optimistic Scenario
      • Demand in Likely Scenario
      • Demand in Conservative Scenario
    • Opportunity Map Analysis
    • Product Life Cycle Analysis
    • Supply Chain Analysis
      • Supply Side Participants and their Roles
        • Producers
        • Mid-Level Participants (Traders/ Agents/ Brokers)
        • Wholesalers and Distributors
      • Value Added and Value Created at Node in the Supply Chain
      • List of Component Suppliers
      • List of Existing and Potential Buyers
    • Investment Feasibility Matrix
    • Value Chain Analysis
      • Profit Margin Analysis
      • Wholesalers and Distributors
      • Retailers
    • PESTLE and Porter’s Analysis
    • Regulatory Landscape
      • By Key Regions
      • By Key Countries
    • Production and Consumption Statistics
    • Import and Export Statistics
  4. Global Market Analysis 2020 to 2024 and Forecast, 2025 to 2035
    • Historical Market Size Value (USD Bn) & Volume (Units) Analysis, 2020 to 2024
    • Current and Future Market Size Value (USD Bn) & Volume (Units) Projections, 2025 to 2035
      • Y-o-Y Growth Trend Analysis
      • Absolute $ Opportunity Analysis
  5. Global Market Pricing Analysis 2020 to 2024 and Forecast 2025 to 2035
  6. Global Market Analysis 2020 to 2024 and Forecast 2025 to 2035, By Vehicle Type
    • Introduction / Key Findings
    • Historical Market Size Value (USD Bn) & Volume (Units) Analysis By Vehicle Type, 2020 to 2024
    • Current and Future Market Size Value (USD Bn) & Volume (Units) Analysis and Forecast By Vehicle Type, 2025 to 2035
      • Tow Vehicles
      • Value (USD Bn) & Volume (Units) Load Carriers
      • Pallet Trucks
      • Assembly Line Vehicles
      • Forklift Trucks
      • Other Types
    • Y-o-Y Growth Trend Analysis By Vehicle Type, 2020 to 2024
    • Absolute $ Opportunity Analysis By Vehicle Type, 2025 to 2035
  7. Global Market Analysis 2020 to 2024 and Forecast 2025 to 2035, By Navigation Technology
    • Introduction / Key Findings
    • Historical Market Size Value (USD Bn) & Volume (Units) Analysis By Navigation Technology, 2020 to 2024
    • Current and Future Market Size Value (USD Bn) & Volume (Units) Analysis and Forecast By Navigation Technology, 2025 to 2035
      • Laser Guidance
      • Magnetic Guidance
      • Inductive Guidance
      • Optical Tape Guidance
      • Vision Guidance
      • Others
    • Y-o-Y Growth Trend Analysis By Navigation Technology, 2020 to 2024
    • Absolute $ Opportunity Analysis By Navigation Technology, 2025 to 2035
  8. Global Market Analysis 2020 to 2024 and Forecast 2025 to 2035, By Battery
    • Introduction / Key Findings
    • Historical Market Size Value (USD Bn) & Volume (Units) Analysis By Battery, 2020 to 2024
    • Current and Future Market Size Value (USD Bn) & Volume (Units) Analysis and Forecast By Battery, 2025 to 2035
      • Lead Battery
      • Lithium-Ion Battery
      • Nickel-based Battery
      • Others
    • Y-o-Y Growth Trend Analysis By Battery, 2020 to 2024
    • Absolute $ Opportunity Analysis By Battery, 2025 to 2035
  9. Global Market Analysis 2020 to 2024 and Forecast 2025 to 2035, By Application
    • Introduction / Key Findings
    • Historical Market Size Value (USD Bn) & Volume (Units) Analysis By Application, 2020 to 2024
    • Current and Future Market Size Value (USD Bn) & Volume (Units) Analysis and Forecast By Application, 2025 to 2035
      • Transportation
      • Storage
      • Distribution
      • Assembly
      • Packaging
      • Waste Handling
    • Y-o-Y Growth Trend Analysis By Application, 2020 to 2024
    • Absolute $ Opportunity Analysis By Application, 2025 to 2035
  10. Global Market Analysis 2020 to 2024 and Forecast 2025 to 2035, By End-User
    • Introduction / Key Findings
    • Historical Market Size Value (USD Bn) & Volume (Units) Analysis By End-User, 2020 to 2024
    • Current and Future Market Size Value (USD Bn) & Volume (Units) Analysis and Forecast By End-User, 2025 to 2035
      • Automotive
      • Manufacturing
      • Food & Beverages
      • Aerospace
      • Healthcare
      • Logistics
      • Retail
    • Y-o-Y Growth Trend Analysis By End-User, 2020 to 2024
    • Absolute $ Opportunity Analysis By End-User, 2025 to 2035
  11. Global Market Analysis 2020 to 2024 and Forecast 2025 to 2035, By Region
    • Introduction
    • Historical Market Size Value (USD Bn) & Volume (Units) Analysis By Region, 2020 to 2024
    • Current Market Size Value (USD Bn) & Volume (Units) Analysis and Forecast By Region, 2025 to 2035
      • North America
      • Latin America
      • Western Europe
      • East Asia
      • South Asia Pacific
      • Eastern Europe
      • Middle East & Africa
    • Market Attractiveness Analysis By Region
  12. North America Market Analysis 2020 to 2024 and Forecast 2025 to 2035, By Country
    • Historical Market Size Value (USD Bn) & Volume (Units) Trend Analysis By Market Taxonomy, 2020 to 2024
    • Market Size Value (USD Bn) & Volume (Units) Forecast By Market Taxonomy, 2025 to 2035
      • By Country
        • U.S.
        • Canada
        • Mexico
      • By Vehicle Type
      • By Navigation Technology
      • By Battery
      • By Application
      • By End-User
    • Market Attractiveness Analysis
      • By Country
      • By Vehicle Type
      • By Navigation Technology
      • By Battery
      • By Application
      • By End-User
    • Key Takeaways
  13. Latin America Market Analysis 2020 to 2024 and Forecast 2025 to 2035, By Country
    • Historical Market Size Value (USD Bn) & Volume (Units) Trend Analysis By Market Taxonomy, 2020 to 2024
    • Market Size Value (USD Bn) & Volume (Units) Forecast By Market Taxonomy, 2025 to 2035
      • By Country
        • Brazil
        • Chile
        • Rest of Latin America
      • By Vehicle Type
      • By Navigation Technology
      • By Battery
      • By Application
      • By End-User
    • Market Attractiveness Analysis
      • By Country
      • By Vehicle Type
      • By Navigation Technology
      • By Battery
      • By Application
      • By End-User
    • Key Takeaways
  14. Western Europe Market Analysis 2020 to 2024 and Forecast 2025 to 2035, By Country
    • Historical Market Size Value (USD Bn) & Volume (Units) Trend Analysis By Market Taxonomy, 2020 to 2024
    • Market Size Value (USD Bn) & Volume (Units) Forecast By Market Taxonomy, 2025 to 2035
      • By Country
        • Germany
        • Italy
        • France
        • U.K.
        • Spain
        • Russia
        • BENELUX
        • Rest of Europe
      • By Vehicle Type
      • By Navigation Technology
      • By Battery
      • By Application
      • By End-User
    • Market Attractiveness Analysis
      • By Country
      • By Vehicle Type
      • By Navigation Technology
      • By Battery
      • By Application
      • By End-User
    • Key Takeaways
  15. East Asia Market Analysis 2020 to 2024 and Forecast 2025 to 2035, By Country
    • Historical Market Size Value (USD Bn) & Volume (Units) Trend Analysis By Market Taxonomy, 2020 to 2024
    • Market Size Value (USD Bn) & Volume (Units) Forecast By Market Taxonomy, 2025 to 2035
      • By Country
        • China
        • Japan
        • South Korea
      • By Vehicle Type
      • By Navigation Technology
      • By Battery
      • By Application
      • By End-User
    • Market Attractiveness Analysis
      • By Country
      • By Vehicle Type
      • By Navigation Technology
      • By Battery
      • By Application
      • By End-User
    • Key Takeaways
  16. South Asia Pacific Market Analysis 2020 to 2024 and Forecast 2025 to 2035, By Country
    • Historical Market Size Value (USD Bn) & Volume (Units) Trend Analysis By Market Taxonomy, 2020 to 2024
    • Market Size Value (USD Bn) & Volume (Units) Forecast By Market Taxonomy, 2025 to 2035
      • By Country
        • India
        • ASEAN Countries
        • Australia & New Zealand
        • Rest of South Asia Pacific
      • By Vehicle Type
      • By Navigation Technology
      • By Battery
      • By Application
      • By End-User
    • Market Attractiveness Analysis
      • By Country
      • By Vehicle Type
      • By Navigation Technology
      • By Battery
      • By Application
      • By End-User
    • Key Takeaways
  17. Eastern Europe Market Analysis 2020 to 2024 and Forecast 2025 to 2035, By Country
    • Historical Market Size Value (USD Bn) & Volume (Units) Trend Analysis By Market Taxonomy, 2020 to 2024
    • Market Size Value (USD Bn) & Volume (Units) Forecast By Market Taxonomy, 2025 to 2035
      • By Country
        • Russia
        • Poland
        • Hungary
        • Balkan & Baltics
        • Rest of Eastern Europe
      • By Vehicle Type
      • By Navigation Technology
      • By Battery
      • By Application
      • By End-User
    • Market Attractiveness Analysis
      • By Country
      • By Vehicle Type
      • By Navigation Technology
      • By Battery
      • By Application
      • By End-User
    • Key Takeaways
  18. Middle East & Africa Market Analysis 2020 to 2024 and Forecast 2025 to 2035, By Country
    • Historical Market Size Value (USD Bn) & Volume (Units) Trend Analysis By Market Taxonomy, 2020 to 2024
    • Market Size Value (USD Bn) & Volume (Units) Forecast By Market Taxonomy, 2025 to 2035
      • By Country
        • KSA
        • Other GCC Countries
        • Turkiye
        • South Africa
        • Rest of MEA
      • By Vehicle Type
      • By Navigation Technology
      • By Battery
      • By Application
      • By End-User
    • Market Attractiveness Analysis
      • By Country
      • By Vehicle Type
      • By Navigation Technology
      • By Battery
      • By Application
      • By End-User
    • Key Takeaways
  19. Key Countries Market Analysis
    • China
      • Pricing Analysis
      • Market Share Analysis, 2024
        • By Vehicle Type
        • By Navigation Technology
        • By Battery
        • By Application
        • By End-User
    • Germany
      • Pricing Analysis
      • Market Share Analysis, 2024
        • By Vehicle Type
        • By Navigation Technology
        • By Battery
        • By Application
        • By End-User
    • Value (USD Bn) & Volume (Units)ed States
      • Pricing Analysis
      • Market Share Analysis, 2024
        • By Vehicle Type
        • By Navigation Technology
        • By Battery
        • By Application
        • By End-User
    • Japan
      • Pricing Analysis
      • Market Share Analysis, 2024
        • By Vehicle Type
        • By Navigation Technology
        • By Battery
        • By Application
        • By End-User
    • South Korea
      • Pricing Analysis
      • Market Share Analysis, 2024
        • By Vehicle Type
        • By Navigation Technology
        • By Battery
        • By Application
        • By End-User
  20. Market Structure Analysis
    • Competition Dashboard
    • Competition Benchmarking
    • Market Share Analysis of Top Players
      • By Regional
      • By Vehicle Type
      • By Navigation Technology
      • By Battery
      • By Application
      • By End-User
  21. Competition Analysis
    • Competition Deep Dive
      • Addverb Technologies
        • Overview
        • Product Portfolio
        • Profitability by Market Segments (Product/Age /Sales Channel/Region)
        • Sales Footprint
        • Strategy Overview
          • Marketing Strategy
          • Product Strategy
          • Channel Strategy
      • Aichi Machine Industry Co., Ltd.
        • Overview
        • Product Portfolio
        • Profitability by Market Segments (Product/Age /Sales Channel/Region)
        • Sales Footprint
        • Strategy Overview
          • Marketing Strategy
          • Product Strategy
          • Channel Strategy
      • China SME Group Co., Ltd.
        • Overview
        • Product Portfolio
        • Profitability by Market Segments (Product/Age /Sales Channel/Region)
        • Sales Footprint
        • Strategy Overview
          • Marketing Strategy
          • Product Strategy
          • Channel Strategy
      • DAIFUKU GROUP
        • Overview
        • Product Portfolio
        • Profitability by Market Segments (Product/Age /Sales Channel/Region)
        • Sales Footprint
        • Strategy Overview
          • Marketing Strategy
          • Product Strategy
          • Channel Strategy
      • Egemin Automation Inc.
        • Overview
        • Product Portfolio
        • Profitability by Market Segments (Product/Age /Sales Channel/Region)
        • Sales Footprint
        • Strategy Overview
          • Marketing Strategy
          • Product Strategy
          • Channel Strategy
      • GreyOrange
        • Overview
        • Product Portfolio
        • Profitability by Market Segments (Product/Age /Sales Channel/Region)
        • Sales Footprint
        • Strategy Overview
          • Marketing Strategy
          • Product Strategy
          • Channel Strategy
      • GRIDBOTS
        • Overview
        • Product Portfolio
        • Profitability by Market Segments (Product/Age /Sales Channel/Region)
        • Sales Footprint
        • Strategy Overview
          • Marketing Strategy
          • Product Strategy
          • Channel Strategy
      • JBT Corporation
        • Overview
        • Product Portfolio
        • Profitability by Market Segments (Product/Age /Sales Channel/Region)
        • Sales Footprint
        • Strategy Overview
          • Marketing Strategy
          • Product Strategy
          • Channel Strategy
      • KOLEC
        • Overview
        • Product Portfolio
        • Profitability by Market Segments (Product/Age /Sales Channel/Region)
        • Sales Footprint
        • Strategy Overview
          • Marketing Strategy
          • Product Strategy
          • Channel Strategy
      • Konecranes
        • Overview
        • Product Portfolio
        • Profitability by Market Segments (Product/Age /Sales Channel/Region)
        • Sales Footprint
        • Strategy Overview
          • Marketing Strategy
          • Product Strategy
          • Channel Strategy
      • KUKA AG
        • Overview
        • Product Portfolio
        • Profitability by Market Segments (Product/Age /Sales Channel/Region)
        • Sales Footprint
        • Strategy Overview
          • Marketing Strategy
          • Product Strategy
          • Channel Strategy
      • Murata Machinery, Ltd.
        • Overview
        • Product Portfolio
        • Profitability by Market Segments (Product/Age /Sales Channel/Region)
        • Sales Footprint
        • Strategy Overview
          • Marketing Strategy
          • Product Strategy
          • Channel Strategy
      • Oceaneering International, Inc.
        • Overview
        • Product Portfolio
        • Profitability by Market Segments (Product/Age /Sales Channel/Region)
        • Sales Footprint
        • Strategy Overview
          • Marketing Strategy
          • Product Strategy
          • Channel Strategy
      • SHENZHEN MIRCOLOMAY TECHNOLOGY CO., LTD.
        • Overview
        • Product Portfolio
        • Profitability by Market Segments (Product/Age /Sales Channel/Region)
        • Sales Footprint
        • Strategy Overview
          • Marketing Strategy
          • Product Strategy
          • Channel Strategy
      • System Logistics S.p.A.
        • Overview
        • Product Portfolio
        • Profitability by Market Segments (Product/Age /Sales Channel/Region)
        • Sales Footprint
        • Strategy Overview
          • Marketing Strategy
          • Product Strategy
          • Channel Strategy
      • TOYOTA INDUSTRIES CORPORATION
        • Overview
        • Product Portfolio
        • Profitability by Market Segments (Product/Age /Sales Channel/Region)
        • Sales Footprint
        • Strategy Overview
          • Marketing Strategy
          • Product Strategy
          • Channel Strategy
  22. Assumptions & Acronyms Used
  23. Research Methodology
    • Executive Summary
      • Global Market Outlook
      • Demand-side Trends
      • Supply-side Trends
      • Technology Roadmap Analysis
      • Analysis and Recommendations
    • Market Overview
      • Market Coverage / Taxonomy
      • Market Definition / Scope / Limitations
    • Market Background
      • Market Dynamics
        • Drivers
        • Restraints
        • Opportunity
        • Trends
      • Scenario Forecast
        • Demand in Optimistic Scenario
        • Demand in Likely Scenario
        • Demand in Conservative Scenario
      • Opportunity Map Analysis
      • Product Life Cycle Analysis
      • Supply Chain Analysis
        • Supply Side Participants and their Roles
          • Producers
          • Mid-Level Participants (Traders/ Agents/ Brokers)
          • Wholesalers and Distributors
        • Value Added and Value Created at Node in the Supply Chain
        • List of Component Suppliers
        • List of Existing and Potential Buyers
      • Investment Feasibility Matrix
      • Value Chain Analysis
        • Profit Margin Analysis
        • Wholesalers and Distributors
        • Retailers
      • PESTLE and Porter’s Analysis
      • Regulatory Landscape
        • By Key Regions
        • By Key Countries
      • Production and Consumption Statistics
      • Import and Export Statistics
    • Global Market Analysis 2020 to 2024 and Forecast, 2025 to 2035
      • Historical Market Size Value (USD Bn) & Volume (Units) Analysis, 2020 to 2024
      • Current and Future Market Size Value (USD Bn) & Volume (Units) Projections, 2025 to 2035
        • Y-o-Y Growth Trend Analysis
        • Absolute $ Opportunity Analysis
    • Global Market Pricing Analysis 2020 to 2024 and Forecast 2025 to 2035
    • Global Market Analysis 2020 to 2024 and Forecast 2025 to 2035, By Vehicle Type
      • Introduction / Key Findings
      • Historical Market Size Value (USD Bn) & Volume (Units) Analysis By Vehicle Type, 2020 to 2024
      • Current and Future Market Size Value (USD Bn) & Volume (Units) Analysis and Forecast By Vehicle Type, 2025 to 2035
        • Tow Vehicles
        • Value (USD Bn) & Volume (Units) Load Carriers
        • Pallet Trucks
        • Assembly Line Vehicles
        • Forklift Trucks
        • Other Types
      • Y-o-Y Growth Trend Analysis By Vehicle Type, 2020 to 2024
      • Absolute $ Opportunity Analysis By Vehicle Type, 2025 to 2035
    • Global Market Analysis 2020 to 2024 and Forecast 2025 to 2035, By Navigation Technology
      • Introduction / Key Findings
      • Historical Market Size Value (USD Bn) & Volume (Units) Analysis By Navigation Technology, 2020 to 2024
      • Current and Future Market Size Value (USD Bn) & Volume (Units) Analysis and Forecast By Navigation Technology, 2025 to 2035
        • Laser Guidance
        • Magnetic Guidance
        • Inductive Guidance
        • Optical Tape Guidance
        • Vision Guidance
        • Others
      • Y-o-Y Growth Trend Analysis By Navigation Technology, 2020 to 2024
      • Absolute $ Opportunity Analysis By Navigation Technology, 2025 to 2035
    • Global Market Analysis 2020 to 2024 and Forecast 2025 to 2035, By Battery
      • Introduction / Key Findings
      • Historical Market Size Value (USD Bn) & Volume (Units) Analysis By Battery, 2020 to 2024
      • Current and Future Market Size Value (USD Bn) & Volume (Units) Analysis and Forecast By Battery, 2025 to 2035
        • Lead Battery
        • Lithium-Ion Battery
        • Nickel-based Battery
        • Others
      • Y-o-Y Growth Trend Analysis By Battery, 2020 to 2024
      • Absolute $ Opportunity Analysis By Battery, 2025 to 2035
    • Global Market Analysis 2020 to 2024 and Forecast 2025 to 2035, By Application
      • Introduction / Key Findings
      • Historical Market Size Value (USD Bn) & Volume (Units) Analysis By Application, 2020 to 2024
      • Current and Future Market Size Value (USD Bn) & Volume (Units) Analysis and Forecast By Application, 2025 to 2035
        • Transportation
        • Storage
        • Distribution
        • Assembly
        • Packaging
        • Waste Handling
      • Y-o-Y Growth Trend Analysis By Application, 2020 to 2024
      • Absolute $ Opportunity Analysis By Application, 2025 to 2035
    • Global Market Analysis 2020 to 2024 and Forecast 2025 to 2035, By End-User
      • Introduction / Key Findings
      • Historical Market Size Value (USD Bn) & Volume (Units) Analysis By End-User, 2020 to 2024
      • Current and Future Market Size Value (USD Bn) & Volume (Units) Analysis and Forecast By End-User, 2025 to 2035
        • Automotive
        • Manufacturing
        • Food & Beverages
        • Aerospace
        • Healthcare
        • Logistics
        • Retail
      • Y-o-Y Growth Trend Analysis By End-User, 2020 to 2024
      • Absolute $ Opportunity Analysis By End-User, 2025 to 2035
    • Global Market Analysis 2020 to 2024 and Forecast 2025 to 2035, By Region
      • Introduction
      • Historical Market Size Value (USD Bn) & Volume (Units) Analysis By Region, 2020 to 2024
      • Current Market Size Value (USD Bn) & Volume (Units) Analysis and Forecast By Region, 2025 to 2035
        • North America
        • Latin America
        • Western Europe
        • East Asia
        • South Asia Pacific
        • Eastern Europe
        • Middle East & Africa
      • Market Attractiveness Analysis By Region
    • North America Market Analysis 2020 to 2024 and Forecast 2025 to 2035, By Country
      • Historical Market Size Value (USD Bn) & Volume (Units) Trend Analysis By Market Taxonomy, 2020 to 2024
      • Market Size Value (USD Bn) & Volume (Units) Forecast By Market Taxonomy, 2025 to 2035
        • By Country
          • U.S.
          • Canada
          • Mexico
        • By Vehicle Type
        • By Navigation Technology
        • By Battery
        • By Application
        • By End-User
      • Market Attractiveness Analysis
        • By Country
        • By Vehicle Type
        • By Navigation Technology
        • By Battery
        • By Application
        • By End-User
      • Key Takeaways
    • Latin America Market Analysis 2020 to 2024 and Forecast 2025 to 2035, By Country
      • Historical Market Size Value (USD Bn) & Volume (Units) Trend Analysis By Market Taxonomy, 2020 to 2024
      • Market Size Value (USD Bn) & Volume (Units) Forecast By Market Taxonomy, 2025 to 2035
        • By Country
          • Brazil
          • Chile
          • Rest of Latin America
        • By Vehicle Type
        • By Navigation Technology
        • By Battery
        • By Application
        • By End-User
      • Market Attractiveness Analysis
        • By Country
        • By Vehicle Type
        • By Navigation Technology
        • By Battery
        • By Application
        • By End-User
      • Key Takeaways
    • Western Europe Market Analysis 2020 to 2024 and Forecast 2025 to 2035, By Country
      • Historical Market Size Value (USD Bn) & Volume (Units) Trend Analysis By Market Taxonomy, 2020 to 2024
      • Market Size Value (USD Bn) & Volume (Units) Forecast By Market Taxonomy, 2025 to 2035
        • By Country
          • Germany
          • Italy
          • France
          • U.K.
          • Spain
          • Russia
          • BENELUX
          • Rest of Europe
        • By Vehicle Type
        • By Navigation Technology
        • By Battery
        • By Application
        • By End-User
      • Market Attractiveness Analysis
        • By Country
        • By Vehicle Type
        • By Navigation Technology
        • By Battery
        • By Application
        • By End-User
      • Key Takeaways
    • East Asia Market Analysis 2020 to 2024 and Forecast 2025 to 2035, By Country
      • Historical Market Size Value (USD Bn) & Volume (Units) Trend Analysis By Market Taxonomy, 2020 to 2024
      • Market Size Value (USD Bn) & Volume (Units) Forecast By Market Taxonomy, 2025 to 2035
        • By Country
          • China
          • Japan
          • South Korea
        • By Vehicle Type
        • By Navigation Technology
        • By Battery
        • By Application
        • By End-User
      • Market Attractiveness Analysis
        • By Country
        • By Vehicle Type
        • By Navigation Technology
        • By Battery
        • By Application
        • By End-User
      • Key Takeaways
    • South Asia Pacific Market Analysis 2020 to 2024 and Forecast 2025 to 2035, By Country
      • Historical Market Size Value (USD Bn) & Volume (Units) Trend Analysis By Market Taxonomy, 2020 to 2024
      • Market Size Value (USD Bn) & Volume (Units) Forecast By Market Taxonomy, 2025 to 2035
        • By Country
          • India
          • ASEAN Countries
          • Australia & New Zealand
          • Rest of South Asia Pacific
        • By Vehicle Type
        • By Navigation Technology
        • By Battery
        • By Application
        • By End-User
      • Market Attractiveness Analysis
        • By Country
        • By Vehicle Type
        • By Navigation Technology
        • By Battery
        • By Application
        • By End-User
      • Key Takeaways
    • Eastern Europe Market Analysis 2020 to 2024 and Forecast 2025 to 2035, By Country
      • Historical Market Size Value (USD Bn) & Volume (Units) Trend Analysis By Market Taxonomy, 2020 to 2024
      • Market Size Value (USD Bn) & Volume (Units) Forecast By Market Taxonomy, 2025 to 2035
        • By Country
          • Russia
          • Poland
          • Hungary
          • Balkan & Baltics
          • Rest of Eastern Europe
        • By Vehicle Type
        • By Navigation Technology
        • By Battery
        • By Application
        • By End-User
      • Market Attractiveness Analysis
        • By Country
        • By Vehicle Type
        • By Navigation Technology
        • By Battery
        • By Application
        • By End-User
      • Key Takeaways
    • Middle East & Africa Market Analysis 2020 to 2024 and Forecast 2025 to 2035, By Country
      • Historical Market Size Value (USD Bn) & Volume (Units) Trend Analysis By Market Taxonomy, 2020 to 2024
      • Market Size Value (USD Bn) & Volume (Units) Forecast By Market Taxonomy, 2025 to 2035
        • By Country
          • KSA
          • Other GCC Countries
          • Turkiye
          • South Africa
          • Rest of MEA
        • By Vehicle Type
        • By Navigation Technology
        • By Battery
        • By Application
        • By End-User
      • Market Attractiveness Analysis
        • By Country
        • By Vehicle Type
        • By Navigation Technology
        • By Battery
        • By Application
        • By End-User
      • Key Takeaways
    • Key Countries Market Analysis
      • China
        • Pricing Analysis
        • Market Share Analysis, 2024
          • By Vehicle Type
          • By Navigation Technology
          • By Battery
          • By Application
          • By End-User
      • Germany
        • Pricing Analysis
        • Market Share Analysis, 2024
          • By Vehicle Type
          • By Navigation Technology
          • By Battery
          • By Application
          • By End-User
      • Value (USD Bn) & Volume (Units)ed States
        • Pricing Analysis
        • Market Share Analysis, 2024
          • By Vehicle Type
          • By Navigation Technology
          • By Battery
          • By Application
          • By End-User
      • Japan
        • Pricing Analysis
        • Market Share Analysis, 2024
          • By Vehicle Type
          • By Navigation Technology
          • By Battery
          • By Application
          • By End-User
      • South Korea
        • Pricing Analysis
        • Market Share Analysis, 2024
          • By Vehicle Type
          • By Navigation Technology
          • By Battery
          • By Application
          • By End-User
    • Market Structure Analysis
      • Competition Dashboard
      • Competition Benchmarking
      • Market Share Analysis of Top Players
        • By Regional
        • By Vehicle Type
        • By Navigation Technology
        • By Battery
        • By Application
        • By End-User
    • Competition Analysis
      • Competition Deep Dive
        • Addverb Technologies
          • Overview
          • Product Portfolio
          • Profitability by Market Segments (Product/Age /Sales Channel/Region)
          • Sales Footprint
          • Strategy Overview
            • Marketing Strategy
            • Product Strategy
            • Channel Strategy
        • Aichi Machine Industry Co., Ltd.
          • Overview
          • Product Portfolio
          • Profitability by Market Segments (Product/Age /Sales Channel/Region)
          • Sales Footprint
          • Strategy Overview
            • Marketing Strategy
            • Product Strategy
            • Channel Strategy
        • China SME Group Co., Ltd.
          • Overview
          • Product Portfolio
          • Profitability by Market Segments (Product/Age /Sales Channel/Region)
          • Sales Footprint
          • Strategy Overview
            • Marketing Strategy
            • Product Strategy
            • Channel Strategy
        • DAIFUKU GROUP
          • Overview
          • Product Portfolio
          • Profitability by Market Segments (Product/Age /Sales Channel/Region)
          • Sales Footprint
          • Strategy Overview
            • Marketing Strategy
            • Product Strategy
            • Channel Strategy
        • Egemin Automation Inc.
          • Overview
          • Product Portfolio
          • Profitability by Market Segments (Product/Age /Sales Channel/Region)
          • Sales Footprint
          • Strategy Overview
            • Marketing Strategy
            • Product Strategy
            • Channel Strategy
        • GreyOrange
          • Overview
          • Product Portfolio
          • Profitability by Market Segments (Product/Age /Sales Channel/Region)
          • Sales Footprint
          • Strategy Overview
            • Marketing Strategy
            • Product Strategy
            • Channel Strategy
        • GRIDBOTS
          • Overview
          • Product Portfolio
          • Profitability by Market Segments (Product/Age /Sales Channel/Region)
          • Sales Footprint
          • Strategy Overview
            • Marketing Strategy
            • Product Strategy
            • Channel Strategy
        • JBT Corporation
          • Overview
          • Product Portfolio
          • Profitability by Market Segments (Product/Age /Sales Channel/Region)
          • Sales Footprint
          • Strategy Overview
            • Marketing Strategy
            • Product Strategy
            • Channel Strategy
        • KOLEC
          • Overview
          • Product Portfolio
          • Profitability by Market Segments (Product/Age /Sales Channel/Region)
          • Sales Footprint
          • Strategy Overview
            • Marketing Strategy
            • Product Strategy
            • Channel Strategy
        • Konecranes
          • Overview
          • Product Portfolio
          • Profitability by Market Segments (Product/Age /Sales Channel/Region)
          • Sales Footprint
          • Strategy Overview
            • Marketing Strategy
            • Product Strategy
            • Channel Strategy
        • KUKA AG
          • Overview
          • Product Portfolio
          • Profitability by Market Segments (Product/Age /Sales Channel/Region)
          • Sales Footprint
          • Strategy Overview
            • Marketing Strategy
            • Product Strategy
            • Channel Strategy
        • Murata Machinery, Ltd.
          • Overview
          • Product Portfolio
          • Profitability by Market Segments (Product/Age /Sales Channel/Region)
          • Sales Footprint
          • Strategy Overview
            • Marketing Strategy
            • Product Strategy
            • Channel Strategy
        • Oceaneering International, Inc.
          • Overview
          • Product Portfolio
          • Profitability by Market Segments (Product/Age /Sales Channel/Region)
          • Sales Footprint
          • Strategy Overview
            • Marketing Strategy
            • Product Strategy
            • Channel Strategy
        • SHENZHEN MIRCOLOMAY TECHNOLOGY CO., LTD.
          • Overview
          • Product Portfolio
          • Profitability by Market Segments (Product/Age /Sales Channel/Region)
          • Sales Footprint
          • Strategy Overview
            • Marketing Strategy
            • Product Strategy
            • Channel Strategy
        • System Logistics S.p.A.
          • Overview
          • Product Portfolio
          • Profitability by Market Segments (Product/Age /Sales Channel/Region)
          • Sales Footprint
          • Strategy Overview
            • Marketing Strategy
            • Product Strategy
            • Channel Strategy
        • TOYOTA INDUSTRIES CORPORATION
          • Overview
          • Product Portfolio
          • Profitability by Market Segments (Product/Age /Sales Channel/Region)
          • Sales Footprint
          • Strategy Overview
            • Marketing Strategy
            • Product Strategy
            • Channel Strategy
    • Assumptions & Acronyms Used
    • Research Methodology

List Of Table

  • Table 1: Global Market Value (USD Bn) Forecast by Region, 2020 to 2035
  • Table 2: Global Market Volume (Units) Forecast by Region, 2020 to 2035
  • Table 3: Global Market Value (USD Bn) Forecast by Vehicle Type, 2020 to 2035
  • Table 4: Global Market Volume (Units) Forecast by Vehicle Type, 2020 to 2035
  • Table 5: Global Market Value (USD Bn) Forecast by Navigation Technology, 2020 to 2035
  • Table 6: Global Market Volume (Units) Forecast by Navigation Technology, 2020 to 2035
  • Table 7: Global Market Value (USD Bn) Forecast by Battery, 2020 to 2035
  • Table 8: Global Market Volume (Units) Forecast by Battery, 2020 to 2035
  • Table 9: Global Market Value (USD Bn) Forecast by Application, 2020 to 2035
  • Table 10: Global Market Volume (Units) Forecast by Application, 2020 to 2035
  • Table 11: Global Market Value (USD Bn) Forecast by End-User, 2020 to 2035
  • Table 12: Global Market Volume (Units) Forecast by End-User, 2020 to 2035
  • Table 13: North America Market Value (USD Bn) Forecast by Country, 2020 to 2035
  • Table 14: North America Market Volume (Units) Forecast by Country, 2020 to 2035
  • Table 15: North America Market Value (USD Bn) Forecast by Vehicle Type, 2020 to 2035
  • Table 16: North America Market Volume (Units) Forecast by Vehicle Type, 2020 to 2035
  • Table 17: North America Market Value (USD Bn) Forecast by Navigation Technology, 2020 to 2035
  • Table 18: North America Market Volume (Units) Forecast by Navigation Technology, 2020 to 2035
  • Table 19: North America Market Value (USD Bn) Forecast by Battery, 2020 to 2035
  • Table 20: North America Market Volume (Units) Forecast by Battery, 2020 to 2035
  • Table 21: North America Market Value (USD Bn) Forecast by Application, 2020 to 2035
  • Table 22: North America Market Volume (Units) Forecast by Application, 2020 to 2035
  • Table 23: North America Market Value (USD Bn) Forecast by End-User, 2020 to 2035
  • Table 24: North America Market Volume (Units) Forecast by End-User, 2020 to 2035
  • Table 25: Latin America Market Value (USD Bn) Forecast by Country, 2020 to 2035
  • Table 26: Latin America Market Volume (Units) Forecast by Country, 2020 to 2035
  • Table 27: Latin America Market Value (USD Bn) Forecast by Vehicle Type, 2020 to 2035
  • Table 28: Latin America Market Volume (Units) Forecast by Vehicle Type, 2020 to 2035
  • Table 29: Latin America Market Value (USD Bn) Forecast by Navigation Technology, 2020 to 2035
  • Table 30: Latin America Market Volume (Units) Forecast by Navigation Technology, 2020 to 2035
  • Table 31: Latin America Market Value (USD Bn) Forecast by Battery, 2020 to 2035
  • Table 32: Latin America Market Volume (Units) Forecast by Battery, 2020 to 2035
  • Table 33: Latin America Market Value (USD Bn) Forecast by Application, 2020 to 2035
  • Table 34: Latin America Market Volume (Units) Forecast by Application, 2020 to 2035
  • Table 35: Latin America Market Value (USD Bn) Forecast by End-User, 2020 to 2035
  • Table 36: Latin America Market Volume (Units) Forecast by End-User, 2020 to 2035
  • Table 37: Western Europe Market Value (USD Bn) Forecast by Country, 2020 to 2035
  • Table 38: Western Europe Market Volume (Units) Forecast by Country, 2020 to 2035
  • Table 39: Western Europe Market Value (USD Bn) Forecast by Vehicle Type, 2020 to 2035
  • Table 40: Western Europe Market Volume (Units) Forecast by Vehicle Type, 2020 to 2035
  • Table 41: Western Europe Market Value (USD Bn) Forecast by Navigation Technology, 2020 to 2035
  • Table 42: Western Europe Market Volume (Units) Forecast by Navigation Technology, 2020 to 2035
  • Table 43: Western Europe Market Value (USD Bn) Forecast by Battery, 2020 to 2035
  • Table 44: Western Europe Market Volume (Units) Forecast by Battery, 2020 to 2035
  • Table 45: Western Europe Market Value (USD Bn) Forecast by Application, 2020 to 2035
  • Table 46: Western Europe Market Volume (Units) Forecast by Application, 2020 to 2035
  • Table 47: Western Europe Market Value (USD Bn) Forecast by End-User, 2020 to 2035
  • Table 48: Western Europe Market Volume (Units) Forecast by End-User, 2020 to 2035
  • Table 49: East Asia Market Value (USD Bn) Forecast by Country, 2020 to 2035
  • Table 50: East Asia Market Volume (Units) Forecast by Country, 2020 to 2035
  • Table 51: East Asia Market Value (USD Bn) Forecast by Vehicle Type, 2020 to 2035
  • Table 52: East Asia Market Volume (Units) Forecast by Vehicle Type, 2020 to 2035
  • Table 53: East Asia Market Value (USD Bn) Forecast by Navigation Technology, 2020 to 2035
  • Table 54: East Asia Market Volume (Units) Forecast by Navigation Technology, 2020 to 2035
  • Table 55: East Asia Market Value (USD Bn) Forecast by Battery, 2020 to 2035
  • Table 56: East Asia Market Volume (Units) Forecast by Battery, 2020 to 2035
  • Table 57: East Asia Market Value (USD Bn) Forecast by Application, 2020 to 2035
  • Table 58: East Asia Market Volume (Units) Forecast by Application, 2020 to 2035
  • Table 59: East Asia Market Value (USD Bn) Forecast by End-User, 2020 to 2035
  • Table 60: East Asia Market Volume (Units) Forecast by End-User, 2020 to 2035
  • Table 61: South Asia Pacific Market Value (USD Bn) Forecast by Country, 2020 to 2035
  • Table 62: South Asia Pacific Market Volume (Units) Forecast by Country, 2020 to 2035
  • Table 63: South Asia Pacific Market Value (USD Bn) Forecast by Vehicle Type, 2020 to 2035
  • Table 64: South Asia Pacific Market Volume (Units) Forecast by Vehicle Type, 2020 to 2035
  • Table 65: South Asia Pacific Market Value (USD Bn) Forecast by Navigation Technology, 2020 to 2035
  • Table 66: South Asia Pacific Market Volume (Units) Forecast by Navigation Technology, 2020 to 2035
  • Table 67: South Asia Pacific Market Value (USD Bn) Forecast by Battery, 2020 to 2035
  • Table 68: South Asia Pacific Market Volume (Units) Forecast by Battery, 2020 to 2035
  • Table 69: South Asia Pacific Market Value (USD Bn) Forecast by Application, 2020 to 2035
  • Table 70: South Asia Pacific Market Volume (Units) Forecast by Application, 2020 to 2035
  • Table 71: South Asia Pacific Market Value (USD Bn) Forecast by End-User, 2020 to 2035
  • Table 72: South Asia Pacific Market Volume (Units) Forecast by End-User, 2020 to 2035
  • Table 73: Eastern Europe Market Value (USD Bn) Forecast by Country, 2020 to 2035
  • Table 74: Eastern Europe Market Volume (Units) Forecast by Country, 2020 to 2035
  • Table 75: Eastern Europe Market Value (USD Bn) Forecast by Vehicle Type, 2020 to 2035
  • Table 76: Eastern Europe Market Volume (Units) Forecast by Vehicle Type, 2020 to 2035
  • Table 77: Eastern Europe Market Value (USD Bn) Forecast by Navigation Technology, 2020 to 2035
  • Table 78: Eastern Europe Market Volume (Units) Forecast by Navigation Technology, 2020 to 2035
  • Table 79: Eastern Europe Market Value (USD Bn) Forecast by Battery, 2020 to 2035
  • Table 80: Eastern Europe Market Volume (Units) Forecast by Battery, 2020 to 2035
  • Table 81: Eastern Europe Market Value (USD Bn) Forecast by Application, 2020 to 2035
  • Table 82: Eastern Europe Market Volume (Units) Forecast by Application, 2020 to 2035
  • Table 83: Eastern Europe Market Value (USD Bn) Forecast by End-User, 2020 to 2035
  • Table 84: Eastern Europe Market Volume (Units) Forecast by End-User, 2020 to 2035
  • Table 85: Middle East & Africa Market Value (USD Bn) Forecast by Country, 2020 to 2035
  • Table 86: Middle East & Africa Market Volume (Units) Forecast by Country, 2020 to 2035
  • Table 87: Middle East & Africa Market Value (USD Bn) Forecast by Vehicle Type, 2020 to 2035
  • Table 88: Middle East & Africa Market Volume (Units) Forecast by Vehicle Type, 2020 to 2035
  • Table 89: Middle East & Africa Market Value (USD Bn) Forecast by Navigation Technology, 2020 to 2035
  • Table 90: Middle East & Africa Market Volume (Units) Forecast by Navigation Technology, 2020 to 2035
  • Table 91: Middle East & Africa Market Value (USD Bn) Forecast by Battery, 2020 to 2035
  • Table 92: Middle East & Africa Market Volume (Units) Forecast by Battery, 2020 to 2035
  • Table 93: Middle East & Africa Market Value (USD Bn) Forecast by Application, 2020 to 2035
  • Table 94: Middle East & Africa Market Volume (Units) Forecast by Application, 2020 to 2035
  • Table 95: Middle East & Africa Market Value (USD Bn) Forecast by End-User, 2020 to 2035
  • Table 96: Middle East & Africa Market Volume (Units) Forecast by End-User, 2020 to 2035

List Of Figures

  • Figure 1: Global Market Volume (Units) Forecast 2020 to 2035
  • Figure 2: Global Market Pricing Analysis
  • Figure 3: Global Market Value (USD Bn) Forecast 2020 to 2035
  • Figure 4: Global Market Value Share and BPS Analysis by Vehicle Type, 2025 and 2035
  • Figure 5: Global Market Y-o-Y Growth Comparison by Vehicle Type, 2025 to 2035
  • Figure 6: Global Market Attractiveness Analysis by Vehicle Type
  • Figure 7: Global Market Value Share and BPS Analysis by Navigation Technology, 2025 and 2035
  • Figure 8: Global Market Y-o-Y Growth Comparison by Navigation Technology, 2025 to 2035
  • Figure 9: Global Market Attractiveness Analysis by Navigation Technology
  • Figure 10: Global Market Value Share and BPS Analysis by Battery, 2025 and 2035
  • Figure 11: Global Market Y-o-Y Growth Comparison by Battery, 2025 to 2035
  • Figure 12: Global Market Attractiveness Analysis by Battery
  • Figure 13: Global Market Value Share and BPS Analysis by Application, 2025 and 2035
  • Figure 14: Global Market Y-o-Y Growth Comparison by Application, 2025 to 2035
  • Figure 15: Global Market Attractiveness Analysis by Application
  • Figure 16: Global Market Value Share and BPS Analysis by End-User, 2025 and 2035
  • Figure 17: Global Market Y-o-Y Growth Comparison by End-User, 2025 to 2035
  • Figure 18: Global Market Attractiveness Analysis by End-User
  • Figure 19: Global Market Value (USD Bn) Share and BPS Analysis by Region, 2025 and 2035
  • Figure 20: Global Market Y-o-Y Growth Comparison by Region, 2025 to 2035
  • Figure 21: Global Market Attractiveness Analysis by Region
  • Figure 22: North America Market Incremental $ Opportunity, 2025 to 2035
  • Figure 23: Latin America Market Incremental $ Opportunity, 2025 to 2035
  • Figure 24: Western Europe Market Incremental $ Opportunity, 2025 to 2035
  • Figure 25: East Asia Market Incremental $ Opportunity, 2025 to 2035
  • Figure 26: South Asia Pacific Market Incremental $ Opportunity, 2025 to 2035
  • Figure 27: Eastern Europe Market Incremental $ Opportunity, 2025 to 2035
  • Figure 28: Middle East & Africa Market Incremental $ Opportunity, 2025 to 2035
  • Figure 29: North America Market Value Share and BPS Analysis by Country, 2025 and 2035
  • Figure 30: North America Market Value Share and BPS Analysis by Vehicle Type, 2025 and 2035
  • Figure 31: North America Market Y-o-Y Growth Comparison by Vehicle Type, 2025 to 2035
  • Figure 32: North America Market Attractiveness Analysis by Vehicle Type
  • Figure 33: North America Market Value Share and BPS Analysis by Navigation Technology, 2025 and 2035
  • Figure 34: North America Market Y-o-Y Growth Comparison by Navigation Technology, 2025 to 2035
  • Figure 35: North America Market Attractiveness Analysis by Navigation Technology
  • Figure 36: North America Market Value Share and BPS Analysis by Battery, 2025 and 2035
  • Figure 37: North America Market Y-o-Y Growth Comparison by Battery, 2025 to 2035
  • Figure 38: North America Market Attractiveness Analysis by Battery
  • Figure 39: North America Market Value Share and BPS Analysis by Application, 2025 and 2035
  • Figure 40: North America Market Y-o-Y Growth Comparison by Application, 2025 to 2035
  • Figure 41: North America Market Attractiveness Analysis by Application
  • Figure 42: North America Market Value Share and BPS Analysis by End-User, 2025 and 2035
  • Figure 43: North America Market Y-o-Y Growth Comparison by End-User, 2025 to 2035
  • Figure 44: North America Market Attractiveness Analysis by End-User
  • Figure 45: Latin America Market Value Share and BPS Analysis by Country, 2025 and 2035
  • Figure 46: Latin America Market Value Share and BPS Analysis by Vehicle Type, 2025 and 2035
  • Figure 47: Latin America Market Y-o-Y Growth Comparison by Vehicle Type, 2025 to 2035
  • Figure 48: Latin America Market Attractiveness Analysis by Vehicle Type
  • Figure 49: Latin America Market Value Share and BPS Analysis by Navigation Technology, 2025 and 2035
  • Figure 50: Latin America Market Y-o-Y Growth Comparison by Navigation Technology, 2025 to 2035
  • Figure 51: Latin America Market Attractiveness Analysis by Navigation Technology
  • Figure 52: Latin America Market Value Share and BPS Analysis by Battery, 2025 and 2035
  • Figure 53: Latin America Market Y-o-Y Growth Comparison by Battery, 2025 to 2035
  • Figure 54: Latin America Market Attractiveness Analysis by Battery
  • Figure 55: Latin America Market Value Share and BPS Analysis by Application, 2025 and 2035
  • Figure 56: Latin America Market Y-o-Y Growth Comparison by Application, 2025 to 2035
  • Figure 57: Latin America Market Attractiveness Analysis by Application
  • Figure 58: Latin America Market Value Share and BPS Analysis by End-User, 2025 and 2035
  • Figure 59: Latin America Market Y-o-Y Growth Comparison by End-User, 2025 to 2035
  • Figure 60: Latin America Market Attractiveness Analysis by End-User
  • Figure 61: Western Europe Market Value Share and BPS Analysis by Country, 2025 and 2035
  • Figure 62: Western Europe Market Value Share and BPS Analysis by Vehicle Type, 2025 and 2035
  • Figure 63: Western Europe Market Y-o-Y Growth Comparison by Vehicle Type, 2025 to 2035
  • Figure 64: Western Europe Market Attractiveness Analysis by Vehicle Type
  • Figure 65: Western Europe Market Value Share and BPS Analysis by Navigation Technology, 2025 and 2035
  • Figure 66: Western Europe Market Y-o-Y Growth Comparison by Navigation Technology, 2025 to 2035
  • Figure 67: Western Europe Market Attractiveness Analysis by Navigation Technology
  • Figure 68: Western Europe Market Value Share and BPS Analysis by Battery, 2025 and 2035
  • Figure 69: Western Europe Market Y-o-Y Growth Comparison by Battery, 2025 to 2035
  • Figure 70: Western Europe Market Attractiveness Analysis by Battery
  • Figure 71: Western Europe Market Value Share and BPS Analysis by Application, 2025 and 2035
  • Figure 72: Western Europe Market Y-o-Y Growth Comparison by Application, 2025 to 2035
  • Figure 73: Western Europe Market Attractiveness Analysis by Application
  • Figure 74: Western Europe Market Value Share and BPS Analysis by End-User, 2025 and 2035
  • Figure 75: Western Europe Market Y-o-Y Growth Comparison by End-User, 2025 to 2035
  • Figure 76: Western Europe Market Attractiveness Analysis by End-User
  • Figure 77: East Asia Market Value Share and BPS Analysis by Country, 2025 and 2035
  • Figure 78: East Asia Market Value Share and BPS Analysis by Vehicle Type, 2025 and 2035
  • Figure 79: East Asia Market Y-o-Y Growth Comparison by Vehicle Type, 2025 to 2035
  • Figure 80: East Asia Market Attractiveness Analysis by Vehicle Type
  • Figure 81: East Asia Market Value Share and BPS Analysis by Navigation Technology, 2025 and 2035
  • Figure 82: East Asia Market Y-o-Y Growth Comparison by Navigation Technology, 2025 to 2035
  • Figure 83: East Asia Market Attractiveness Analysis by Navigation Technology
  • Figure 84: East Asia Market Value Share and BPS Analysis by Battery, 2025 and 2035
  • Figure 85: East Asia Market Y-o-Y Growth Comparison by Battery, 2025 to 2035
  • Figure 86: East Asia Market Attractiveness Analysis by Battery
  • Figure 87: East Asia Market Value Share and BPS Analysis by Application, 2025 and 2035
  • Figure 88: East Asia Market Y-o-Y Growth Comparison by Application, 2025 to 2035
  • Figure 89: East Asia Market Attractiveness Analysis by Application
  • Figure 90: East Asia Market Value Share and BPS Analysis by End-User, 2025 and 2035
  • Figure 91: East Asia Market Y-o-Y Growth Comparison by End-User, 2025 to 2035
  • Figure 92: East Asia Market Attractiveness Analysis by End-User
  • Figure 93: South Asia Pacific Market Value Share and BPS Analysis by Country, 2025 and 2035
  • Figure 94: South Asia Pacific Market Value Share and BPS Analysis by Vehicle Type, 2025 and 2035
  • Figure 95: South Asia Pacific Market Y-o-Y Growth Comparison by Vehicle Type, 2025 to 2035
  • Figure 96: South Asia Pacific Market Attractiveness Analysis by Vehicle Type
  • Figure 97: South Asia Pacific Market Value Share and BPS Analysis by Navigation Technology, 2025 and 2035
  • Figure 98: South Asia Pacific Market Y-o-Y Growth Comparison by Navigation Technology, 2025 to 2035
  • Figure 99: South Asia Pacific Market Attractiveness Analysis by Navigation Technology
  • Figure 100: South Asia Pacific Market Value Share and BPS Analysis by Battery, 2025 and 2035
  • Figure 101: South Asia Pacific Market Y-o-Y Growth Comparison by Battery, 2025 to 2035
  • Figure 102: South Asia Pacific Market Attractiveness Analysis by Battery
  • Figure 103: South Asia Pacific Market Value Share and BPS Analysis by Application, 2025 and 2035
  • Figure 104: South Asia Pacific Market Y-o-Y Growth Comparison by Application, 2025 to 2035
  • Figure 105: South Asia Pacific Market Attractiveness Analysis by Application
  • Figure 106: South Asia Pacific Market Value Share and BPS Analysis by End-User, 2025 and 2035
  • Figure 107: South Asia Pacific Market Y-o-Y Growth Comparison by End-User, 2025 to 2035
  • Figure 108: South Asia Pacific Market Attractiveness Analysis by End-User
  • Figure 109: Eastern Europe Market Value Share and BPS Analysis by Country, 2025 and 2035
  • Figure 110: Eastern Europe Market Value Share and BPS Analysis by Vehicle Type, 2025 and 2035
  • Figure 111: Eastern Europe Market Y-o-Y Growth Comparison by Vehicle Type, 2025 to 2035
  • Figure 112: Eastern Europe Market Attractiveness Analysis by Vehicle Type
  • Figure 113: Eastern Europe Market Value Share and BPS Analysis by Navigation Technology, 2025 and 2035
  • Figure 114: Eastern Europe Market Y-o-Y Growth Comparison by Navigation Technology, 2025 to 2035
  • Figure 115: Eastern Europe Market Attractiveness Analysis by Navigation Technology
  • Figure 116: Eastern Europe Market Value Share and BPS Analysis by Battery, 2025 and 2035
  • Figure 117: Eastern Europe Market Y-o-Y Growth Comparison by Battery, 2025 to 2035
  • Figure 118: Eastern Europe Market Attractiveness Analysis by Battery
  • Figure 119: Eastern Europe Market Value Share and BPS Analysis by Application, 2025 and 2035
  • Figure 120: Eastern Europe Market Y-o-Y Growth Comparison by Application, 2025 to 2035
  • Figure 121: Eastern Europe Market Attractiveness Analysis by Application
  • Figure 122: Eastern Europe Market Value Share and BPS Analysis by End-User, 2025 and 2035
  • Figure 123: Eastern Europe Market Y-o-Y Growth Comparison by End-User, 2025 to 2035
  • Figure 124: Eastern Europe Market Attractiveness Analysis by End-User
  • Figure 125: Middle East & Africa Market Value Share and BPS Analysis by Country, 2025 and 2035
  • Figure 126: Middle East & Africa Market Value Share and BPS Analysis by Vehicle Type, 2025 and 2035
  • Figure 127: Middle East & Africa Market Y-o-Y Growth Comparison by Vehicle Type, 2025 to 2035
  • Figure 128: Middle East & Africa Market Attractiveness Analysis by Vehicle Type
  • Figure 129: Middle East & Africa Market Value Share and BPS Analysis by Navigation Technology, 2025 and 2035
  • Figure 130: Middle East & Africa Market Y-o-Y Growth Comparison by Navigation Technology, 2025 to 2035
  • Figure 131: Middle East & Africa Market Attractiveness Analysis by Navigation Technology
  • Figure 132: Middle East & Africa Market Value Share and BPS Analysis by Battery, 2025 and 2035
  • Figure 133: Middle East & Africa Market Y-o-Y Growth Comparison by Battery, 2025 to 2035
  • Figure 134: Middle East & Africa Market Attractiveness Analysis by Battery
  • Figure 135: Middle East & Africa Market Value Share and BPS Analysis by Application, 2025 and 2035
  • Figure 136: Middle East & Africa Market Y-o-Y Growth Comparison by Application, 2025 to 2035
  • Figure 137: Middle East & Africa Market Attractiveness Analysis by Application
  • Figure 138: Middle East & Africa Market Value Share and BPS Analysis by End-User, 2025 and 2035
  • Figure 139: Middle East & Africa Market Y-o-Y Growth Comparison by End-User, 2025 to 2035
  • Figure 140: Middle East & Africa Market Attractiveness Analysis by End-User
  • Figure 141: Global Market – Tier Structure Analysis
  • Figure 142: Global Market – Company Share Analysis

- FAQs -

What is the global automated guided vehicle market size in 2025?

The automated guided vehicle market is valued at USD 4.1 billion in 2025.

Who are the major players operating in the automated guided vehicle market?

Prominent players in the market include DAIFUKU GROUP, Egemin Automation Inc., GreyOrange, GRIDBOTS, JBT Corporation, KOLEC, and Konecranes.

What is the estimated valuation of the automated guided vehicle market by 2035?

The market is expected to reach a valuation of USD 13.3 billion by 2035.

What Value CAGR did the automated guided vehicle market exhibit over the last five years?

The historic growth rate of the automated guided vehicle market was 11.2% from 2020 to 2024.

- Also of Interest -

Automated Truck Market

Automated Truck Market Study by Adaptive Cruise Control, Lane Keep Assist, Automatic Emergency Braking, Blind Spot Detection, Intelligent Park Assist, Highway Pilot, and Others from 2023 to 2033

Vehicle Mounted Spotlight Market

Vehicle Mounted Spotlight Market Analysis, By Light Source (LED, HID, Halogen, Incandescent), By Wattage, By Lumen, By Control Type, By Module Shape, By End User, By Sales Channel, and Region - Market Insights 2025 to 2035

Vehicle Parking Meter Market

Vehicle Parking Meter Market Study by Legacy and Smart Meters for Parking Streets, Malls, Hospitals, and Public & Private Institutions from 2024 to 2034

Vehicle Access Control Market

Vehicle Access Control Market Analysis by Non-biometric Systems and Biometric Systems for Passenger Cars, Light Commercial Vehicles, Heavy Commercial Vehicles, and Electric Vehicles from 2023 to 2033

Automated Guided Vehicle Market

Schedule a Call