


- Base Value(2025): 22098 Mn
- Forecast Value (2035): 61070 Mn
- CAGR (2035): 11.8%
Arterial Stents Market Outlook (2025 to 2035)
The global arterial stents market is expected to reach USD 61,070 million by 2035, up from USD 19,962 million in 2024. During the forecast period (2025 to 2035), the industry is projected to expand at a CAGR of 10.7%.
Arterial stents are widely used devices for the restoration of blood supply and the prevention of occlusion among cardiovascular patients. Applied in vascular surgery and interventional cardiology, arterial stents play a critical role in procedures involving the iliac, coronary, carotid, and femoral arteries.
-2025-to-2035.webp)
Technological advancements by drug-eluting devices, flexibility, and bioresorbable platforms improve biocompatibility, performance, and minimally invasive therapy, driving innovation and growth of the arterial stents market.
Quick Facts for Arterial Stents Market
- Industry Value (2025): USD 22,098 Million
- Projected Value (2035): USD 61,070 Million
- Forecast CAGR (2025 to 2035): 10.7%
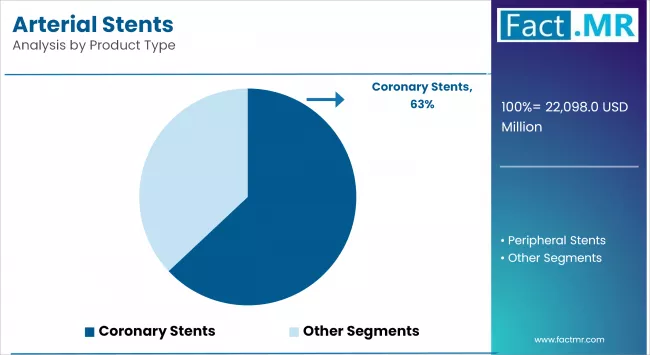
- Leading Segment (2025): Coronary Stents (63% Market Share)
- Country Growth Rate (2025 to 2035): China (11.2% CAGR)
- Key Players: Abbott Vascular, Biosensors International Group, BIOTRONIK AG, and Boston Scientific Corporation
What are the drivers of the arterial stents market?
The growing demands for arterial stents are associated with increasing cardiovascular diseases, which remain a primary cause of mortality and morbidity worldwide. An aging population, higher prevalence of diabetes and hypertension, and poor lifestyle habits are among the key factors contributing to the increased need for stent procedures. The number of patients requiring intervention for blocked or narrowed arteries continues to increase, supporting the uptake of stents through percutaneous coronary interventions (PCI).
Technology-led developments are also driving market growth. Advancement from bare-metal stents (BMS) to drug-eluting stents (DES) reduces the rate of restenosis strides and bounds while providing more healing to patients. Advancement using bioresorbable scaffolding and polymer-free stents provides greater safety and long-term effectiveness. Advancements in next-generation stents with greater pliability, biocompatibility, and drug coating further enhance the process with more efficacy while improving treatment efficiency and adoption among clinicians.
Expanding healthcare access, reimbursement coverage, and hospital infrastructure are supporting the arterial stent market. Emerging economies are investing in interventional cardiology services, and access to advanced care is becoming more widespread. An increasing number of medical travelers to nations within the Middle East and Asia-Pacific is also a factor that is facilitating market penetration.
Minimally invasive interventions remain a key driver. Both physicians and patients are opting to use PCI instead of the conventional coronary artery bypass grafting (CABG) because of the reduced time in hospitals, less time to recover and fewer complications. More sensitization, earlier detection of cardiovascular diseases, and increased accessibility of angioplasty procedures are projected to increase the need for arterial stents. All of these factors are expected to promote stable growth in the arterial stents market over the next two years.
What are the regional trends of the arterial stents market?
North America has significant market penetration of arterial stents due to its developed health system, high healthcare spending, and broad presence of market participants. The United States, in particular, reports elevated PCI rates due to the prevalence of cardiovascular disease and widespread applications of sophisticated stent technology. Open-ended reimbursement policies coupled with stringent regulatory standards also revolutionize the market within the region.
Europe is also a mature market, with key contributions from Germany, the United Kingdom, and France. The region faces an aging population and increasing prevalence of lifestyle-related conditions. The presence of strong R&D and the established healthcare infrastructure is a positive factor for arterial stent acceptance. The priority of patient safety promoted by regulations has led to sustained use of the drug-eluting and bioabsorbable stents.
Asia-Pacific is experiencing a gradual increase in its growth due to factors such as urbanization, an increase in healthcare spending, and high levels of cardiovascular disease. The contribution of India and China is through the emerging middle-class, increased access to care and government-supported interventional cardiology programs. The improvement of Malaysia and Thailand can be attributed to cost-effective stent technologies and medical travel. South Korea and Japan are mature markets with developed healthcare facilities and a large-scale implementation of the newer-generation stents.
The Middle East and Africa are also undergoing gradual change, particularly in Gulf nations that are increasing investment in cardiac care infrastructure. In other parts of the region, limited access to healthcare remains a constraint, though progress is evident. Latin American countries such as Mexico and Brazil are also evolving, with government-backed initiatives for cardiovascular treatment and expanded insurance coverage.
What are the challenges and restraining factors of the arterial stents market?
High prices are one of the primary constraints in the arterial stents market. Drug-eluting and bioresorbable stent devices are technology-intensive products, and thus their application is restricted in cost-conscious markets. Cost is a deterrent to patients and physicians in emerging economies, reducing the potential for widespread use of advanced stent systems.
Compliance and regulatory clearances are also complex. The arterial stent business is mainly governed by organizations such as the U.S. FDA and European Medicines Agency (EMA) and follows stringent clearance procedures. While these regulations ensure patient safety, they also extend the timeline for product approval and increase operational costs for manufacturers. Adherence to varying international standards may create additional barriers for smaller companies.
Adverse clinical outcomes such as restenosis and stent thrombosis remain concerns. Although second-generation drug-eluting stents have reduced these risks, they have not eliminated them. Patients often require long-term antiplatelet therapy, which increases treatment complexity and cost. The possibility of re-intervention due to restenosis may also impact long-term market stability.
Competition from alternative treatments presents another challenge. While PCI is a widely used therapy, advances in other revascularization procedures, including coronary artery bypass grafting (CABG) and non-stent-based interventions, could limit future demand for arterial stents. In addition, disruptions in the supply chain and variability in raw material costs contribute to pricing uncertainty and add complexity to market dynamics.
Country-Wise Outlook
| Country | CAGR (2025 to 2035) |
|---|---|
| U.S. | 9.9% |
| China | 11.2% |
| India | 10.8% |
FDA-backed safety and advanced procedures elevate U.S. arterial stent innovation
U.S. artery stent market is growing consistently with increased incidence of cardiovascular disease, utilization of minimally invasive devices, and accessible healthcare facilities. Medicare and private payers' favorable reimbursement policies and strong device manufacturers are some of the drivers of the market.
-2025-to-2035.webp)
Technological innovations like drug-eluting stents with increased biocompatibility and bioresorbable stents are ranked higher on the priority list in the market. Safety and performance are being guaranteed by FDA regulations, for which firms require R&D investment in next-generation stent technology. The aging population of the country, along with increased utilization of advanced catheterization procedures, also increases demand for advanced artery stents.
Healthcare reforms and domestic innovation accelerate China’s arterial stent expansion
The market for Chinese artery stents is growing rapidly due to the increasing prevalence of cardiovascular diseases, health spending, and the growth in the number of middle-class consumers with heightened health awareness. The "Healthy China 2030" and increased government spending on healthcare are fueling the market, along with domestic companies gaining presence in the stent segment.
The market is advancing toward next-generation drug-eluting stents and bioresorbable vascular scaffolds, encouraged by local R&D investment and collaborations with international manufacturers. Regulatory reforms introduced by the National Medical Products Administration aim to streamline approval processes while maintaining quality standards. The growing demand for cost-effective stent products, driven by fast-paced urbanization and expansion of hospital infrastructure, continues to support market growth.
Affordable access and tier-2 expansion propel India’s arterial stent market growth
Indian market for artery stenting is expanding at a rapid rate, driven by an increased number of cardiovascular diseases, enhanced access to healthcare, and insurance coverages like Ayushman Bharat. National Pharmaceutical Pricing Authority (NPPA) price control made superior quality stents affordable to a larger patient base.
Local stents are taking over the market in larger numbers since they are more affordable than the imported type. Demand for percutaneous coronary intervention (PCI) and higher penetration by private players in the healthcare sector in tier-2 and tier-3 cities are among the growth drivers. Other joint ventures by multinationals and Indian healthcare operators are also driving innovation in stent technology, thereby enhancing competitive activity in the market.
Category-Wise Analysis
Drug-eluting dominance grows as innovation and CAD burden drive DES adoption
Drug-eluting stents (DES) hold a dominant position in the arterial stent market due to their ability to reduce the need for re-intervention and lower the risk of restenosis. These stents release anti-proliferative drugs that inhibit abnormal tissue growth, thereby supporting improved long-term outcomes for patients.
The growing prevalence of CAD and technological advancements in drug delivery and polymer coating technologies are propelling demand for DES. New-generation DES product launches with higher biocompatibility and less risk of thrombosis are also propelling adoption. Higher volumes of elderly patients and growing awareness of minimally invasive cardiovascular treatment are propelling the DES segment in the long term.
Lifestyle diseases and advanced DES tech sustain coronary artery stent dominance
The coronary artery segment is the largest application segment for arterial stents since coronary artery disease is among the highest incidence cardiovascular diseases globally. The increasing incidence of lifestyle disorders like obesity, hypertension, and diabetes is fueling demand for the stenting process.
Ultra-thin strut drug-eluting stent (DES) and bio-absorbable scaffolding technology further enhance the treatment effectiveness, and coronary stenting is widely accepted as the first-line treatment in high-risk patients globally. Enhancing healthcare infrastructure and positive government policies towards reimbursement in the emerging markets will further drive spectacular growth in this segment.
Infrastructure upgrades and cath lab expansion drive hospital-led arterial stent demand
The coronary artery segment represents the leading application area for arterial stents, as coronary artery disease remains one of the most prevalent cardiovascular conditions globally. The increased occurrence of lifestyle-related disorders such as obesity, hypertension, and diabetes continues to support demand for stent-based interventions.
Technologies such as ultra-thin strut drug-eluting stents (DES) and bioabsorbable scaffolds have improved the effectiveness of treatment, with coronary stenting now widely accepted as a primary option for high-risk patients. Improvements in healthcare infrastructure and supportive government reimbursement policies in emerging markets are expected to further support the expansion of this application segment.
Competitive Analysis
Increasing demand for arterial stents, along with the growing incidence of cardiovascular disease, advancements in stent technologies, and broader adoption of minimally invasive procedures, is encouraging companies to develop bioresorbable stents, drug-eluting stents, and second-generation vascular scaffolds aimed at improving procedural success and patient outcomes.
Strategic partnerships, acquisitions, and investments in robotic-assisted stent implantation and AI-based imaging are contributing to a significant transformation in the field. Companies are also introducing biodegradable stents and polymer-coated models focused on enhancing biocompatibility and long-term performance.
Key players in the arterial stents industry include Abbott Vascular (Abbott Laboratories), Biosensors International Group, BIOTRONIK AG, Boston Scientific Corporation, C. R. Bard, Inc. (BARD Peripheral Vascular), Cook Medical, Cordis Corporation (A Cardinal Health Company), Lifetech Scientific, Medtronic, and W. L. Gore & Associates, Inc.
Recent Developments
- In October 2024, Elixir Medical's DynamX bioadaptor, an adaptable heart implant, demonstrated promising results in reducing heart attack rates and the need for repeat procedures compared to traditional stents. In a trial involving 2,399 Swedish patients, the bioadaptor allowed arteries to resume natural functions post-implantation, offering a potential improvement over conventional stents.
- In July 2024, Boston Scientific Corporation announced the acquisition of Devoro Medical, Inc., a company specializing in innovative thrombectomy technology. This strategic move aims to enhance Boston Scientific's vascular intervention portfolio, particularly in addressing acute thrombotic events, thereby improving patient outcomes in arterial procedures.
Fact.MR has provided detailed information about the price points of key manufacturers of the Arterial Stents Market positioned across regions, sales growth, production capacity, and speculative technological expansion, in the recently published report.
Methodology and Industry Tracking Approach
The global arterial stents market 2025 is presented on the basis of the data and the opinions of over 12000 representatives of the healthcare industry, researchers, interventional cardiologists, vascular surgeons, and biomedical engineers worldwide, representing more than 30 countries. The study was conducted from July 2024 to June 2025 on a methodologically and methodically adjusted research of formulative nature in the form of a questionnaire.
The study took into consideration the following important aspects; precision of arterial stent insertion and patency, adaptability to the implementation of the technology across the different cardiovascular conditions, compatibility with the programming with artificial intelligence and cloud-based imaging, adherence with the minimally invasive and hybrid surgical intervention scope, ease of portability and application in inpatient, outpatient, and mobile healthcare environment and reliability of medical devices by the standards of clinical efficacy and sustainability during the long-term operation periods in the global markets.
The outcomes were confirmed through over 300 substantiated publications, including global cardiovascular clinical recommendations, FDA / NMPA / CE approval, product specifications of major stent companies, and infrastructural capability of digitally linked and hybrid operating environments.
Segmentation of Arterial Stents Market
-
By Product :
- Coronary Stents
- Bare Metal Stents
- Drug-eluting Stents
- Bioreabsorbable Stents
- Others
- Peripheral Stents
- Self-expandable Stents
- Balloon-expanding Stents
- Others
-
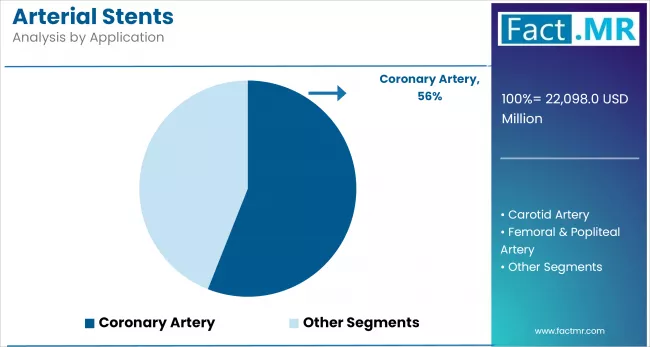
By Application :
- Coronary Artery
- Carotid Artery
- Iliac Artery
- Femoral & Popliteal Artery
- Others
-
By End-user :
- Hospitals & Diagnostic Centers
- Ambulatory Surgical Centers
- Specialty Clinics
- Catheterization Laboratories
- Others
-
By Region :
- North America
- Latin America
- Western Europe
- Eastern Europe
- East Asia
- South Asia & Pacific
- Middle East & Africa
- Frequently Asked Questions -
What was the Global Arterial Stents Market Size Reported by Fact.MR for 2025?
The global arterial stents market was valued at USD 22,098 million in 2025.
Who are the Major Players Operating in the Arterial Stents Market?
Prominent players in the market are Abbott Vascular (Abbott Laboratories), Biosensors International Group, BIOTRONIK AG, Boston Scientific Corporation, C. R. Bard, Inc. (BARD Peripheral Vascular), among others.
What is the Estimated Valuation of the Arterial Stents Market in 2035?
The market is expected to reach a valuation of USD 61,070 million in 2035.
What Value CAGR did the Arterial Stents Market Exhibit Over the Last Five Years?
The historic growth rate of the arterial stents market was 10.3% from 2020-2024.